Copyright
©2011 Baishideng Publishing Group Co.
World J Clin Oncol. Jan 10, 2011; 2(1): 64-72
Published online Jan 10, 2011. doi: 10.5306/wjco.v2.i1.64
Published online Jan 10, 2011. doi: 10.5306/wjco.v2.i1.64
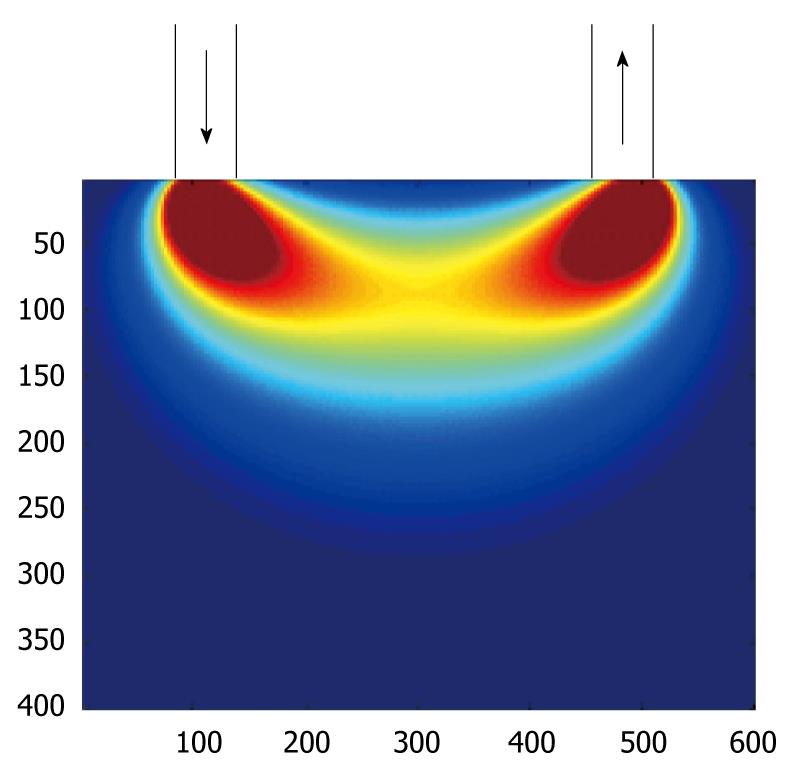
Figure 1 Sensitivity function of a single source-detector pair, calculated by analytical half-space Green’s function of photon diffusion equation.
The most sensitive position appears to be the region directly below the source and detector.
Figure 2 Various types of diffuse optical imaging instruments.
A: Parallel plate frequency-domain instrument from University of Pennsylvania; B: Ring-type frequency-domain system from Dartmouth; C: Hand-held scanning system from University of California at Irvine; D: Time-domain multispectral transmission type from ART, Canada.
Figure 3 Example of 3D diffuse optical imaging images.
A: Silicone phantom that mimics human breast; B: Actual human breast with a malignant tumor in the upper right region (from Lee et al[21]).
Figure 4 Example of diffuse optical imaging artifacts related to source positions.
The images are single slices of 3D diffuse optical imaging (DOI) reconstruction that is parallel and close to 9 × 5 source grid positions, (A) before and (B) after applying the spatially dependent regularization. The target is a breast mimicking phantom made of silicone.
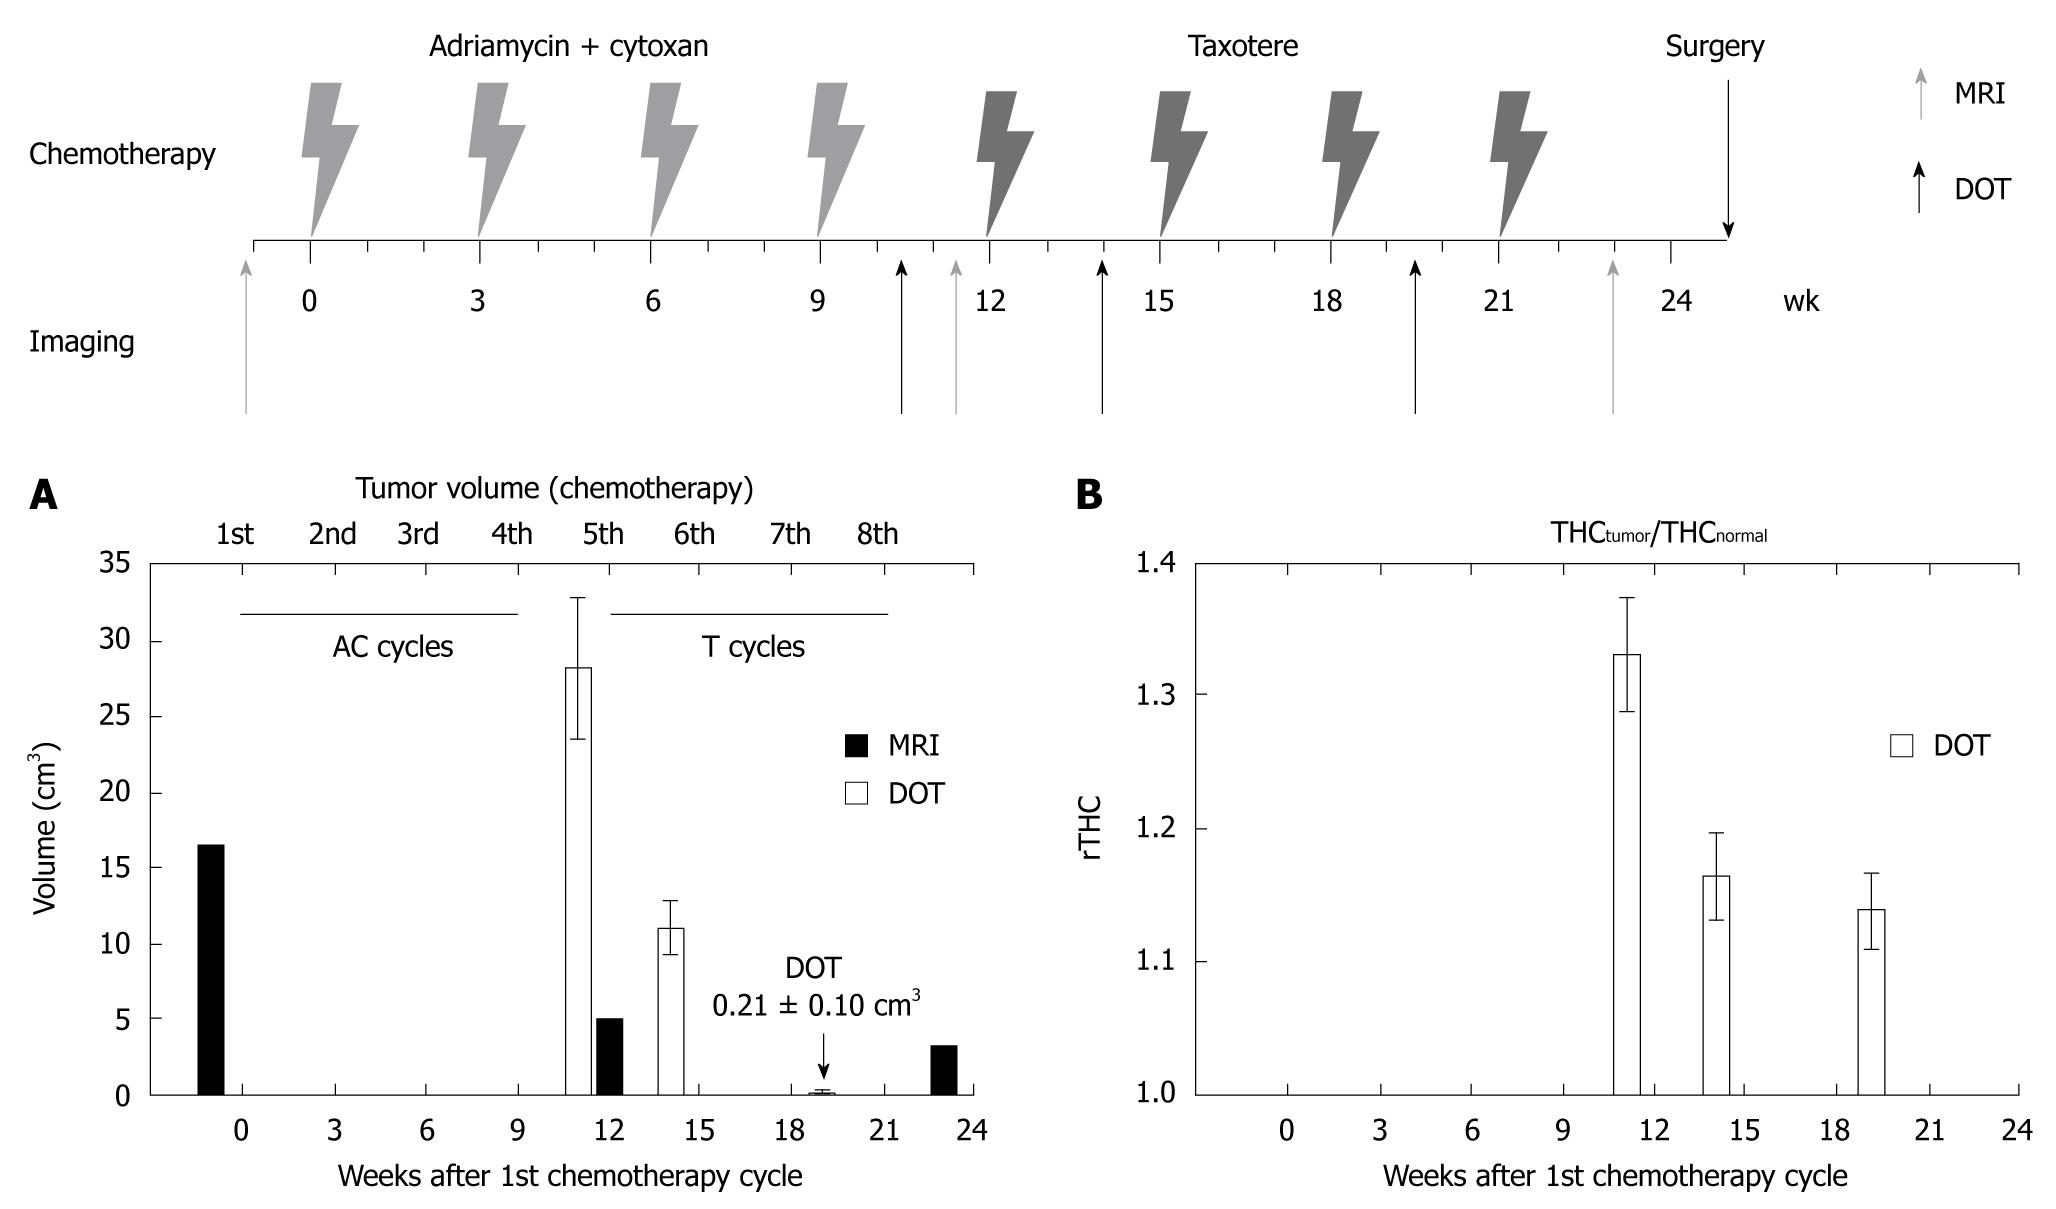
Figure 5 (Upper) Neoadjuvant chemotherapy timing diagram.
Four cycles of adriamycin + cytoxan are followed by four cycles of taxotere. Time points for magnetic resonance imaging (MRI) and diffuse optical tomography (DOT) measurement are indicated. (Lower) A: Decrease in tumor volume; B: Change in total hemoglobin concentration (THC) (from Choe et al[42], copyright, 2005, American Association of Physicists in Medicine).
Figure 6 Non-responders (A) vs responders (B) to neoadjuvant chemotherapy for each of the optical parameters as measured by diffuse optical imaging in breast tumors (from Soliman et al, copyright, 2010, American Association for Cancer Research).
SP: Scattering power.
- Citation: Lee K. Optical mammography: Diffuse optical imaging of breast cancer. World J Clin Oncol 2011; 2(1): 64-72
- URL: https://www.wjgnet.com/2218-4333/full/v2/i1/64.htm
- DOI: https://dx.doi.org/10.5306/wjco.v2.i1.64


