Copyright
©2011 Baishideng Publishing Group Co.
World J Clin Oncol. Jan 10, 2011; 2(1): 28-43
Published online Jan 10, 2011. doi: 10.5306/wjco.v2.i1.28
Published online Jan 10, 2011. doi: 10.5306/wjco.v2.i1.28
Figure 1 Axial contrast enhanced computed tomography image.
A: The primary lesion arising from a loop of the ileum, with extension along the mesenteric border. Typical central stipple calcification is evident; B: In the arterial phase showing multiple hypoenhancing bilobar lesions in a non-cirrhotic liver consistent with neuroendocrine tumor metastases; C: In the equilibrium phase showing the typical washout pattern of the lesions corresponding to that in (B).
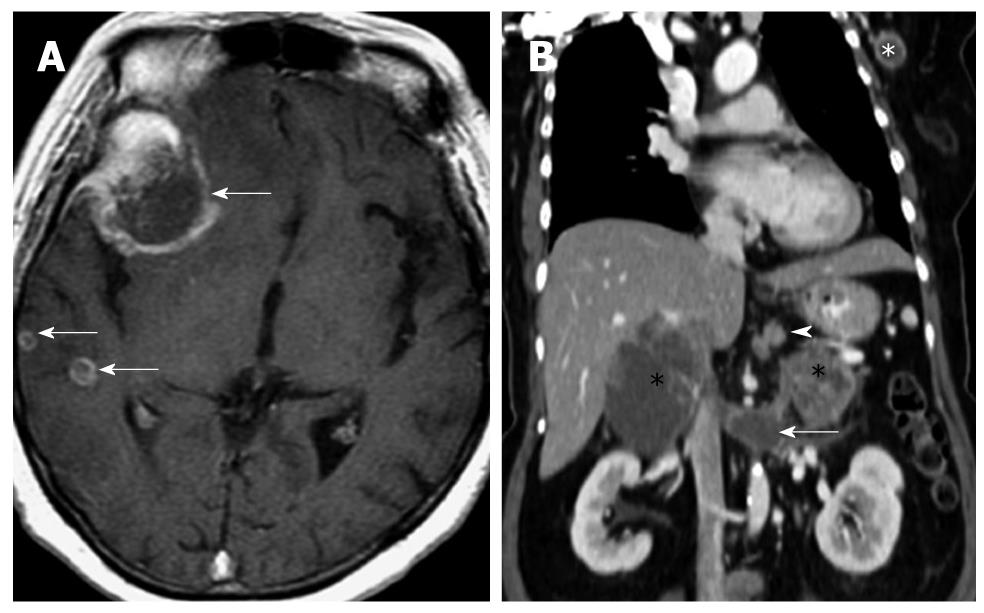
Figure 2 Computed tomography images of a patient with metastatic neuroendocrine carcinoma.
A: Axial T1 weighted fat-suppressed image of the brain in a patient with metastatic neuroendocrine carcinoma. Multiple ring enhancing lesions (arrows) are present in the right cerebral hemisphere, consistent with metastases. The dominant lesion in the right frontal lobe was hemorrhagic; B: Reconstructed contrast enhanced computed tomography image of the same patient in the coronal plane shows multiple sites of metastases: perigastric nodes (arrowhead), bilateral adrenal glands (black *), extension into the left renal vein (arrow) and a left axillary lymph node (white *). The primary lesion is believed to have originated from the stomach, which presented as an ulcerated mass on endoscopy (not shown).
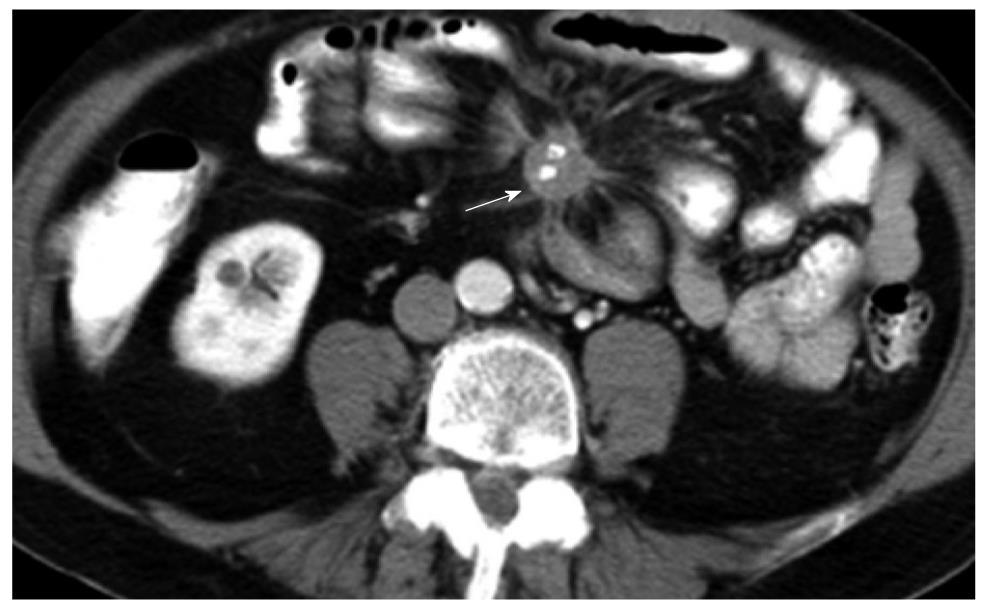
Figure 3 Axial computed tomography image of a patient following gastrointestinal and intravenous administration of iodinated contrast.
Spiculated mass with central stippled calcifications and tethering of the mesentery which is characteristic of neuroendocrine tumor. The primary lesion (not shown) is usually small and most commonly found in the ileum. Vascular occlusion is a known complication and may present with features of small bowel ischemia.
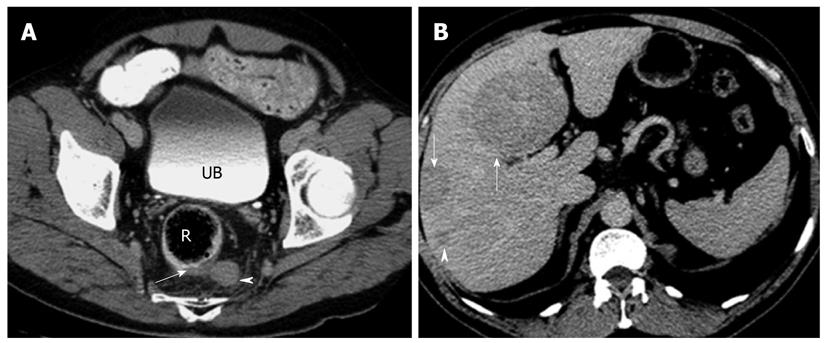
Figure 4 Axial computed tomography images of a patient with histologically proven metastatic neuroendocrine carcinoma.
A: Axial contrast enhanced computed tomography (CT) image of the rectum (R) showing focal eccentric thickening of the left posterolateral wall (arrow) with associated enlarged perirectal lymph node (arrowhead). Biopsy confirmed neuroendocrine carcinoma. Note the iodinated contrast in the urinary bladder (UB) indicating the delayed phase of imaging; B: Axial CT image of the same patient in the delayed phase showing multiple hypodense masses (arrows) and nodules (arrowhead) in the liver. These are consistent with metastatic disease. Note that the metastatic disease burden is considerable larger than the primary tumor itself, a not uncommon finding in neuroendocrine tumor.
Figure 5 Axial magnetic resonance imaging images of a patient with Zollinger Ellison’s syndrome.
A: Axial non-contrast T2 weighted image of a patient with known Zollinger Ellison’s syndrome secondary to a hyperfunctioning islet cell tumor (arrow) in the pancreatic tail. A T2 hyperintense nodule is present in the pancreatic tail. This corresponded to the site of increased tracer uptake on the octreotide scan (not shown). Note the relatively small size of the lesion, a finding that is typical for functioning islet cell tumors; B: Axial pre-contrast T1 weighted fat-suppressed image showing the lesion (arrow) to be hypointense. This contrasts well with the normal high signal of the pancreatic parenchyma; C: Axial post-contrast T1 weighted fat-suppressed image in the hepatic arterial phase showing avid enhancement within the lesion (arrow). This is the typical enhancement pattern of a neuroendocrine tumor.
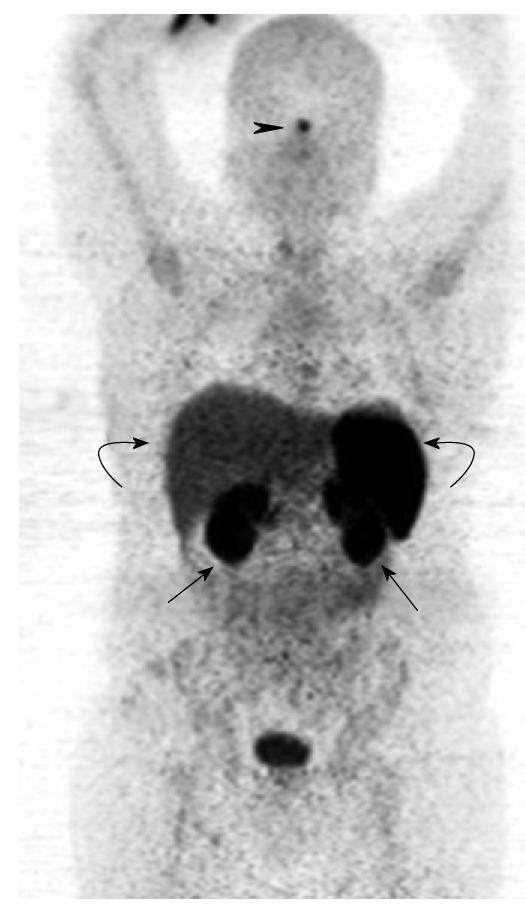
Figure 6 Gallium 68 DOTATATE positron emission tomography from the skull vertex to mid-thigh.
The coronal maximum intensity projection image demonstrates physiological areas of tracer uptake in the pituitary (black arrowhead), kidneys (black arrows), liver and spleen (curved arrows).
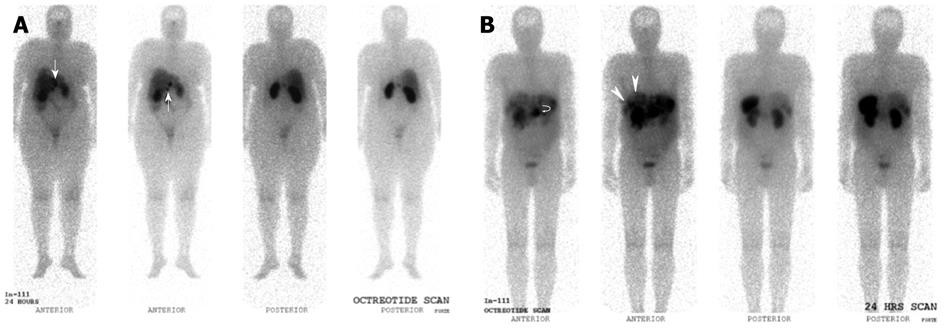
Figure 7 Indium 111 Octreotide Planar whole-body images.
A: Indium 111 Octreotide 24-h delayed anterior and posterior planar whole body images in a patient with prior resected pancreatic neuroendocrine carcinoma. Several abnormal tracer foci (white arrows) are seen in the peri-hepatic region, suspicious for somatostatin receptor expressing lesions. These were later confirmed as neuroendocrine nodal metastasis in the peri-hepatic and peri-gastric nodes; B: Indium 111 Octreotide 24-h delayed anterior and posterior planar whole body images in a patient with histologically confirmed neuroendocrine carcinoma of the pancreatic body. Increased tracer focus in the region of the pancreas (curved white arrow) corresponds to the primary pancreatic lesion, while multiple abnormal foci of uptake in the liver (white arrows) are in keeping with hepatic metastasis.
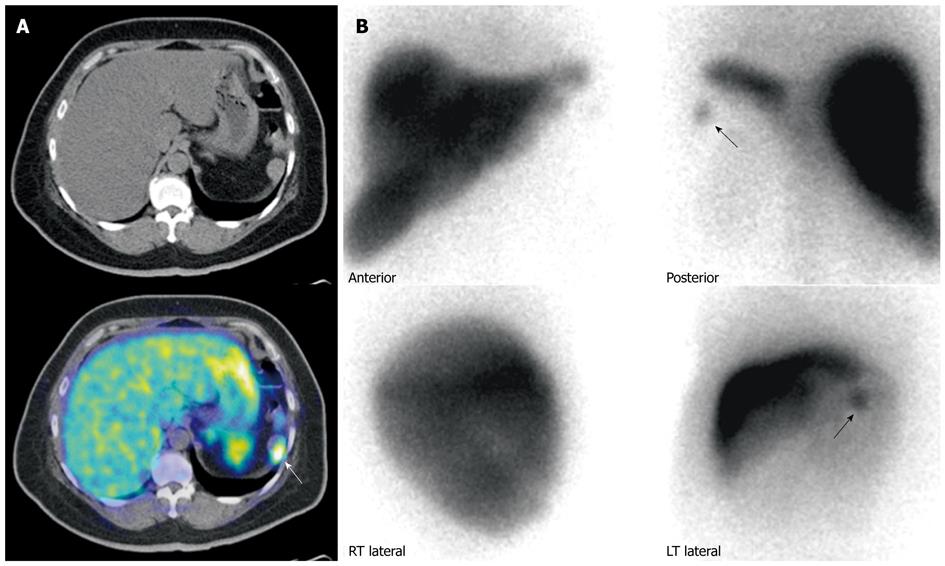
Figure 8 Patient with prior history of neuroendocrine carcinoma in the pancreatic tail, status post partial pancreatectomy and splenectomy.
A: Gallium 68 DOTATATE positron emission tomography/computed tomography (PET/CT). Axial CT and fused PET/CT images of the abdomen shows a mass in the left upper abdomen demonstrating significant DOTATATE tracer avidity (white arrow). Considerations included tumor recurrence or splenunculus; B: Technetium 99m Sulfur Colloid scintigraphy. Anterior and posterior planar spot views of the upper abdomen demonstrates a focus of uptake (black arrows) in the left upper abdomen, corresponding to the area of uptake seen on the previous Gallium 68 DOTATATE scan, confirming the mass to be a splenunculus.
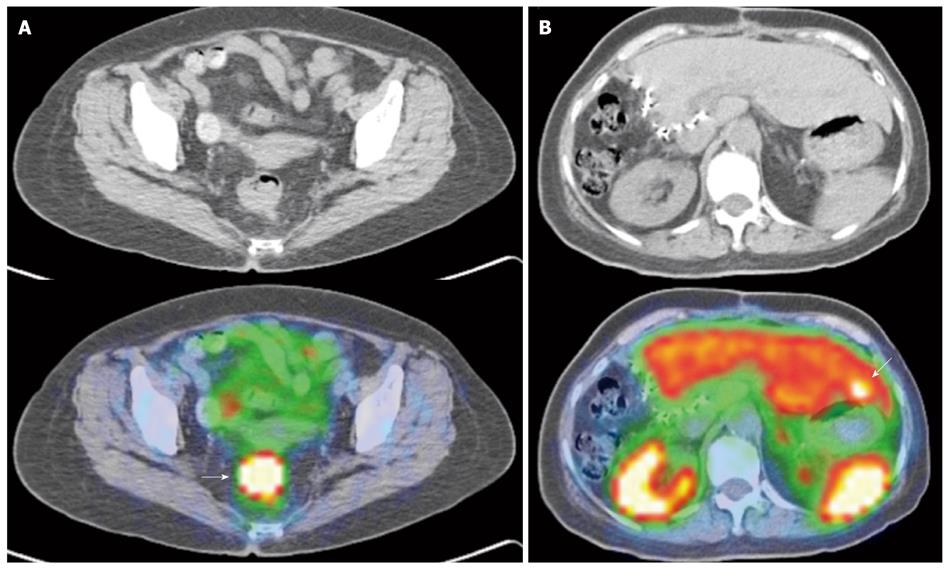
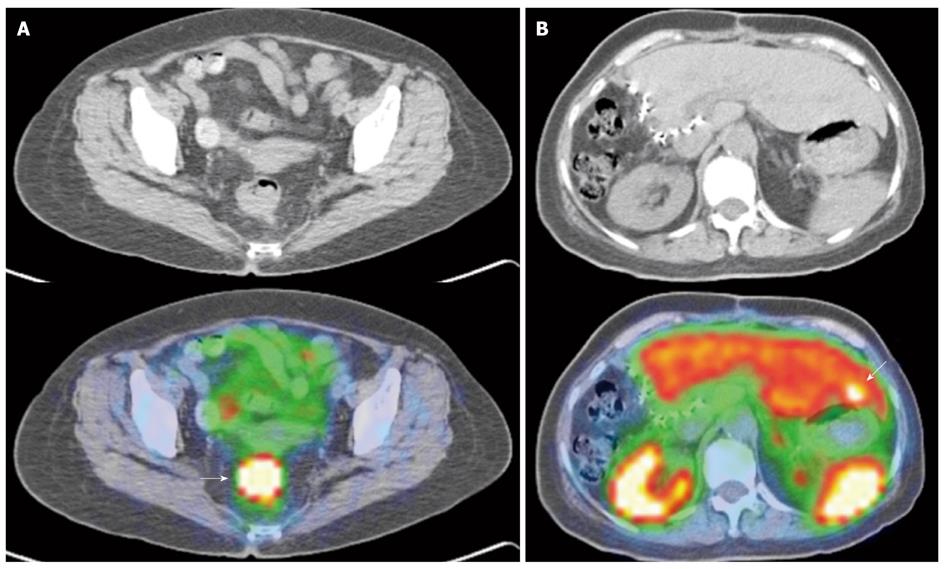
Figure 9 Gallium 68 DOTATATE positron emission tomography/computed tomography of a patient with right hepatic lobe neuroendocrine tumor metastasis, status post resection, but of unknown primary.
A: Axial computed tomography (CT) and fused positron emission tomography/CT (PET/CT) image of the pelvis shows an intensely DOTATATE tracer avid eccentric thickening of the rectum (white arrow), suspicious for a rectal primary. This was histologically confirmed as a neuroendocrine carcinoma; B: Axial CT and fused PET/CT image of the abdomen. Surgical clips are seen along the right liver margin, in keeping with previous surgery. There is an intensely tracer avid focus seen in segment 3 (white arrow). Although there were no obvious findings on the correlative non-contrast CT, this is suspicious for an additional liver metastasis. Note the normal physiological uptake in the kidneys, spleen and liver.
Figure 10 Gallium 68 DOTATATE positron emission tomography/computed tomography of a patient with histologically proven abdominal paraganglioma.
For pre-therapy staging. A: Axial computed tomography (CT) and fused positron emission tomography/CT (PET/CT) image of the abdomen demonstrates an intensely DOTATATE avid mass in the inter aorto-caval region (white arrow), correlating with the primary tumor; B: Axial CT and fused PET/CT image of the abdomen shows a peritoneal mass adjacent to the spleen that shows avid tracer uptake (white arrow). This is compatible with a peritoneal deposit.
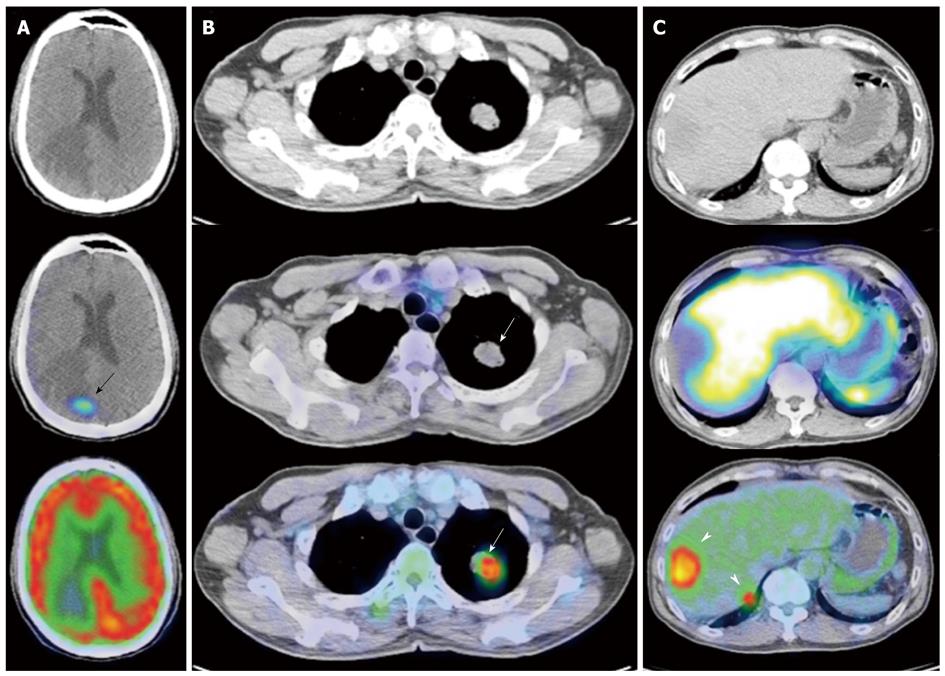
Figure 11 Gallium 68 DOTATATE and Fluorine 18 fluorodeoxyglucose positron emission tomography/computed tomography of a patient with metastatic neuroendocrine carcinoma.
A: Axial computed tomography (CT), fused DOTATATE positron emission tomography//CT (PET/CT) and fused fluorodeoxyglucose (FDG) PET/CT images of the brain. There is a focus of moderately increased DOTATATE uptake seen in the right occipital lobe (black arrow) associated with adjacent vasogenic edema, but no definite corresponding FDG uptake is seen; B: Axial CT, fused DOTATATE PET/CT and fused FDG PET/CT images of the thorax. There is an intensely FDG avid mass in the left upper lobe, but no corresponding DOTATATE tracer avidity is seen (white arrows), demonstrating an example of the “flip-flop” phenomenon secondary to tumor dedifferentiation; C: Axial CT, fused DOTATATE PET/CT and fused FDG PET/CT images of the abdomen. Again, there are intensely FDG avid lesions in the right liver lobe (white arrowheads) that do not demonstrate significant DOTATATE uptake, indicative of neuroendocrine tumor dedifferentiation.
- Citation: Tan EH, Tan CH. Imaging of gastroenteropancreatic neuroendocrine tumors. World J Clin Oncol 2011; 2(1): 28-43
- URL: https://www.wjgnet.com/2218-4333/full/v2/i1/28.htm
- DOI: https://dx.doi.org/10.5306/wjco.v2.i1.28


