Copyright
©The Author(s) 2025.
World J Clin Oncol. Aug 24, 2025; 16(8): 107306
Published online Aug 24, 2025. doi: 10.5306/wjco.v16.i8.107306
Published online Aug 24, 2025. doi: 10.5306/wjco.v16.i8.107306
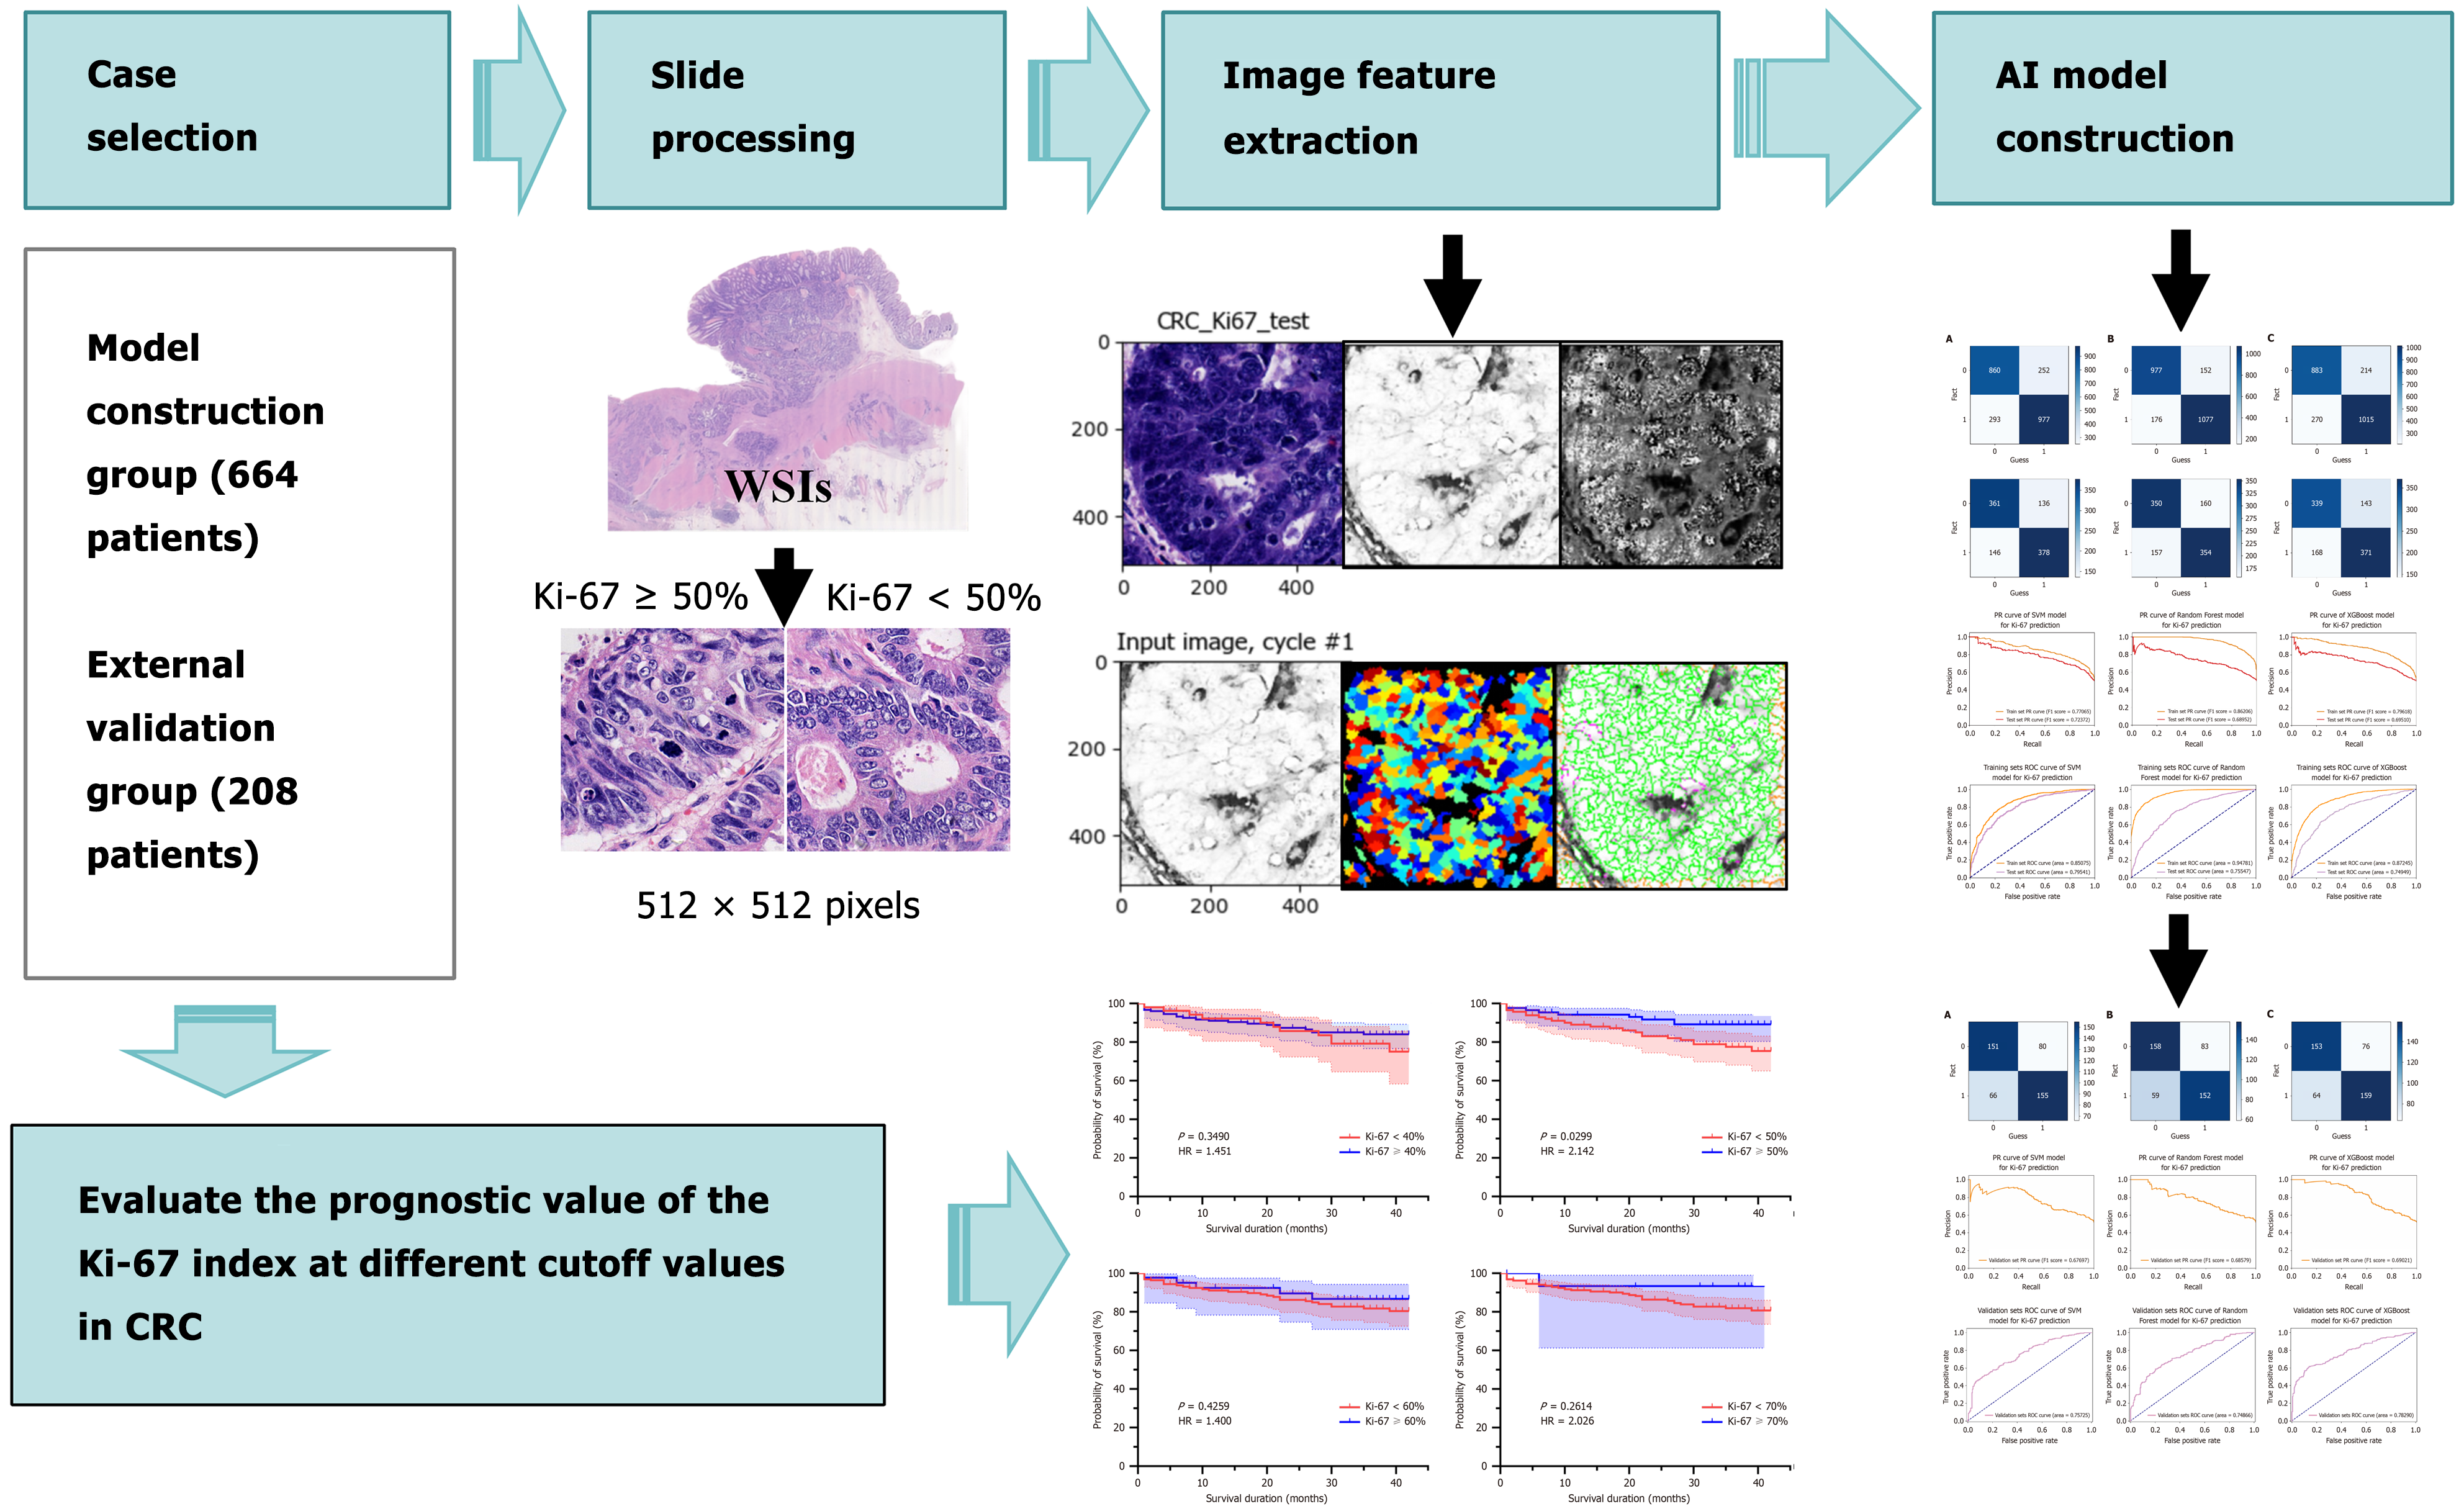
Figure 1 Technical workflow for colorectal carcinoma Ki-67 predictive classification integrating case cohort assembly, whole-slide imaging, deep feature engineering, and machine learning modeling.
CRC: Colorectal carcinoma; AI: Artificial intelligence; WSI: Whole-slide imaging.
Figure 2 Morpho-proliferative characterization of colorectal carcinoma specimens.
A: Ki-67 immunohistochemistry (IHC), Ki-67 proliferation indices (positive cells/total): 10%; B: Ki-67 IHC, Ki-67 proliferation indices (positive cells/total): 30%; C: Ki-67 IHC, Ki-67 proliferation indices (positive cells/total): 50%; D: Ki-67 IHC, Ki-67 proliferation indices (positive cells/total): 90%; E: Hematoxylin and eosin (HE) histology at 400 × microscopic resolution, Ki-67 proliferation indices (positive cells/total): 10%; F: HE histology at 400 × microscopic resolution, Ki-67 proliferation indices (positive cells/total): 30%; G: HE histology at 400 × microscopic resolution, Ki-67 proliferation indices (positive cells/total): 50%; H: HE histology at 400 × microscopic resolution, Ki-67 proliferation indices (positive cells/total): 90%.
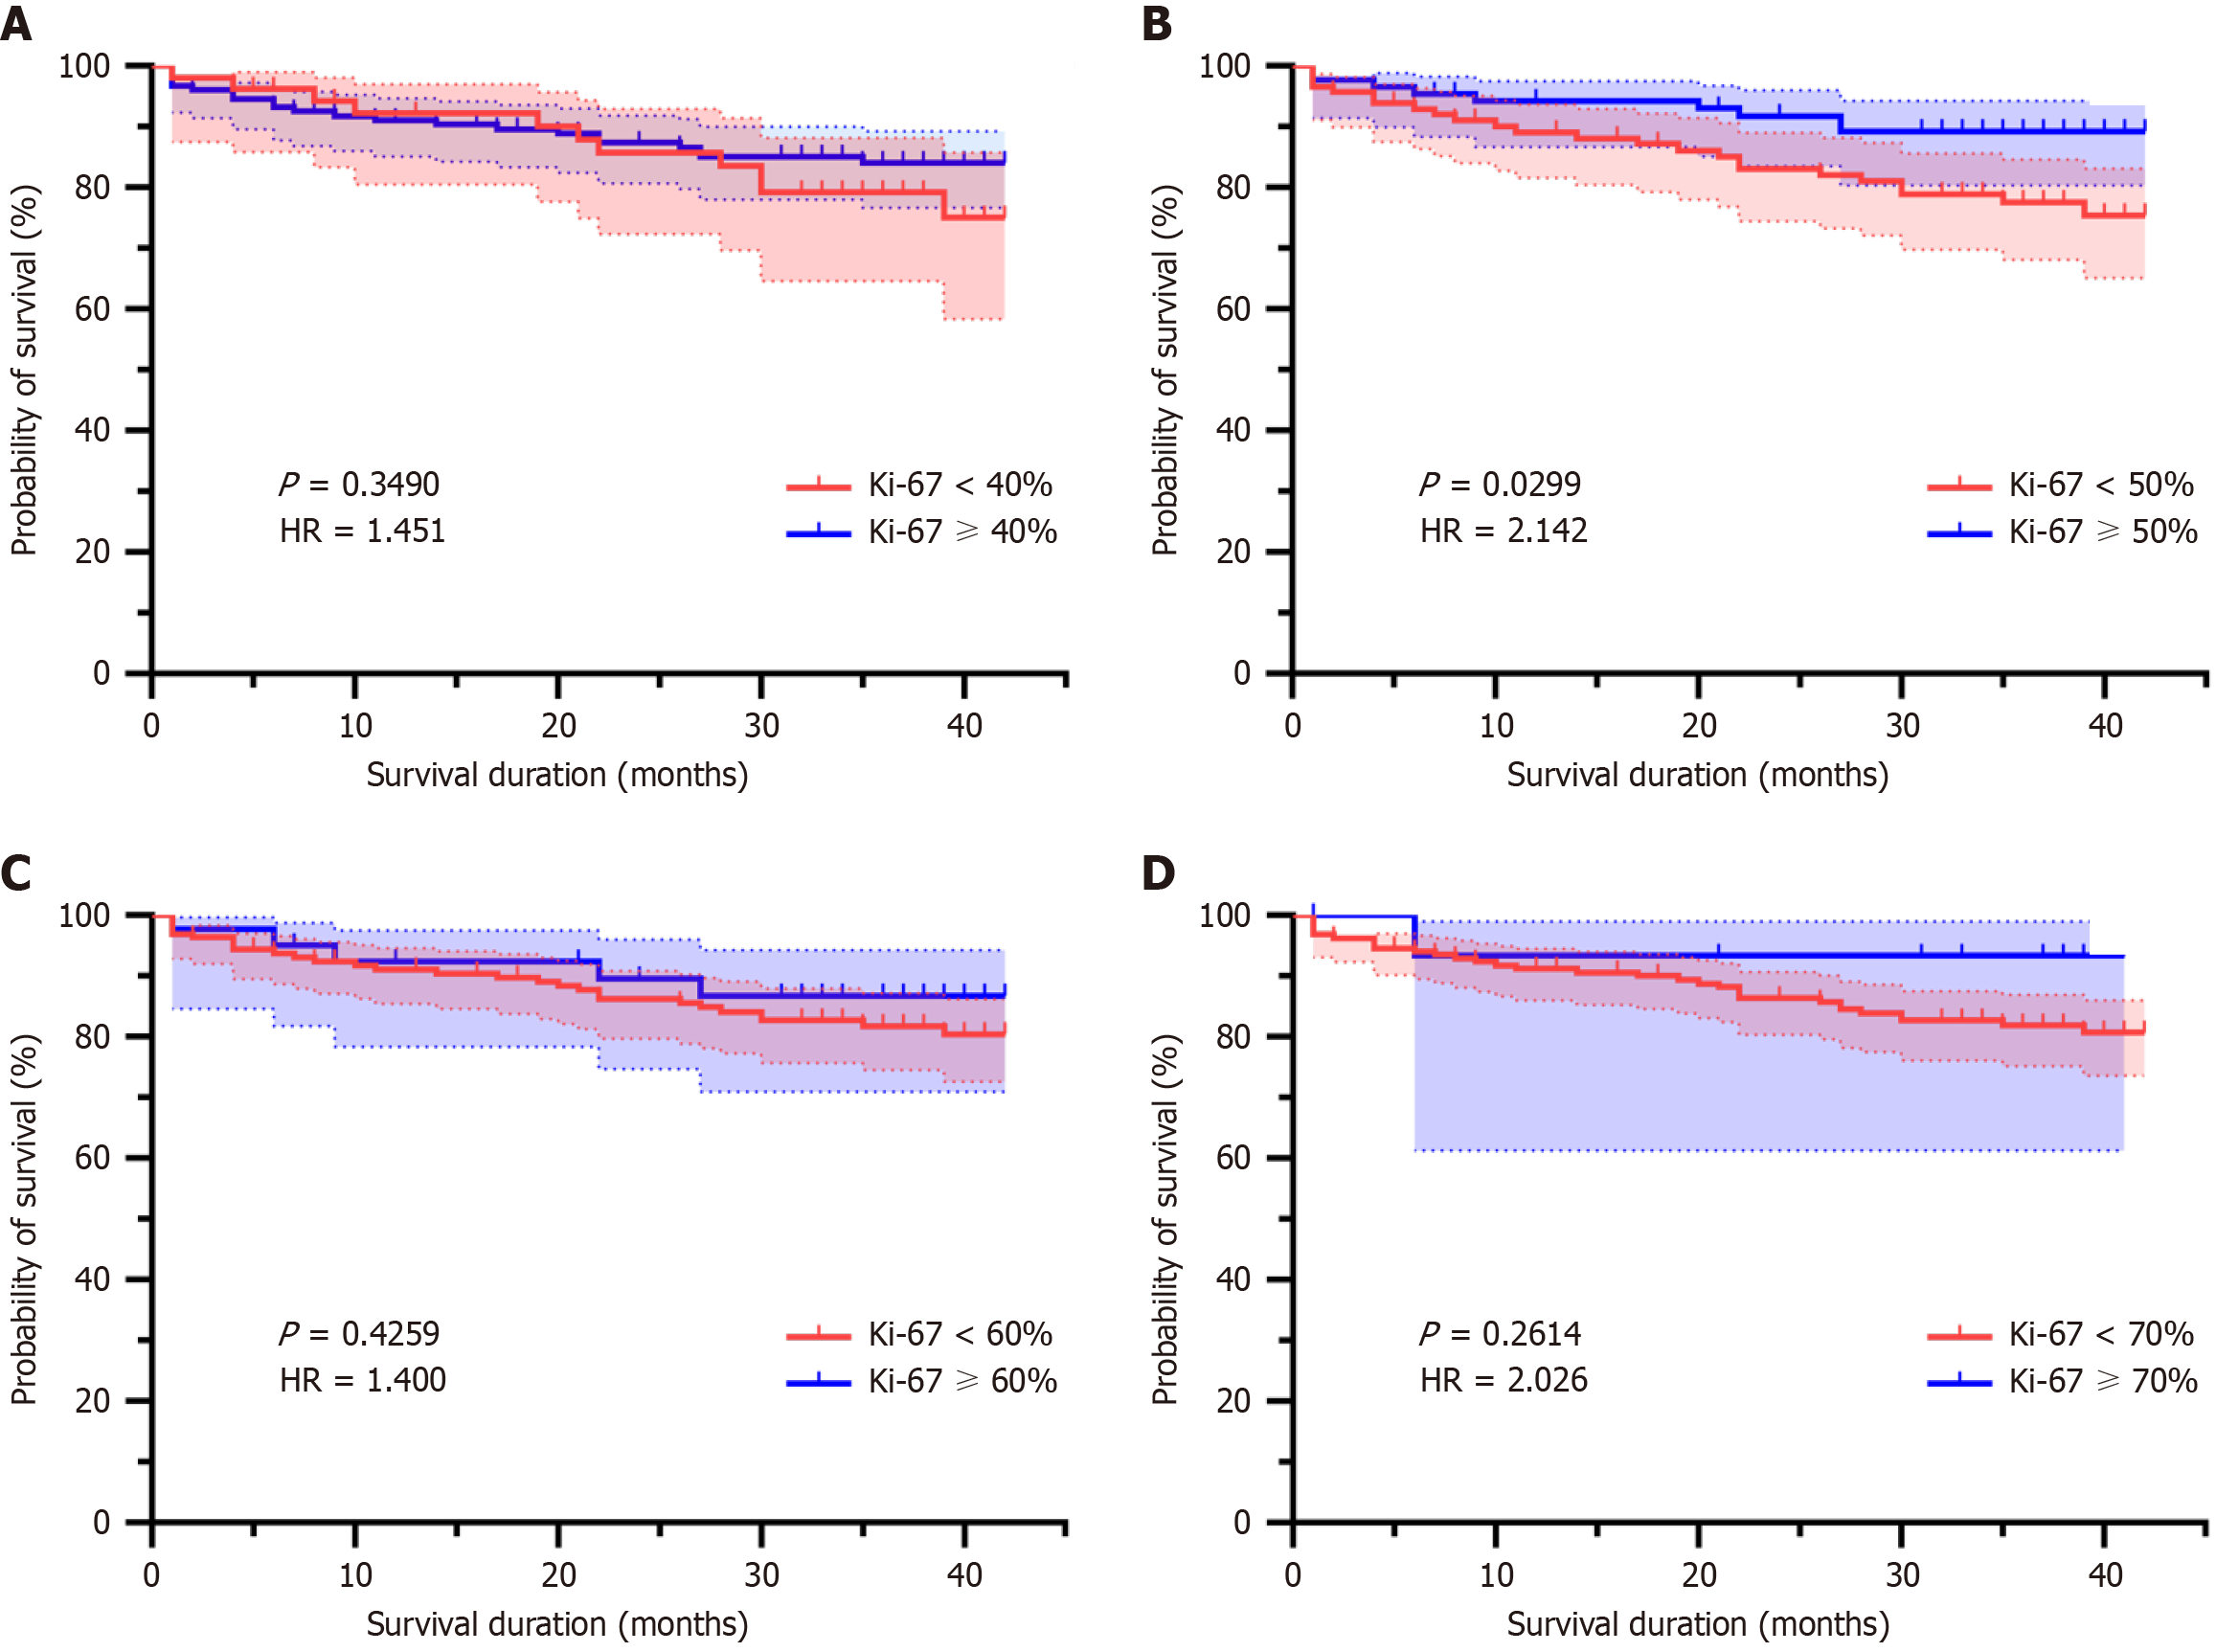
Figure 3 Kaplan-Meier survival curves for colorectal carcinoma patients stratified by Ki-67 40%, 50%, 60%, and 70%.
Data from the external validation dataset (208 colorectal carcinoma patients from the Yulin Red Cross Hospital). A: Ki-67 < 40% vs Ki-67 ≥ 40% Kaplan-Meier analysis with log-rank test: P = 0.3490, hazard ratio (HR) = 1.451; B: Ki-67 < 50% vs Ki-67 ≥ 50% Kaplan-Meier analysis with log-rank test: P = 0.0299, HR = 2.142; C: Ki-67 < 60% vs Ki-67 ≥ 60% Kaplan-Meier analysis with log-rank test: P = 0.4259, HR = 1.400; D: Ki-67 < 70% vs Ki-67 ≥ 70% Kaplan-Meier analysis with log-rank test: P = 0.2614, HR = 2.026. HR: Hazard ratio.
Figure 4 Comparative predictive performance of Ki-67 classification models.
A: Support vector machine with receiver operating characteristic (ROC) curves; B: Random forest with ROC curves; C: The eXtreme gradient boosting with ROC curves. ROC: Receiver operating characteristic; SVM: Support vector machine; XGBoost: eXtreme gradient boosting.
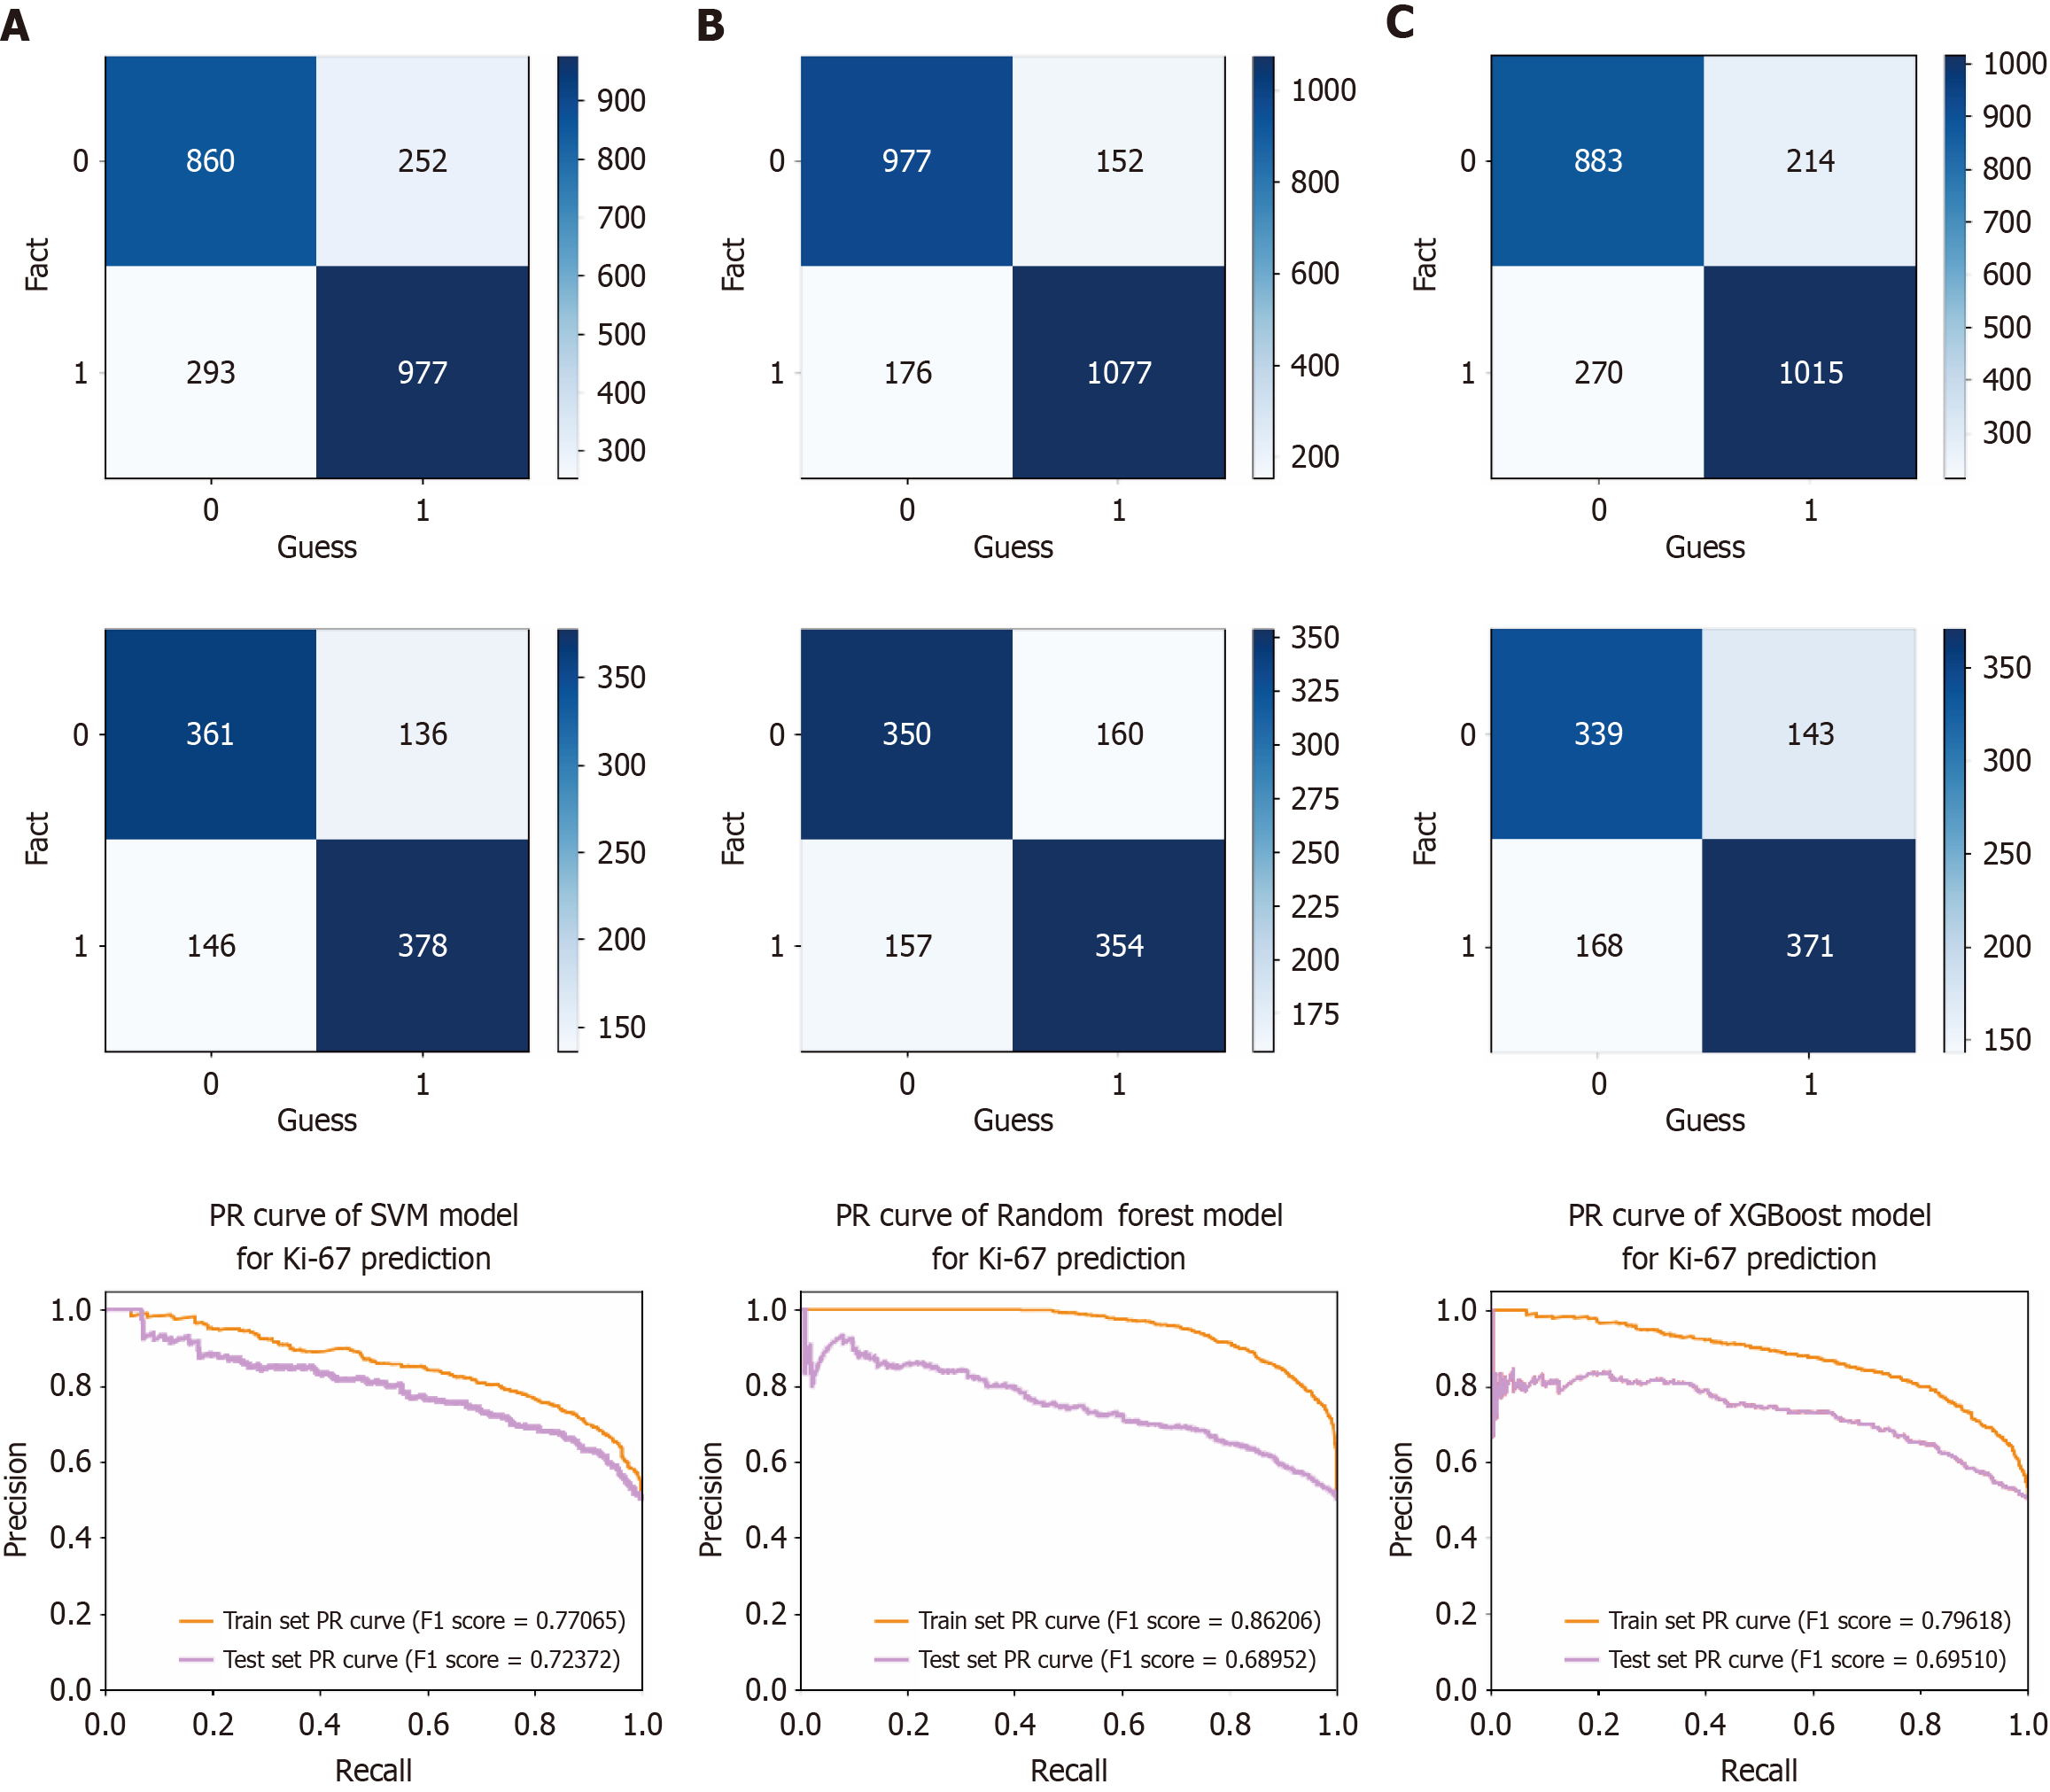
Figure 5 Confusion matrixes and precision-recall curves of Ki-67 classification models.
A: Support vector machine in the train set and test set; B: Random forest in the train set and test set; C: The eXtreme gradient boosting in the train set and test set. SVM: Support vector machine; XGBoost: eXtreme gradient boosting; PR: Precision recall.
Figure 6 Comparative receiver operating characteristic analysis of prediction models in the external validation set.
A: Support vector machine; B: Random forest; C: The eXtreme gradient boosting. ROC: Receiver operating characteristic; SVM: Support vector machine; XGBoost: eXtreme gradient boosting.
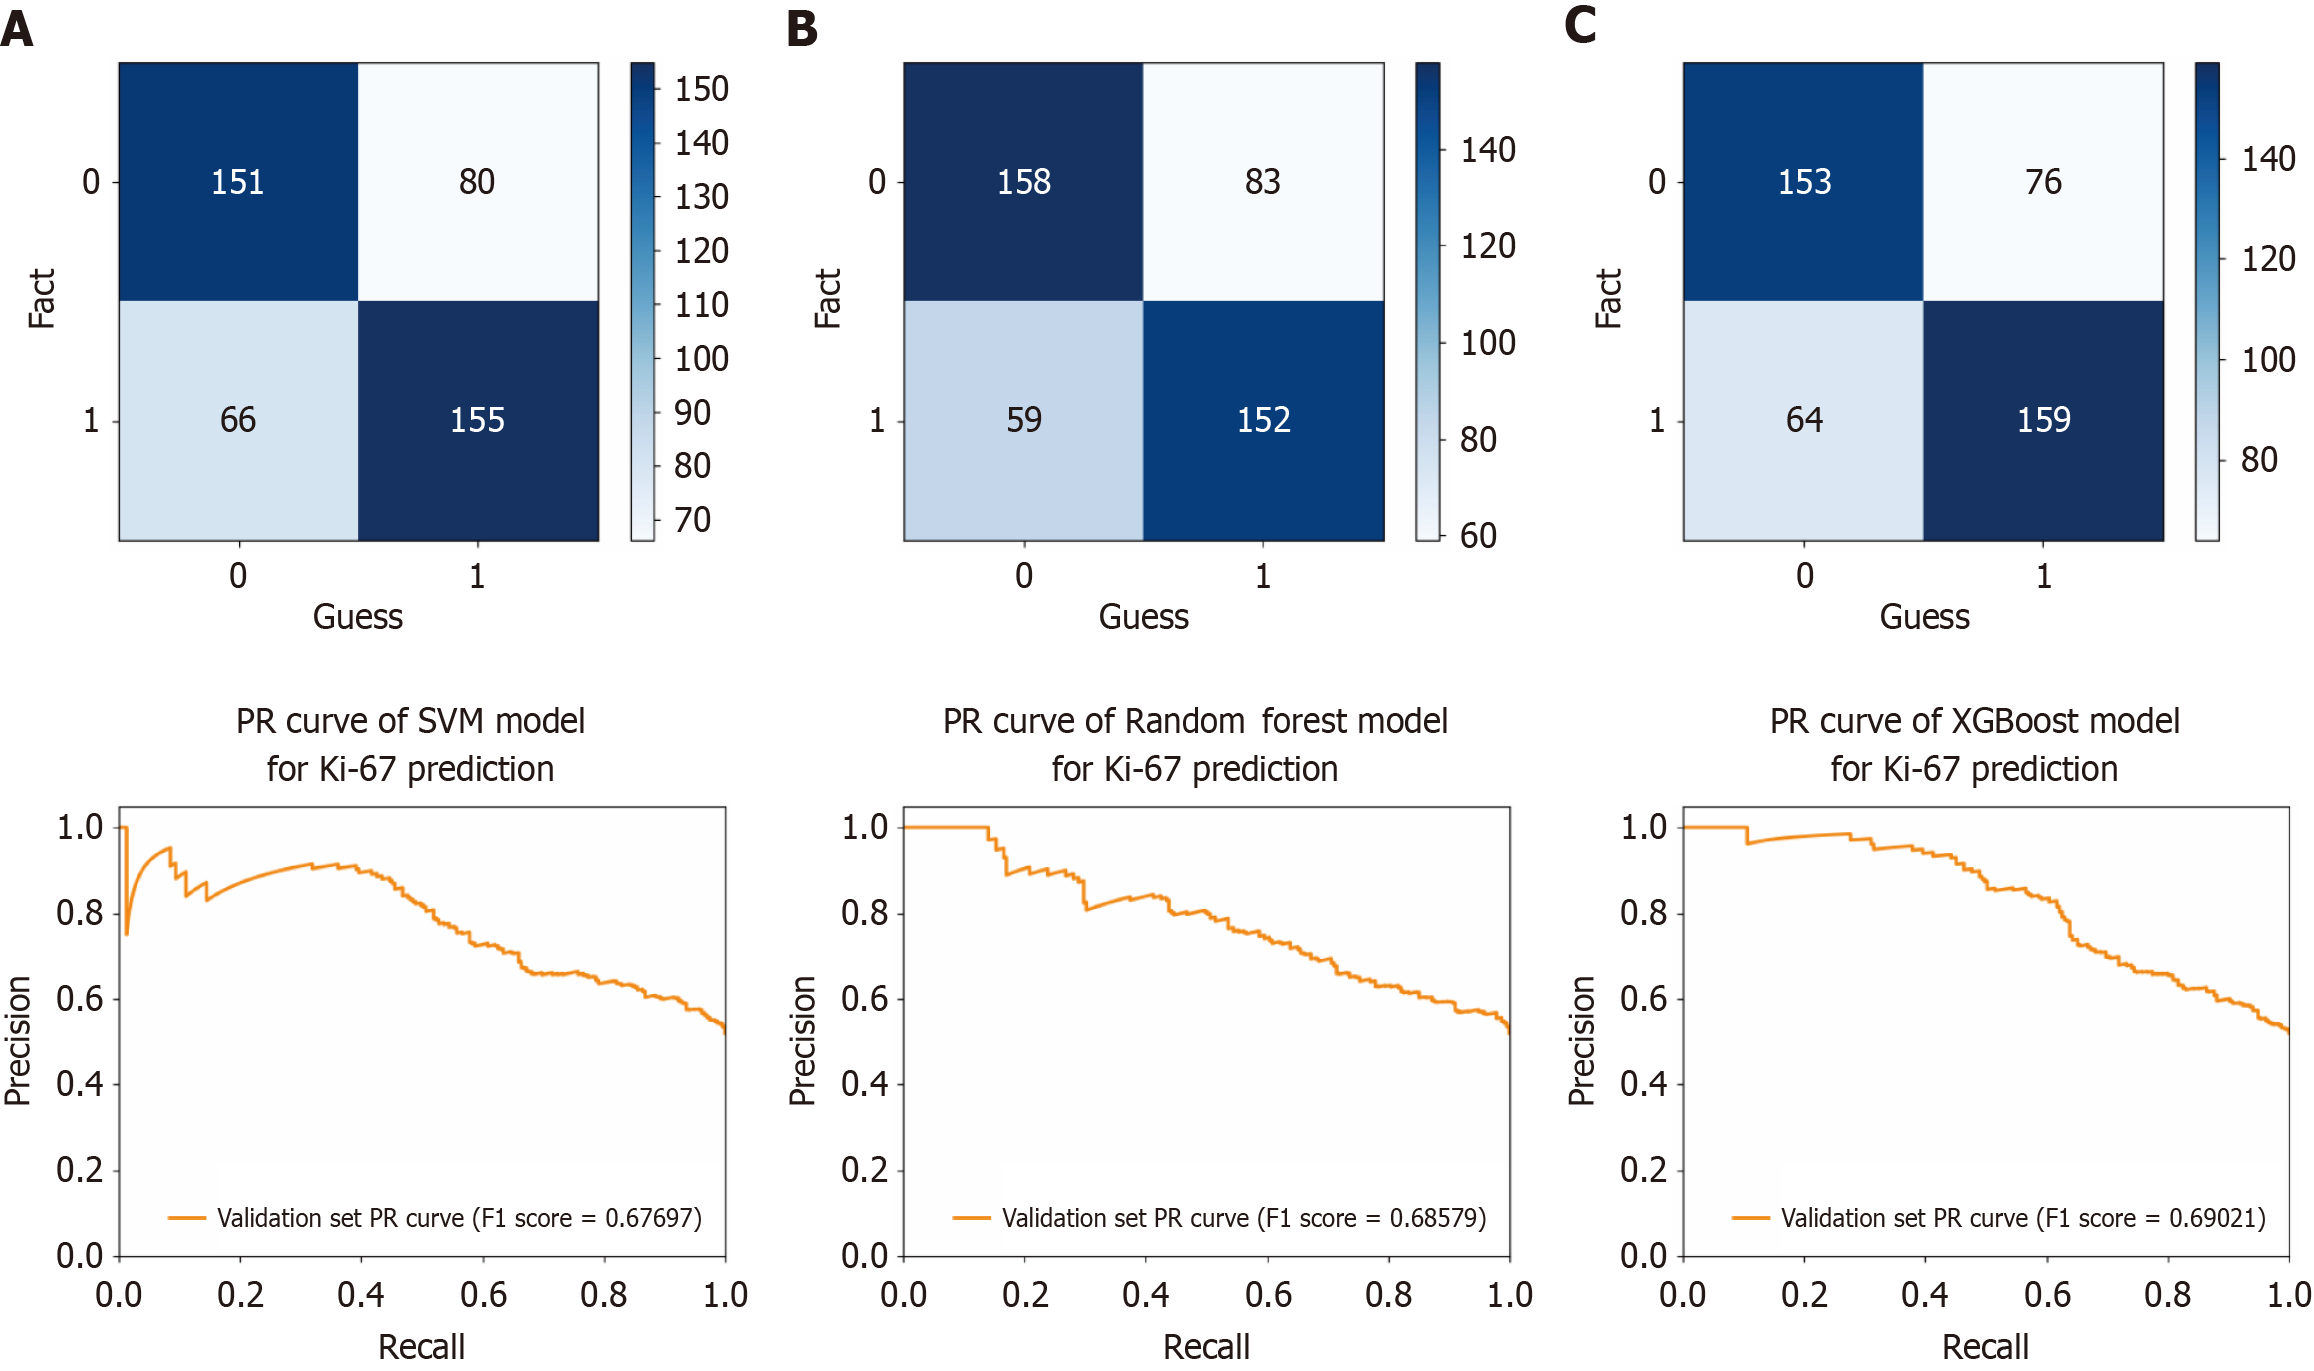
Figure 7 Confusion matrixes and precision-recall curves of Ki-67 classification models.
A: Support vector machine in the external validation set; B: Random forest in the external validation set; C: The eXtreme gradient boosting in the external validation set. SVM: Support vector machine; XGBoost: eXtreme gradient boosting.
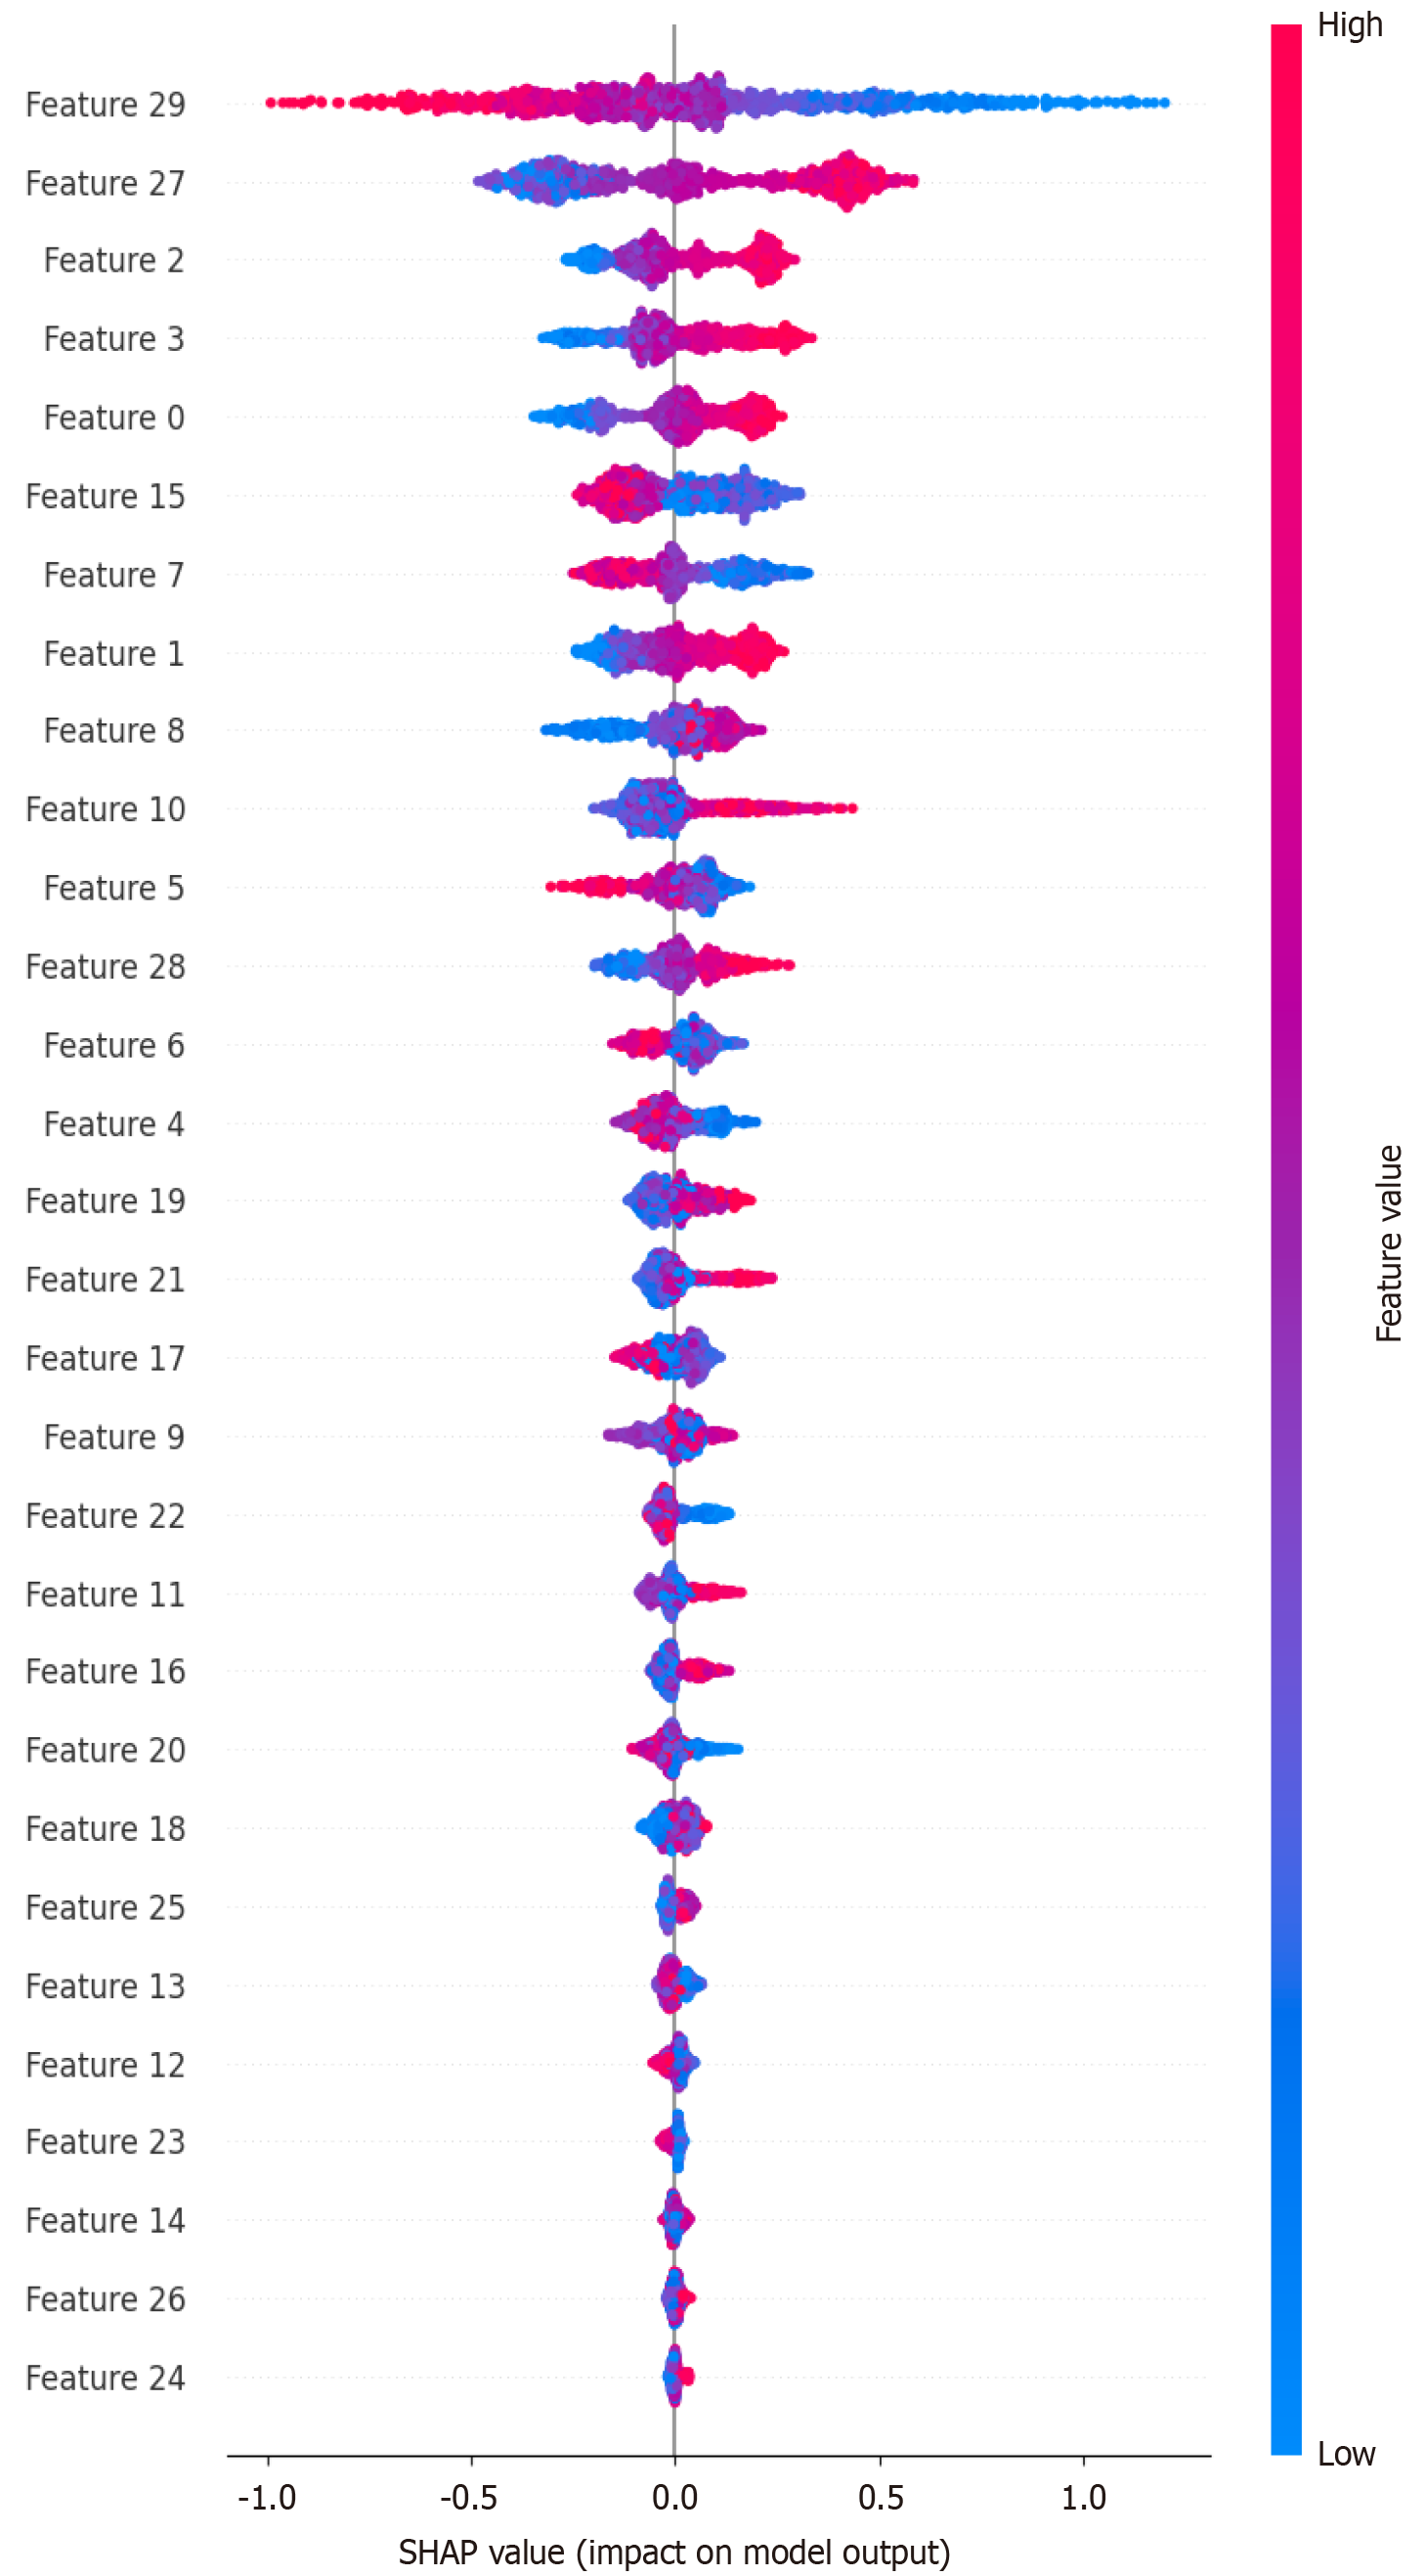
Figure 8 SHapley Additive exPlanation score of Ki-67 classification eXtreme gradient boosting models.
SHAP: SHapley Additive exPlanation.
- Citation: Zeng DT, Li MJ, Lin R, Huang WJ, Li SD, Huang WY, Li B, Li Q, Chen G, Jiang JS. Prognostic role of Ki-67 in colorectal carcinoma: Development and evaluation of machine learning prediction models. World J Clin Oncol 2025; 16(8): 107306
- URL: https://www.wjgnet.com/2218-4333/full/v16/i8/107306.htm
- DOI: https://dx.doi.org/10.5306/wjco.v16.i8.107306


