Copyright
©The Author(s) 2025.
World J Clin Oncol. May 24, 2025; 16(5): 107551
Published online May 24, 2025. doi: 10.5306/wjco.v16.i5.107551
Published online May 24, 2025. doi: 10.5306/wjco.v16.i5.107551
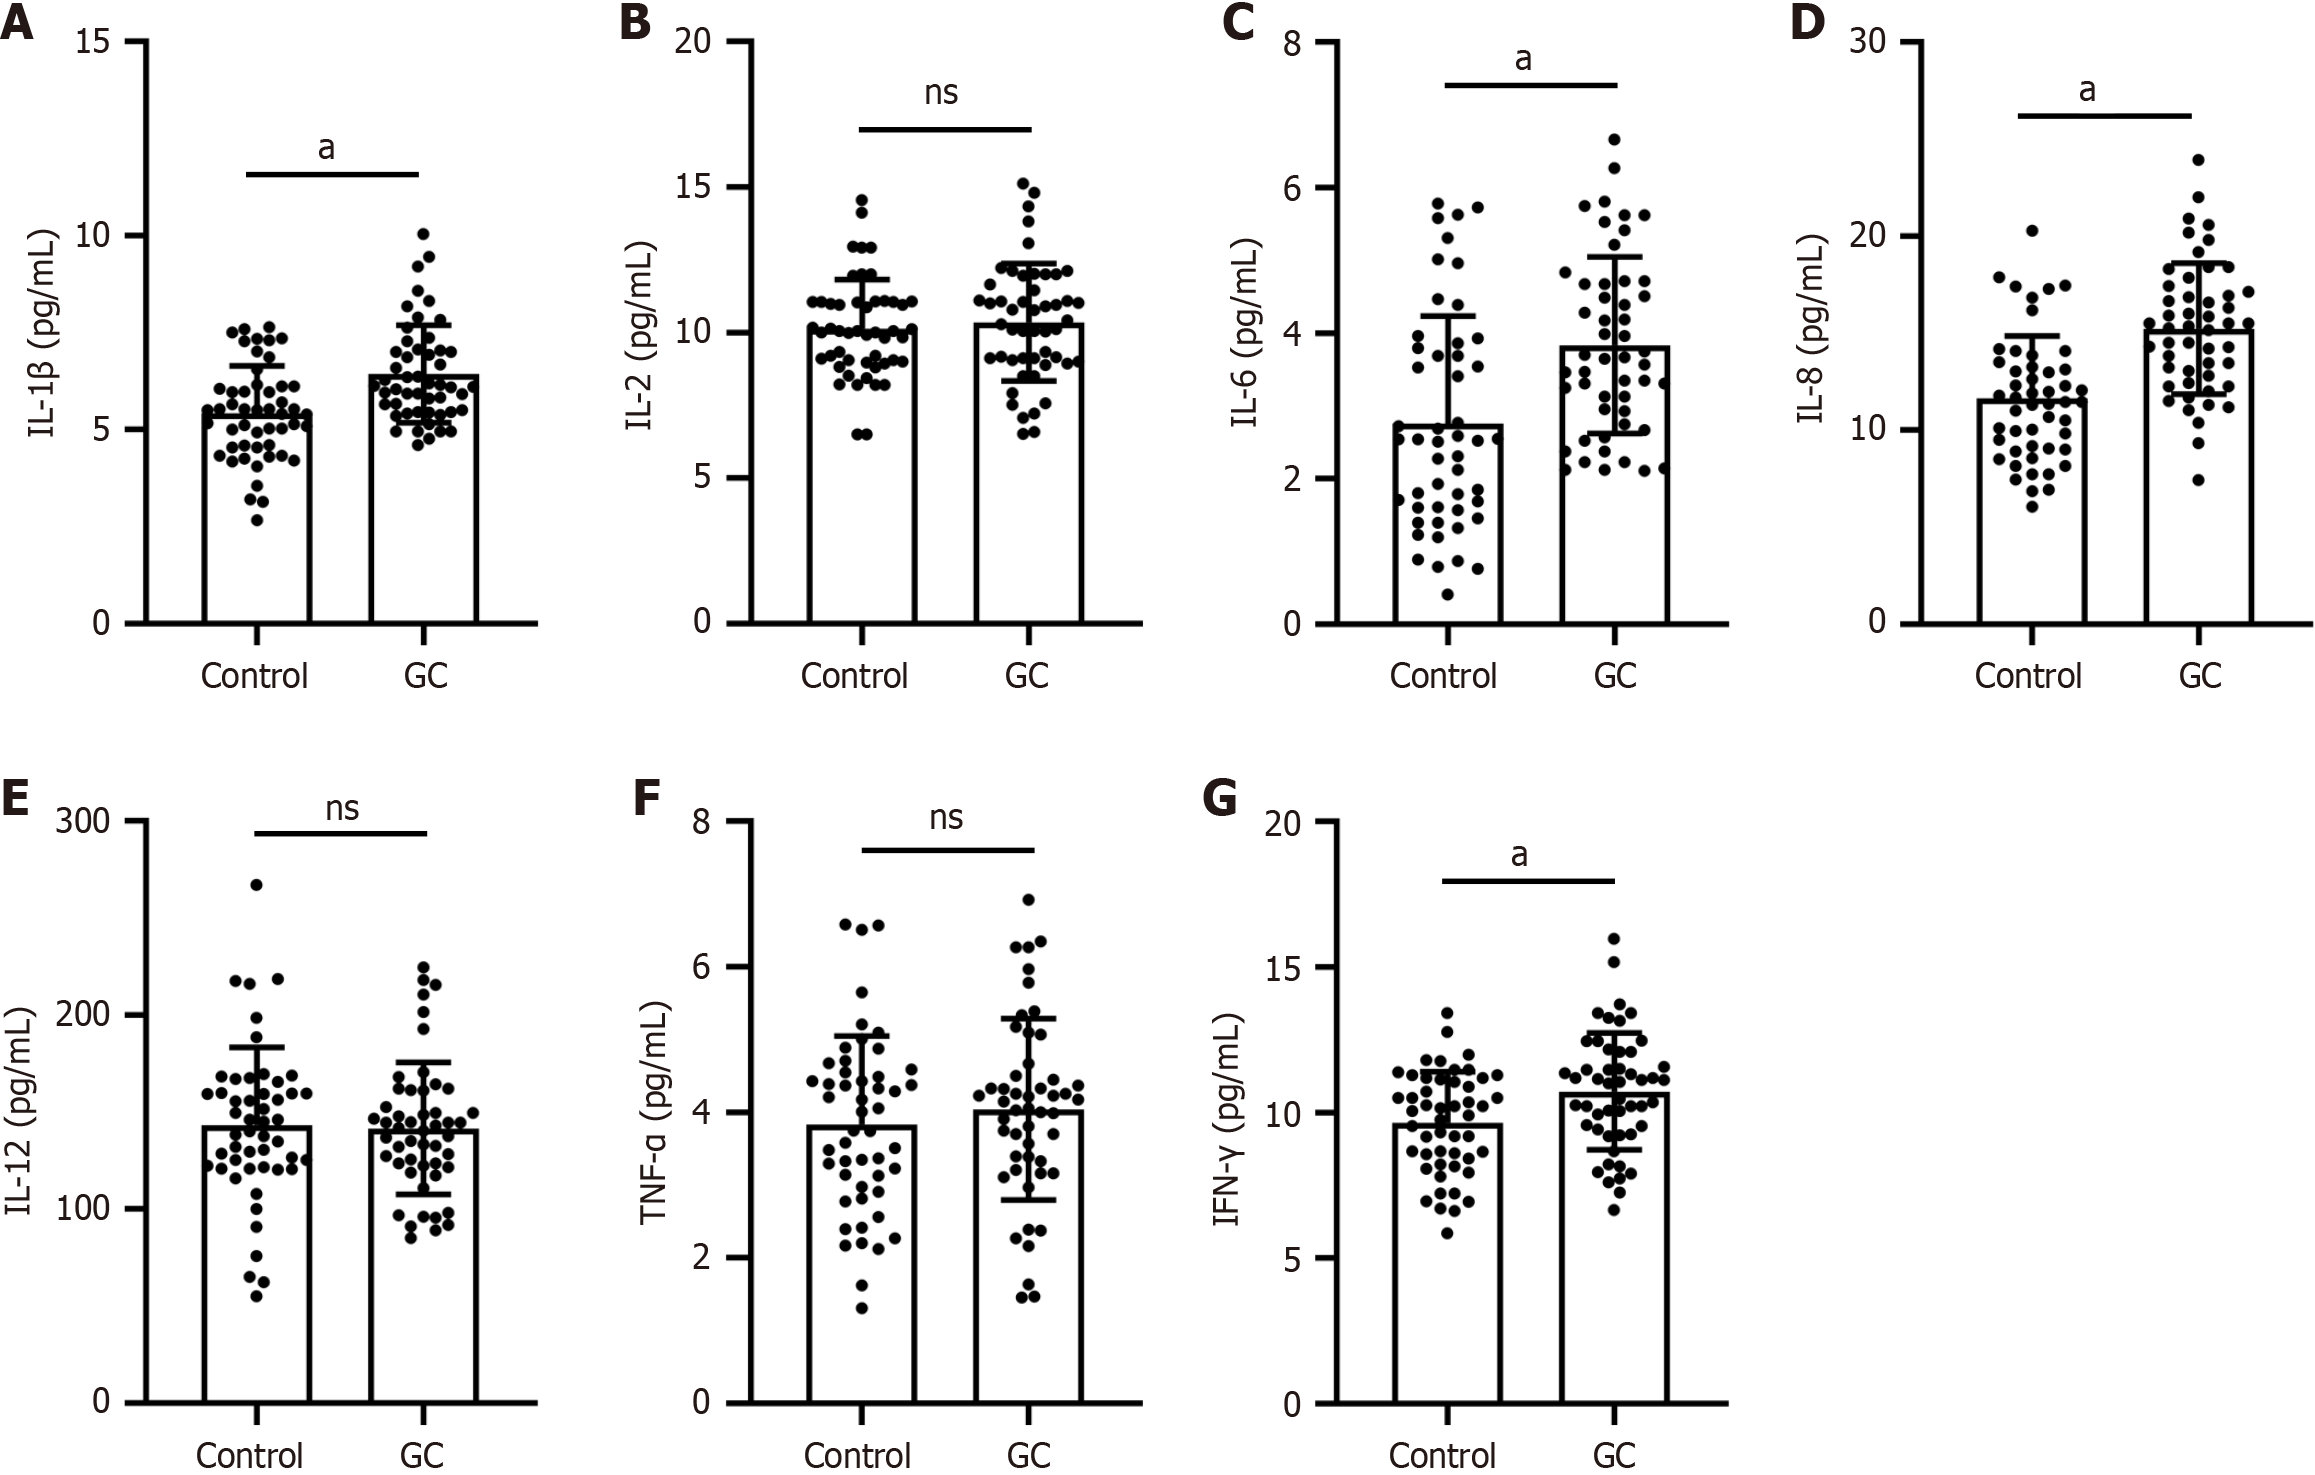
Figure 1 Comparison of serum pro-inflammatory cytokines between control group and gastric carcinoma group.
A: Comparison of interleukin (IL)-1β; B: Comparison of IL-2; C: Comparison of IL-6; D: Comparison of IL-8; E: Comparison of IL-12; F: Comparison of tumor necrosis factor-alpha; G: Comparison of interferon-γ. The data are presented as the mean ± SD. aP < 0.01 vs the control group, ns: No significance. GC: Gastric carcinoma.
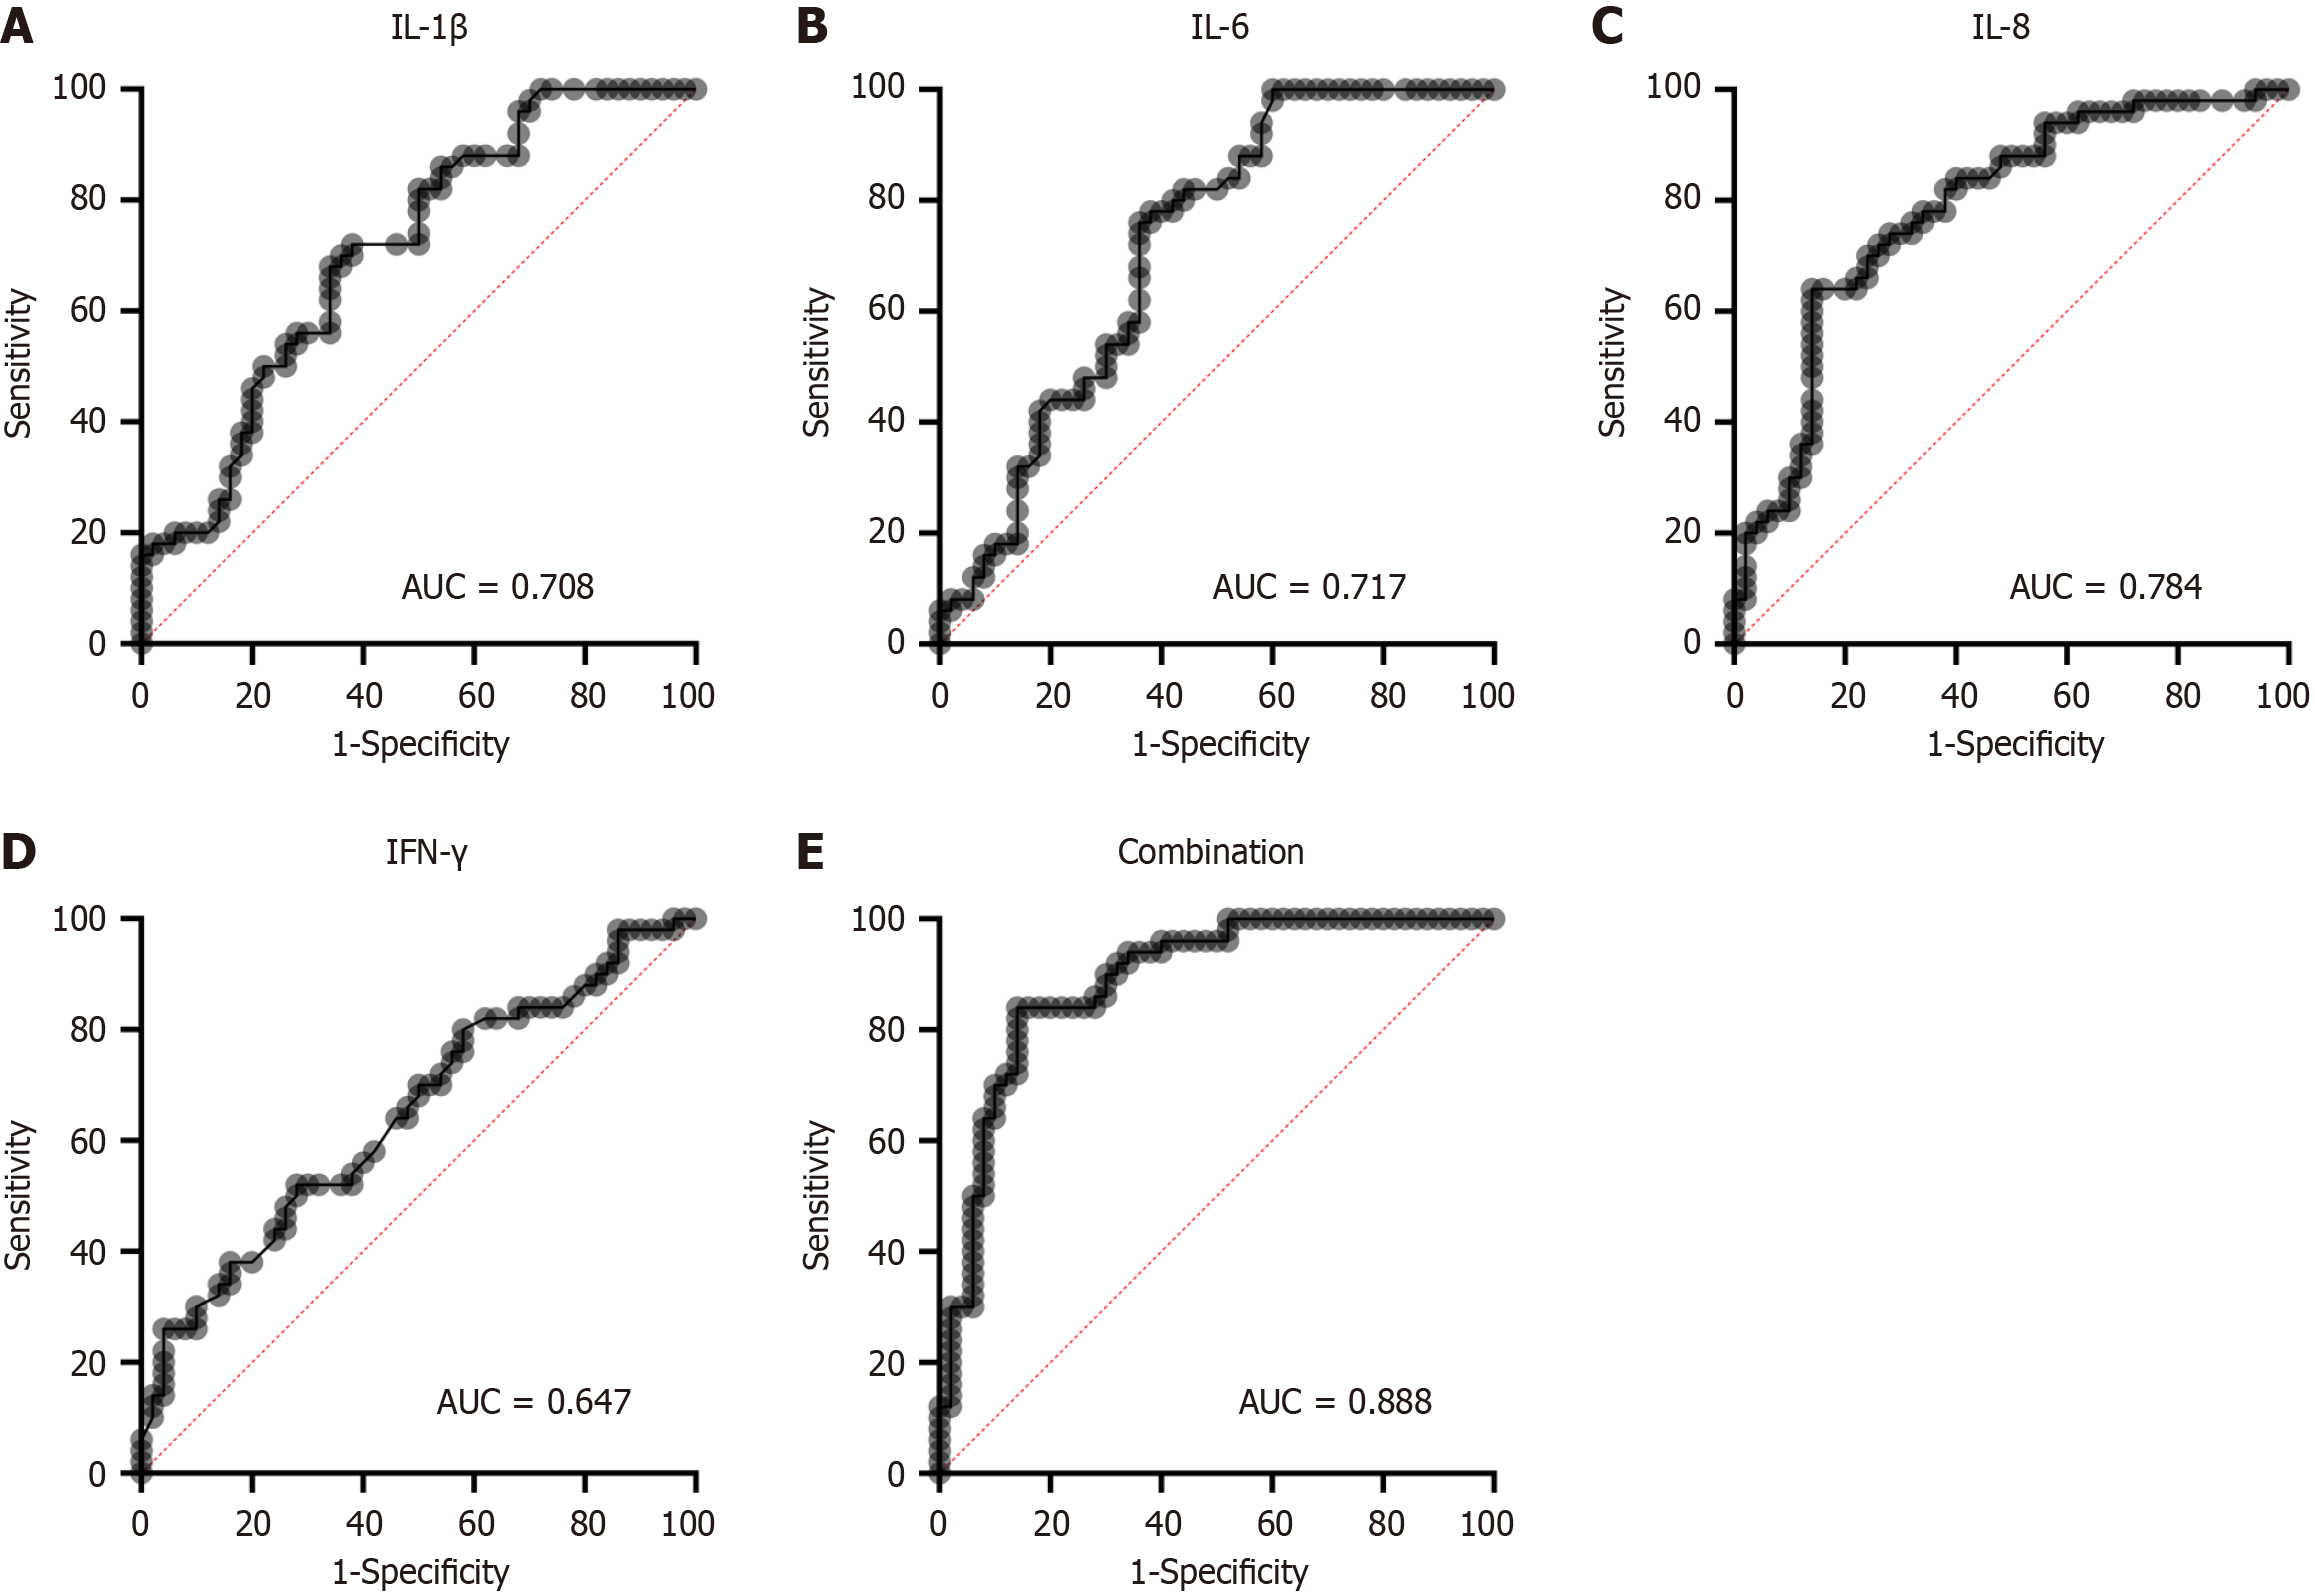
Figure 2 receiver operating characteristic curves of differential pro-inflammatory cytokines in identification of patients with gastric carcinoma from healthy volunteers.
A: Receiver operating characteristic (ROC) curve of interleukin (IL)-1β; B: ROC curve of IL-6; C: ROC curve of IL-8; D: ROC curve of interferon-γ (IFN-γ); E: ROC curve of a combined panel of IL-1β, IL-6, IL-8, and IFN-γ. IL: Interleukin; AUC: Area under the curve; IFN-γ: Interferon-γ.
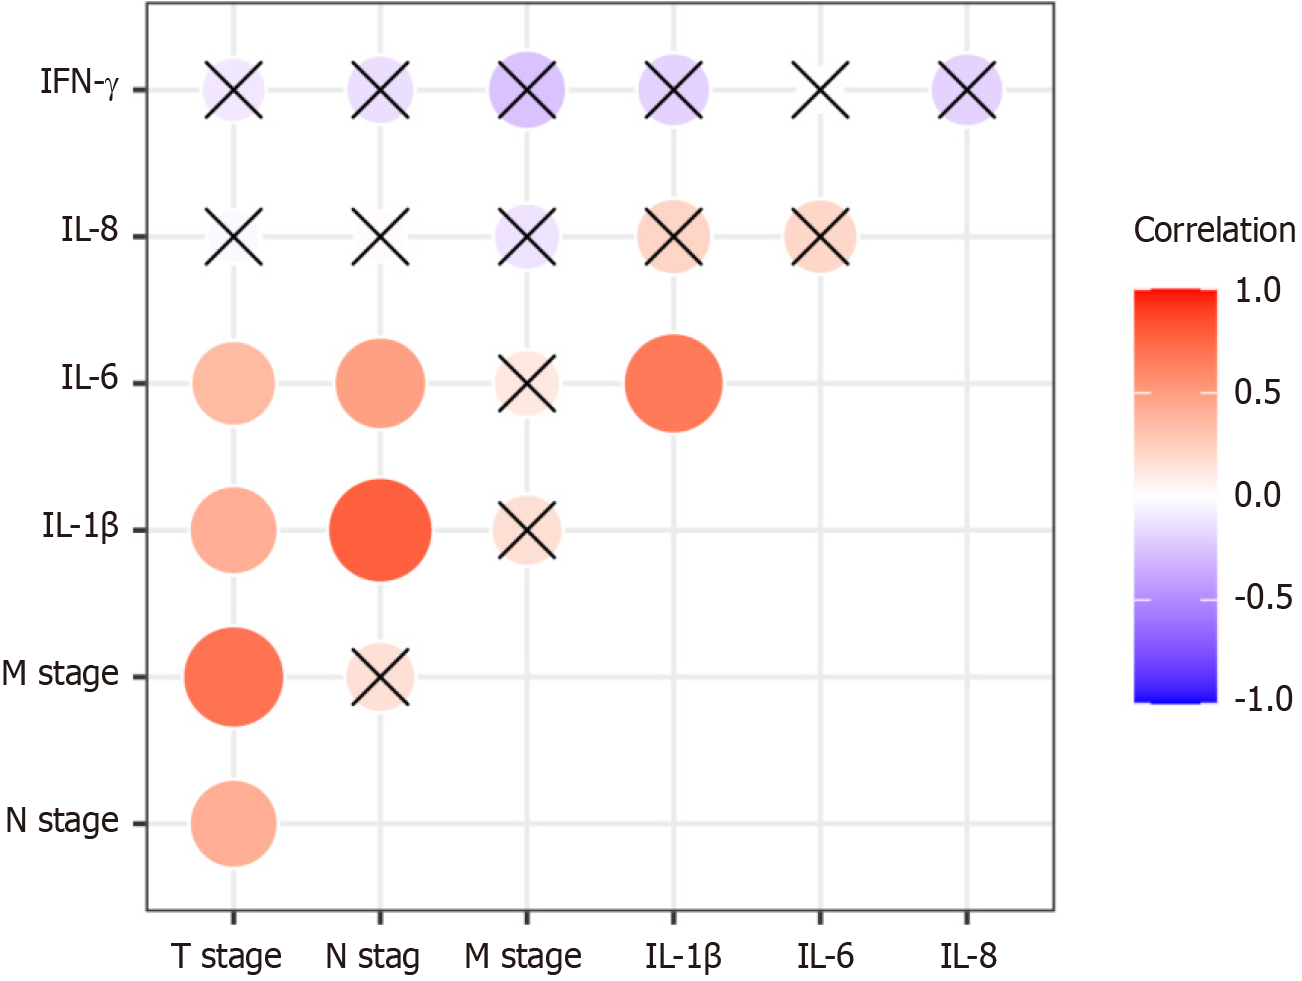
Figure 3 Correlation between the serum levels of differential pro-inflammatory cytokines and the disease severity in patients with gastric carcinoma.
×: No significance; IL: Interleukin; IFN-γ: Interferon-γ.
- Citation: Ren L, Liu J, Xu YY, Shi ZW. Serum pro-inflammatory cytokines as potential biomarkers for the diagnosis of gastric carcinoma. World J Clin Oncol 2025; 16(5): 107551
- URL: https://www.wjgnet.com/2218-4333/full/v16/i5/107551.htm
- DOI: https://dx.doi.org/10.5306/wjco.v16.i5.107551


