Copyright
©The Author(s) 2025.
World J Clin Oncol. Apr 24, 2025; 16(4): 102735
Published online Apr 24, 2025. doi: 10.5306/wjco.v16.i4.102735
Published online Apr 24, 2025. doi: 10.5306/wjco.v16.i4.102735
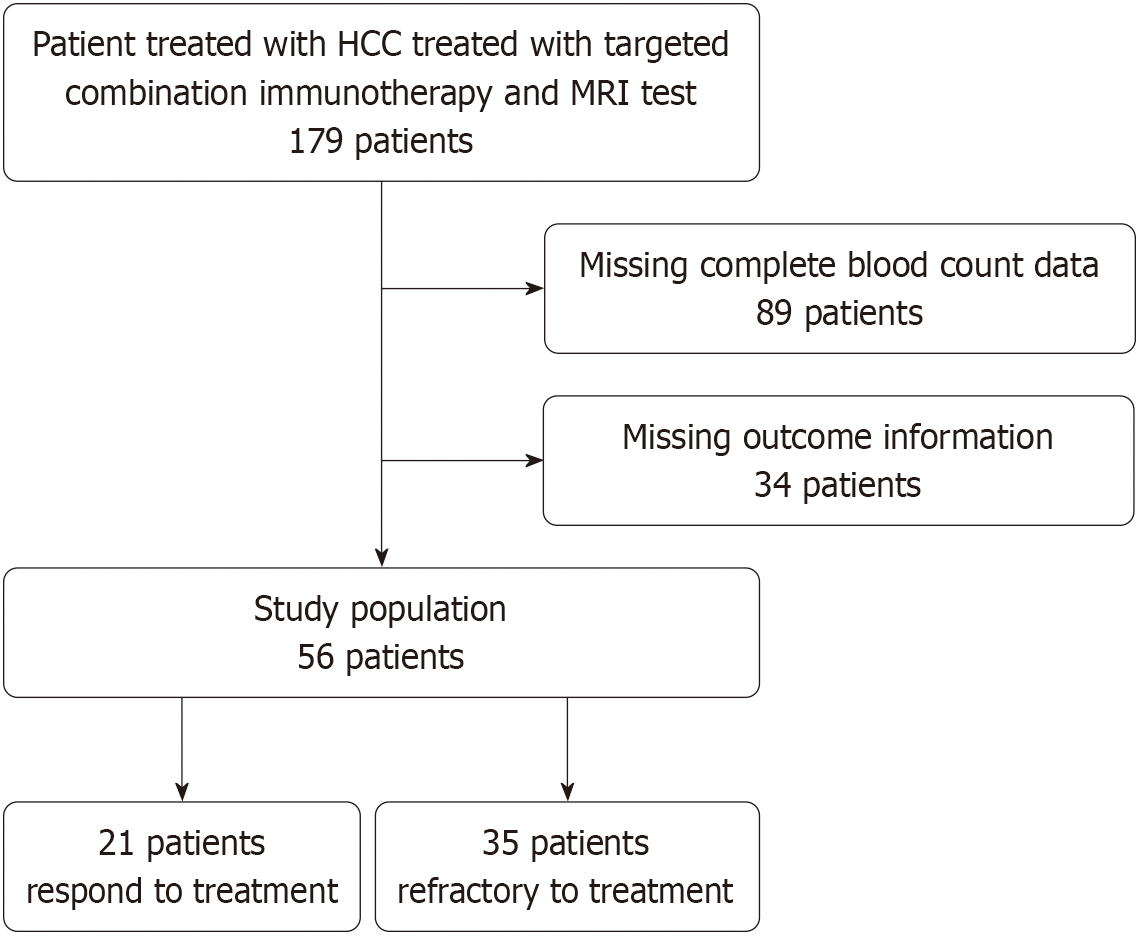
Figure 1 Flow diagram of patient selection.
HCC: Hepatocellular carcinoma; MRI: Magnetic resonance imaging.
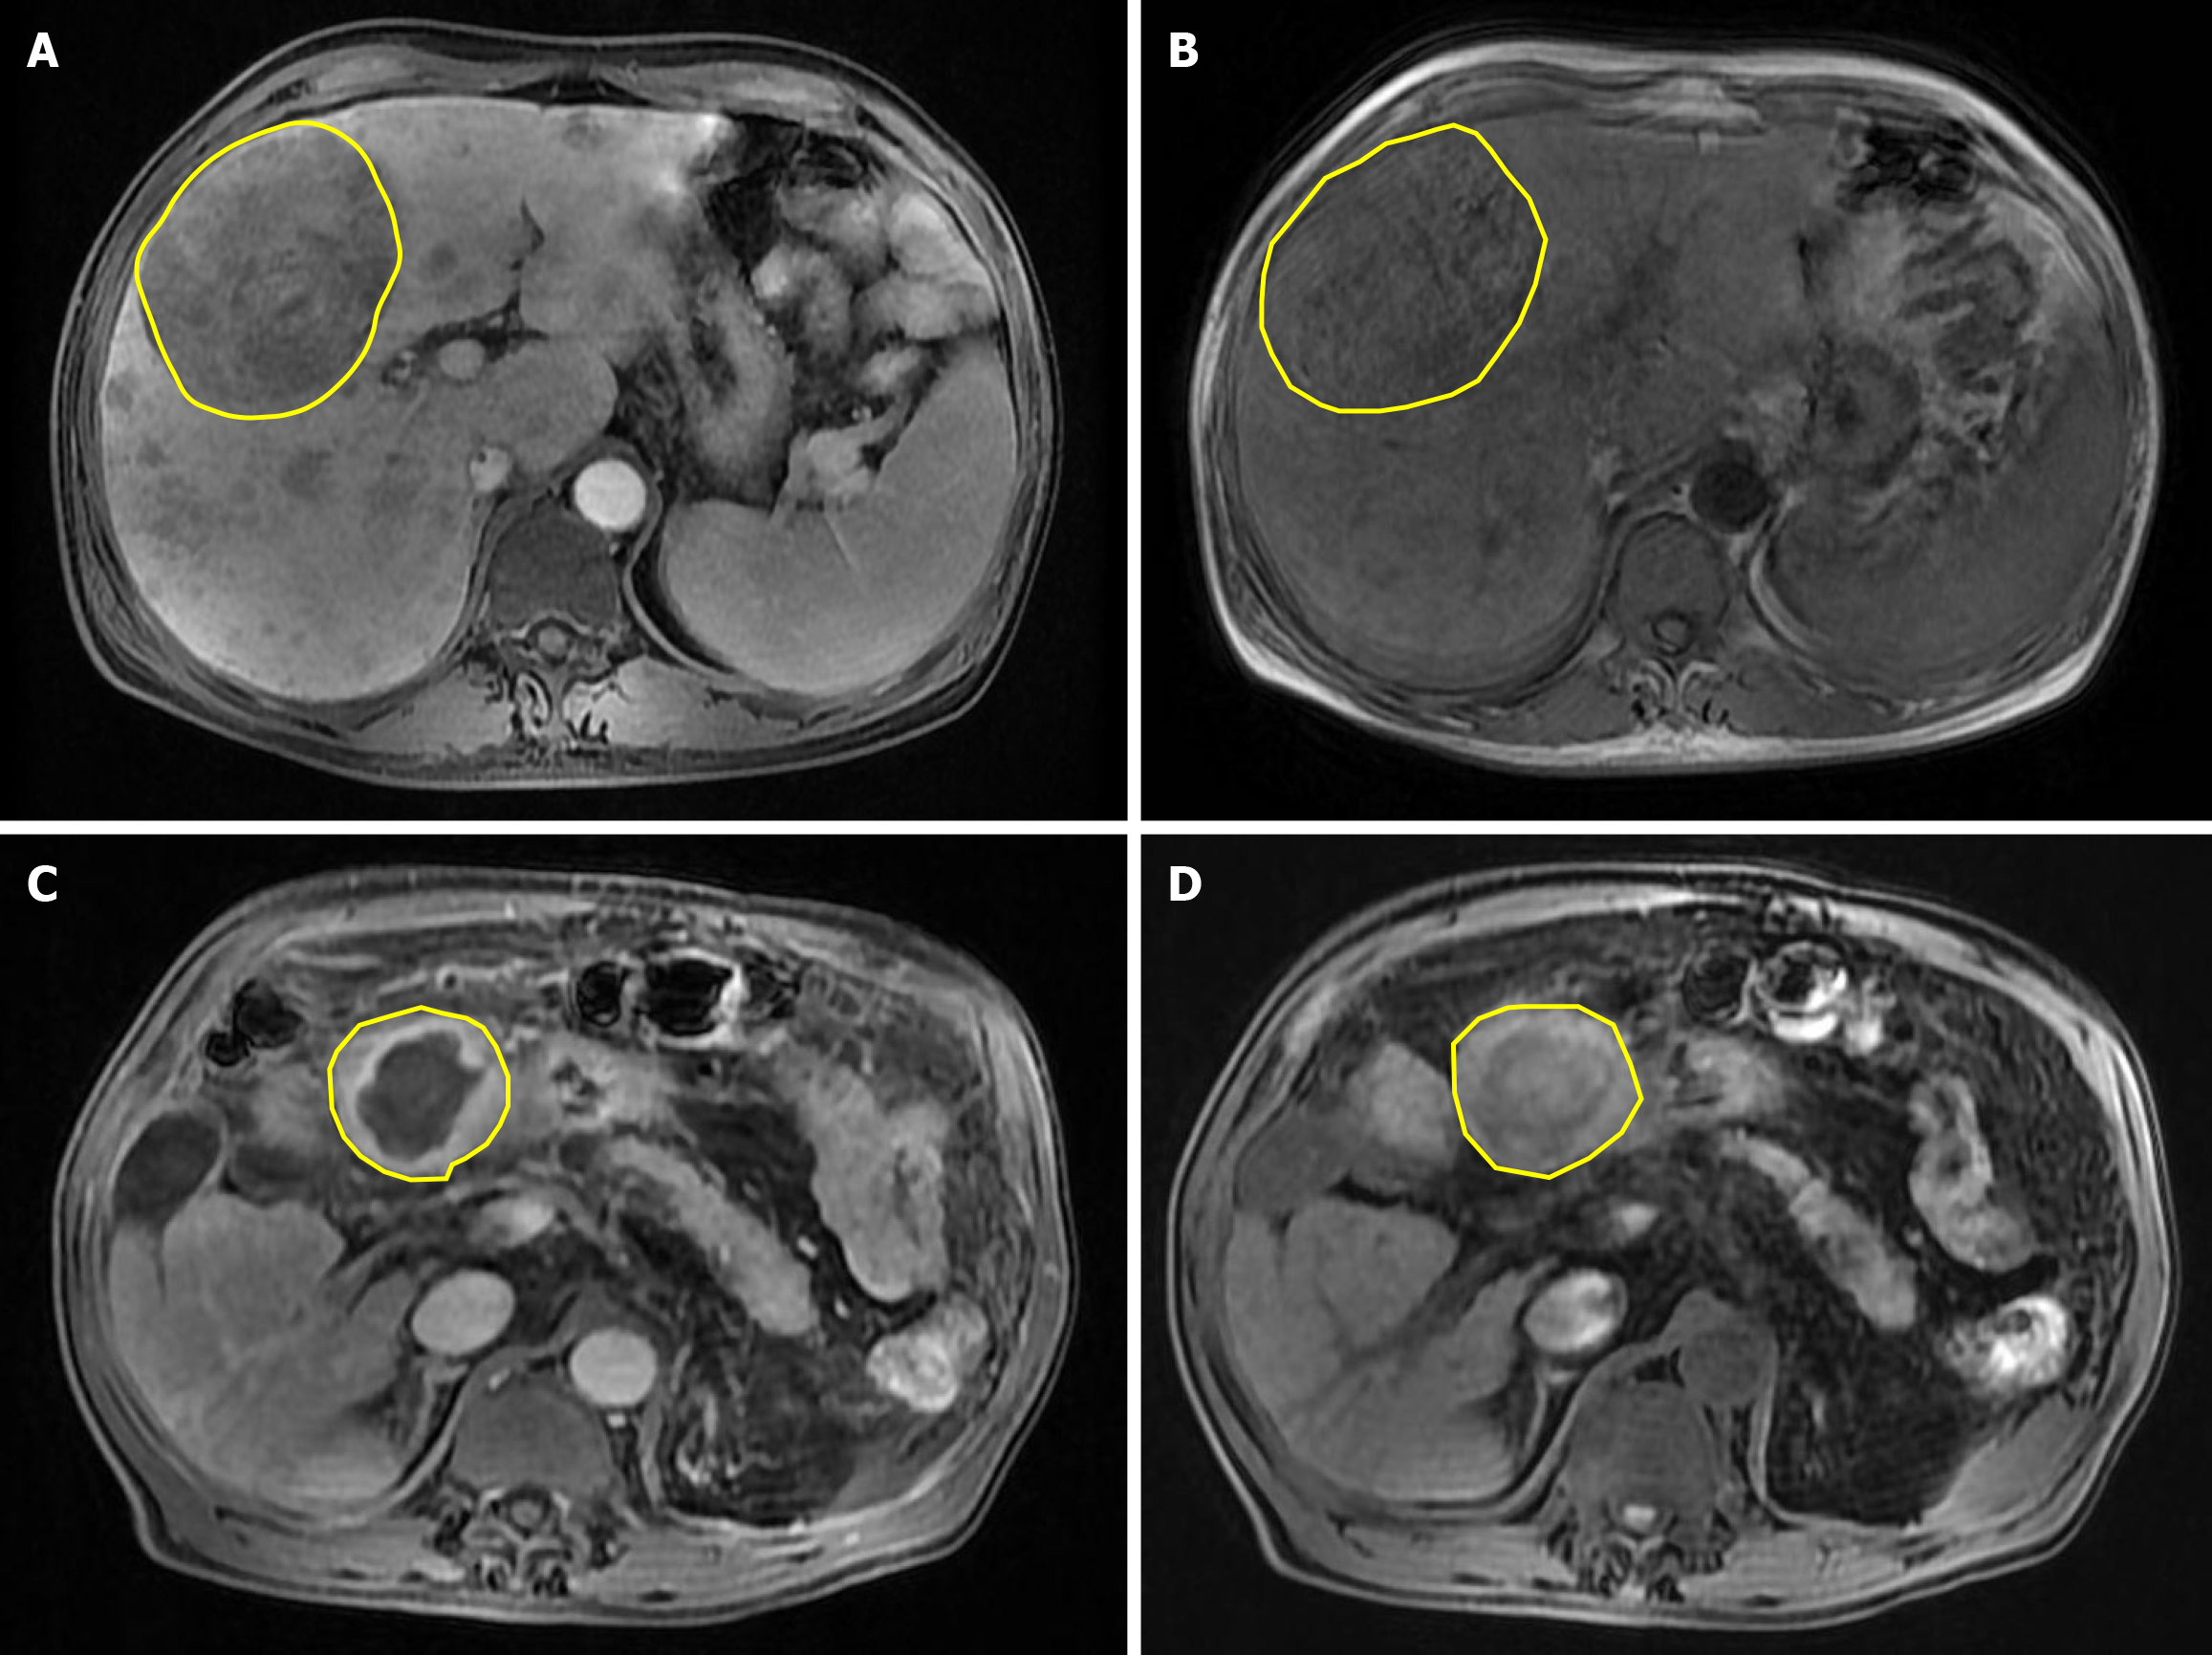
Figure 2 Patient magnetic resonance imaging of hepatobiliary phase and plain scan phase.
A: Patient one’s magnetic resonance imaging (hepatobiliary phase); B: Patient one’s magnetic resonance imaging (plain scan phase); C: Patient two’s magnetic resonance imaging (hepatobiliary phase); D: Patient two’s magnetic resonance imaging (plain scan phase). The yellow marked area represents the regions of interest.
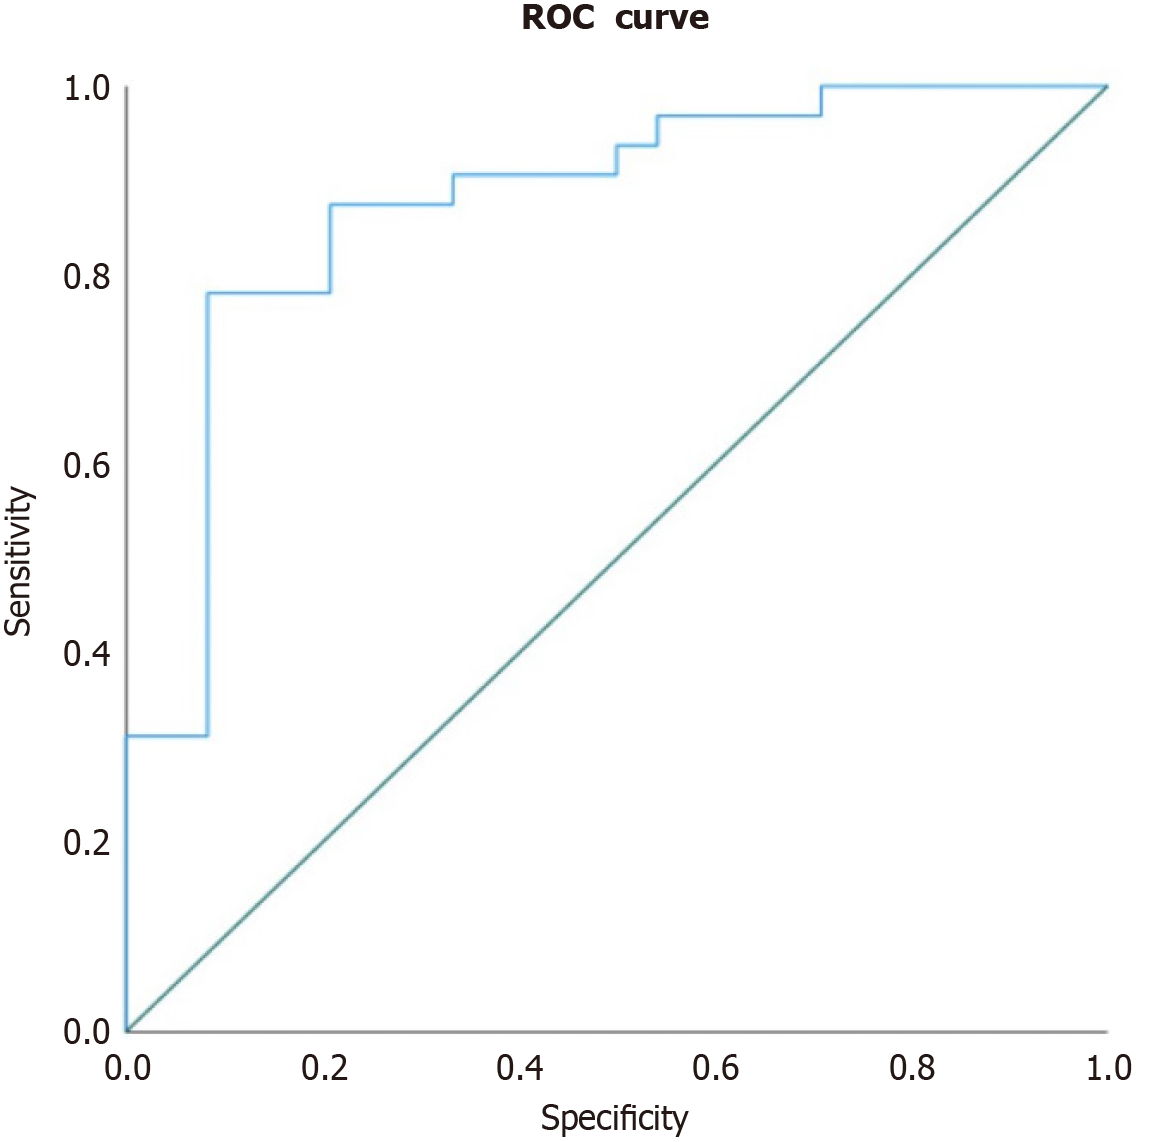
Figure 3 Receiver operating characteristic curve of relative enhancement ratio.
Receiver operating characteristic curve analysis relative enhancement ratio was used to predict the efficacy of tyrosine kinase inhibitors combined with programmed death-1 in patients with advanced hepatocellular carcinoma (area under receiver operating characteristic curve = 0.874). ROC: Receiver operating characteristic.
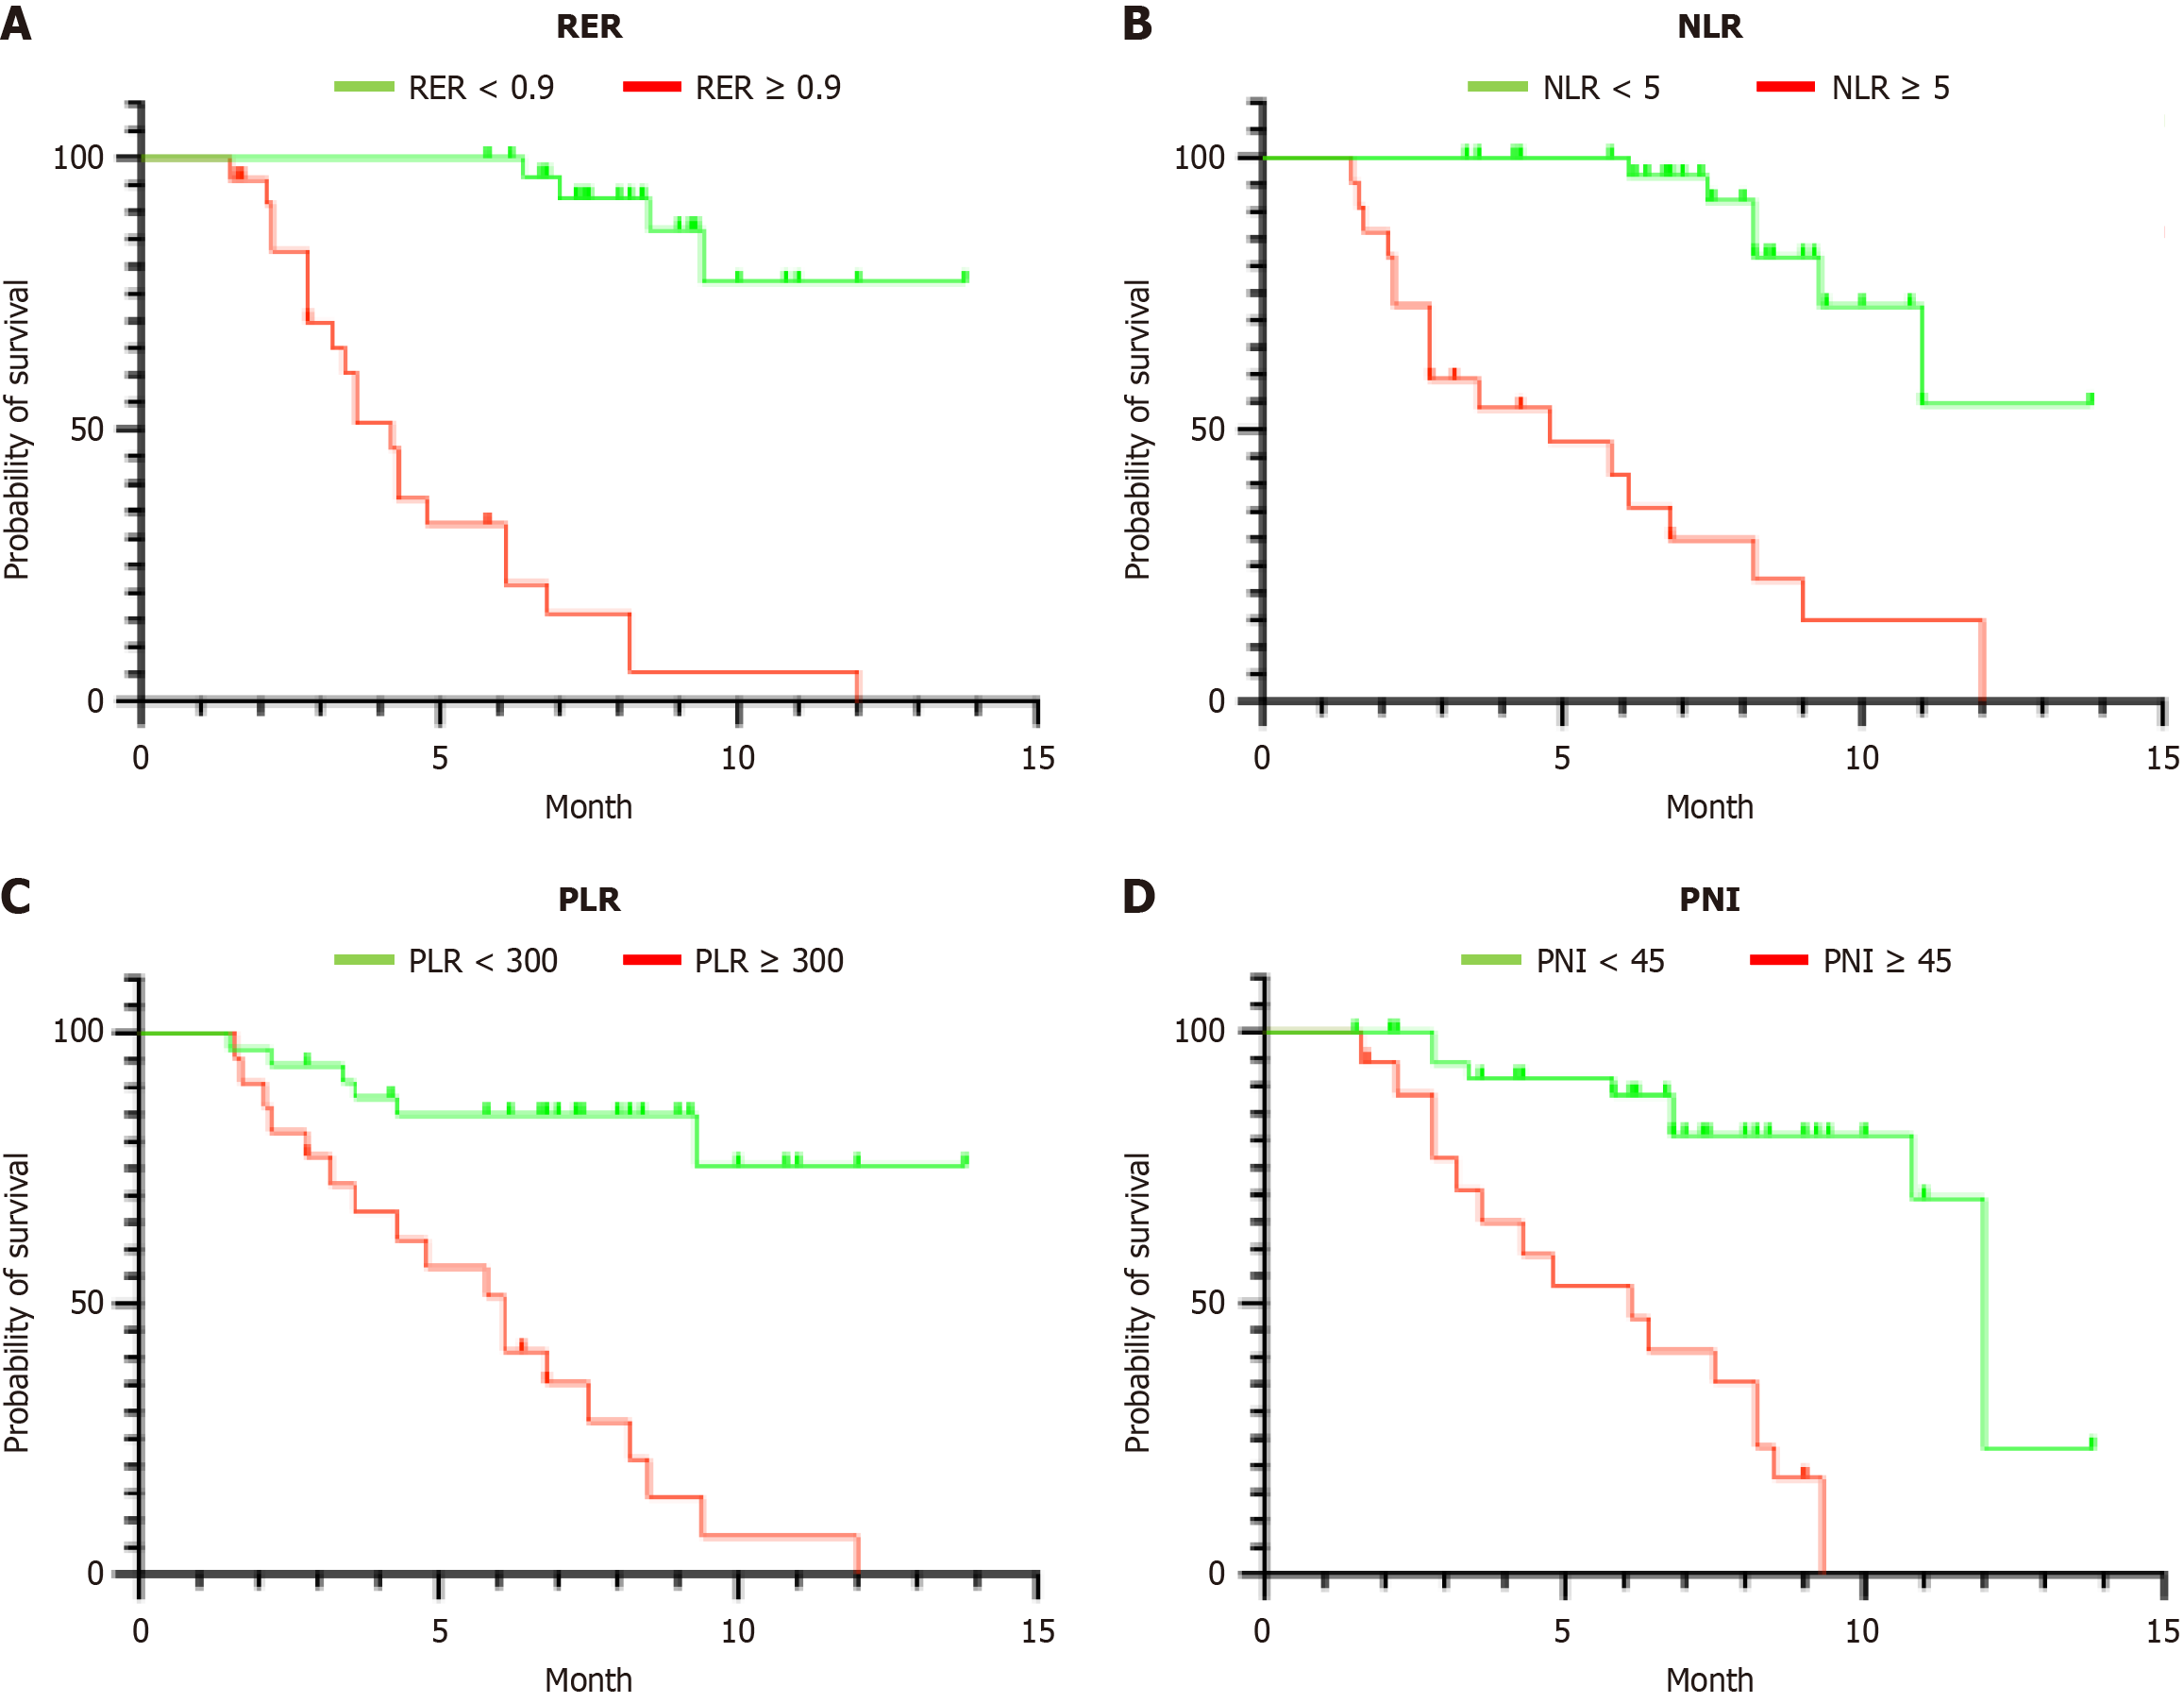
Figure 4 Kaplan-Meier survival estimates of progression-free survival.
A: Comparison of patients with relative enhancement ratio < 0.9 and relative enhancement ratio ≥ 0.9; B: Comparison of patients with neutrophil-to-lymphocyte ratio < 5 and neutrophil-to-lymphocyte ratio ≥ 5; C: Comparison of patients with platelet-to-lymphocyte ratio < 300 and platelet-to-lymphocyte ratio ≥ 300; D: Comparison of patients with prognostic nutritional index < 45 and prognostic nutritional index ≥ 45. RER: Relative enhancement ratio; NLR: Neutrophil-to-lymphocyte ratio; PLR: Platelet-to-lymphocyte ratio; PNI: Prognostic nutritional index.
- Citation: Zhang X, Zhang X, Luo QK, Fu Q, Liu P, Pan CJ, Liu CJ, Zhang HW, Qin T. Pretreatment radiomic imaging features combined with immunological indicators to predict targeted combination immunotherapy response in advanced hepatocellular carcinoma. World J Clin Oncol 2025; 16(4): 102735
- URL: https://www.wjgnet.com/2218-4333/full/v16/i4/102735.htm
- DOI: https://dx.doi.org/10.5306/wjco.v16.i4.102735


