Copyright
©The Author(s) 2025.
World J Clin Oncol. Apr 24, 2025; 16(4): 102199
Published online Apr 24, 2025. doi: 10.5306/wjco.v16.i4.102199
Published online Apr 24, 2025. doi: 10.5306/wjco.v16.i4.102199
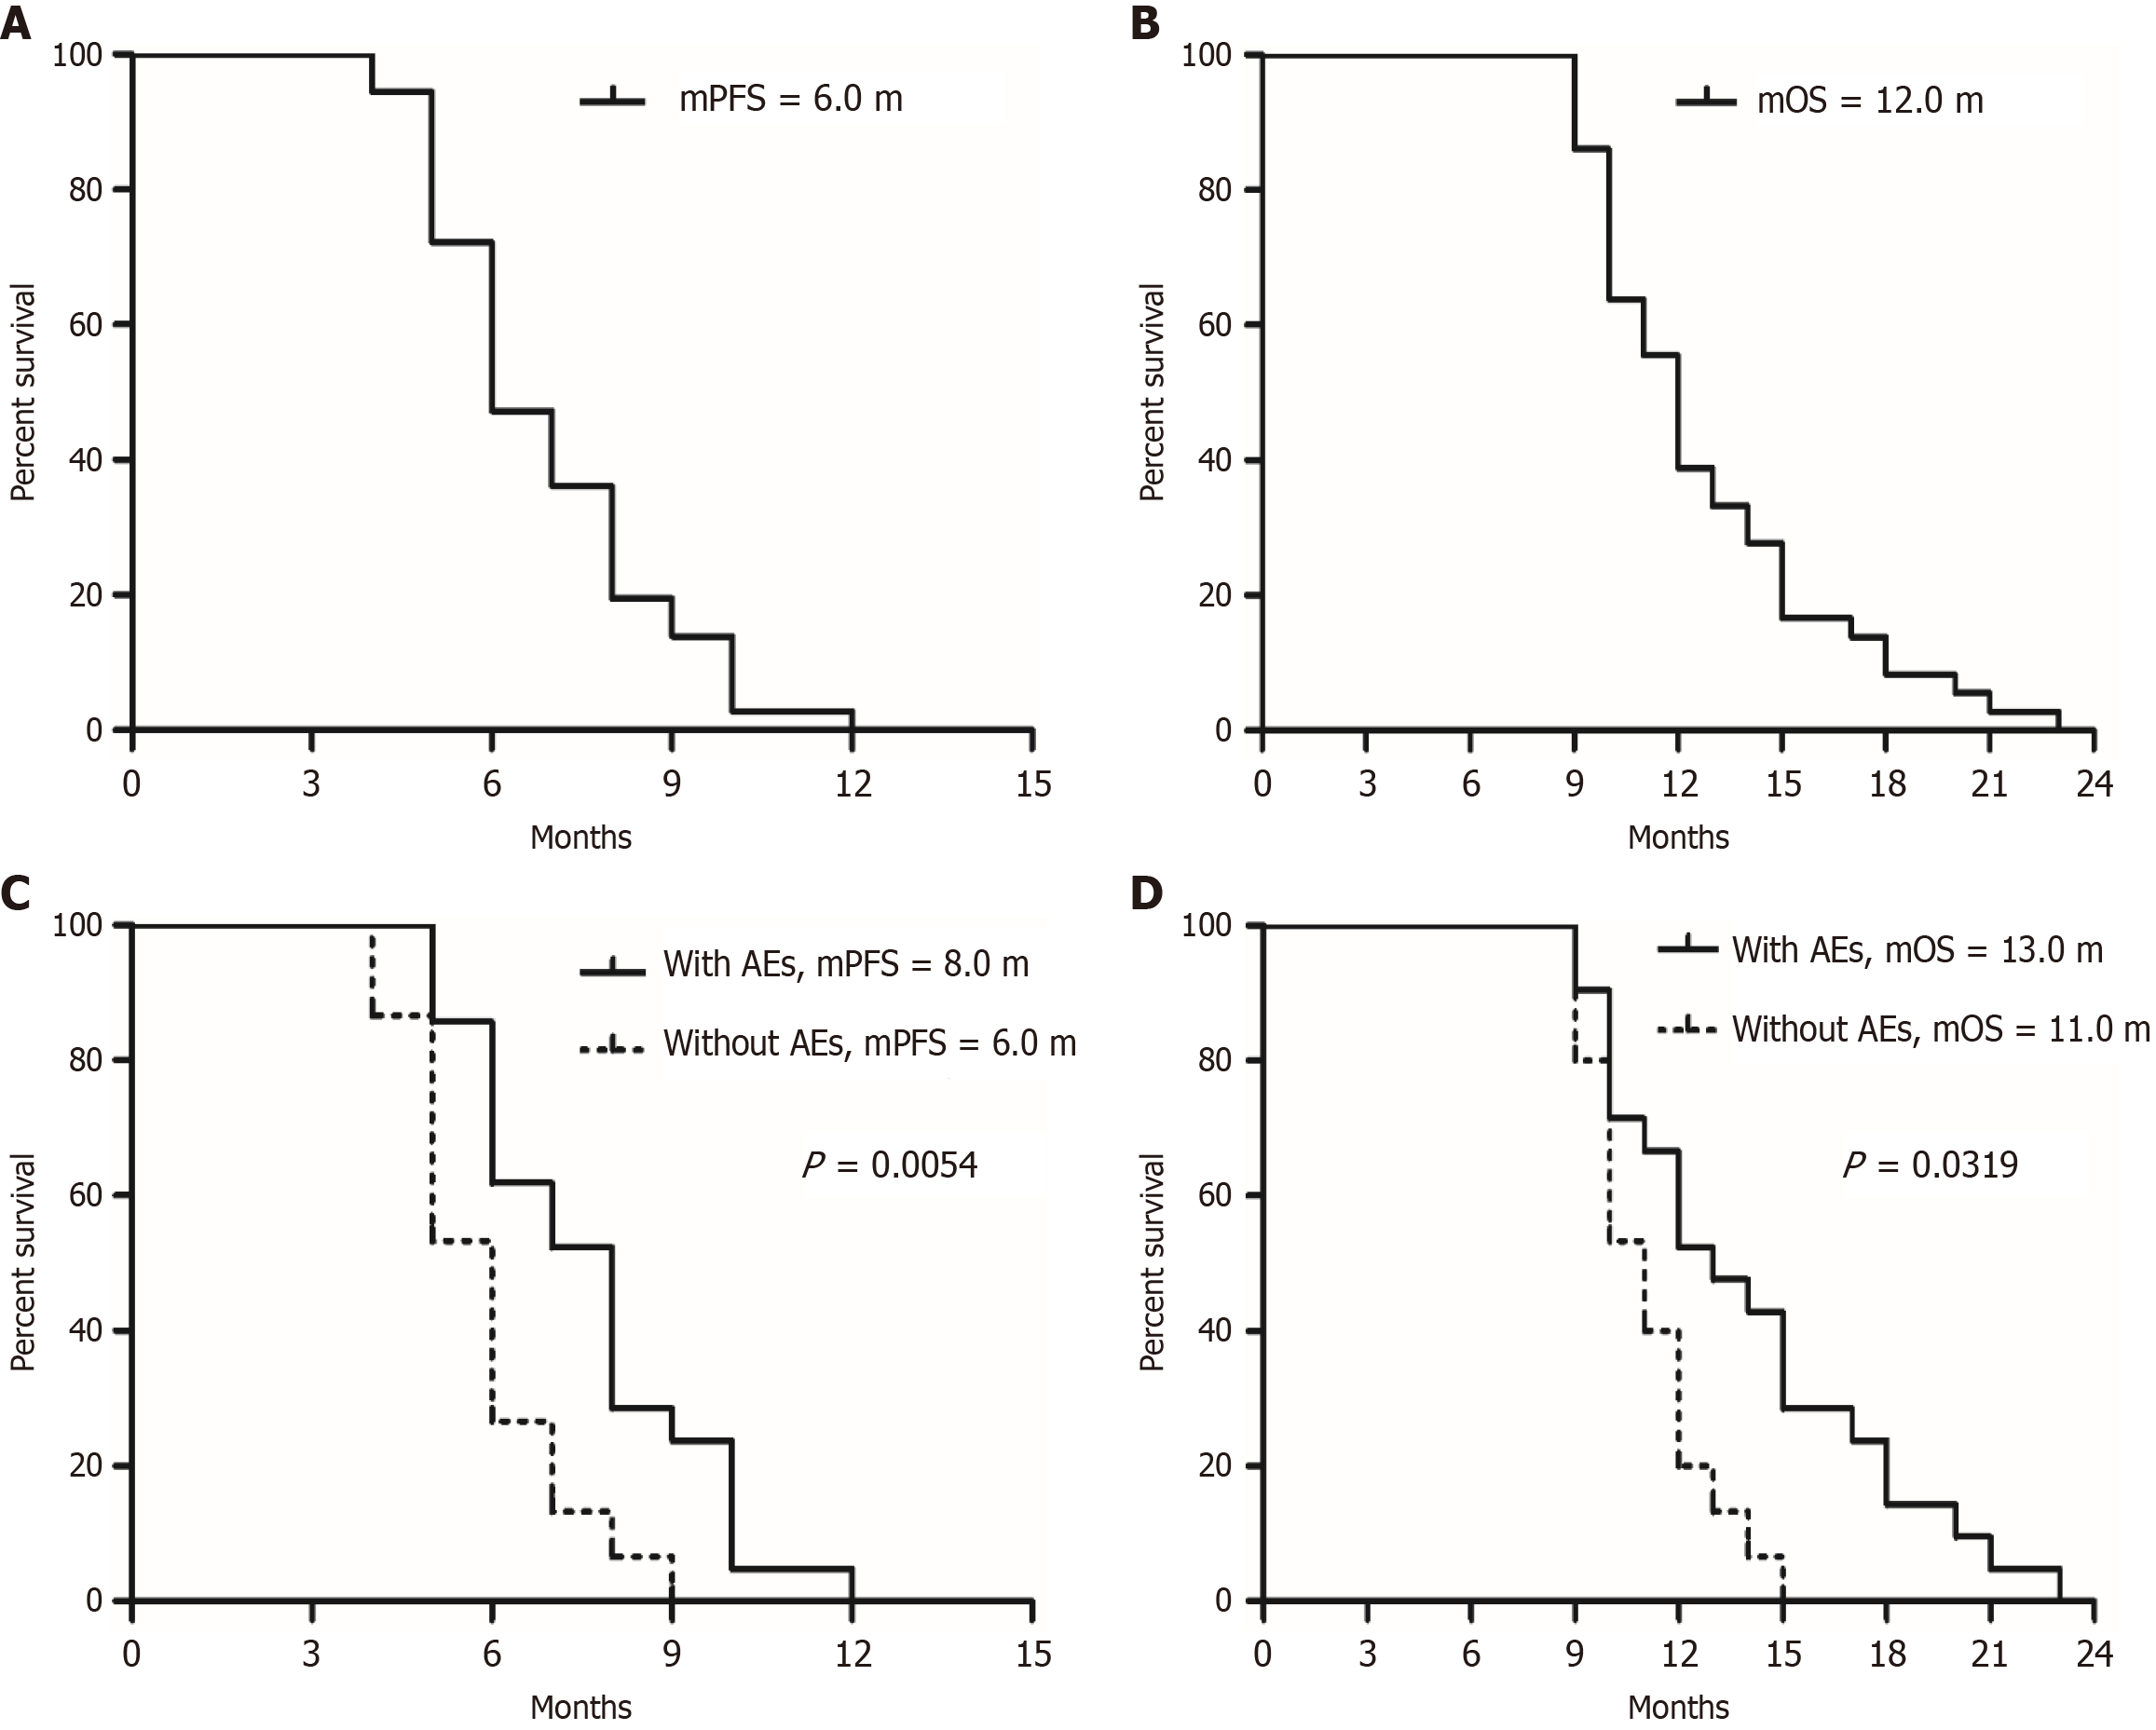
Figure 1 Median progression-free survival and overall survival for the general population and subgroups receiving anlotinib combined with nab-ptx as second-line or above treatment for advanced gastric cancer.
A and B: Median progression-free survival (PFS) and overall survival (OS) for the general population, respectively; C and D: Comparisons of PFS and OS between patients with and without adverse events (AEs) during the entire treatment (with AEs vs without AEs). mPFS: Median progression-free survival; mOS: Median overall survival; sAE: Any AE including hypertension, proteinuria, and hand-foot syndrome.
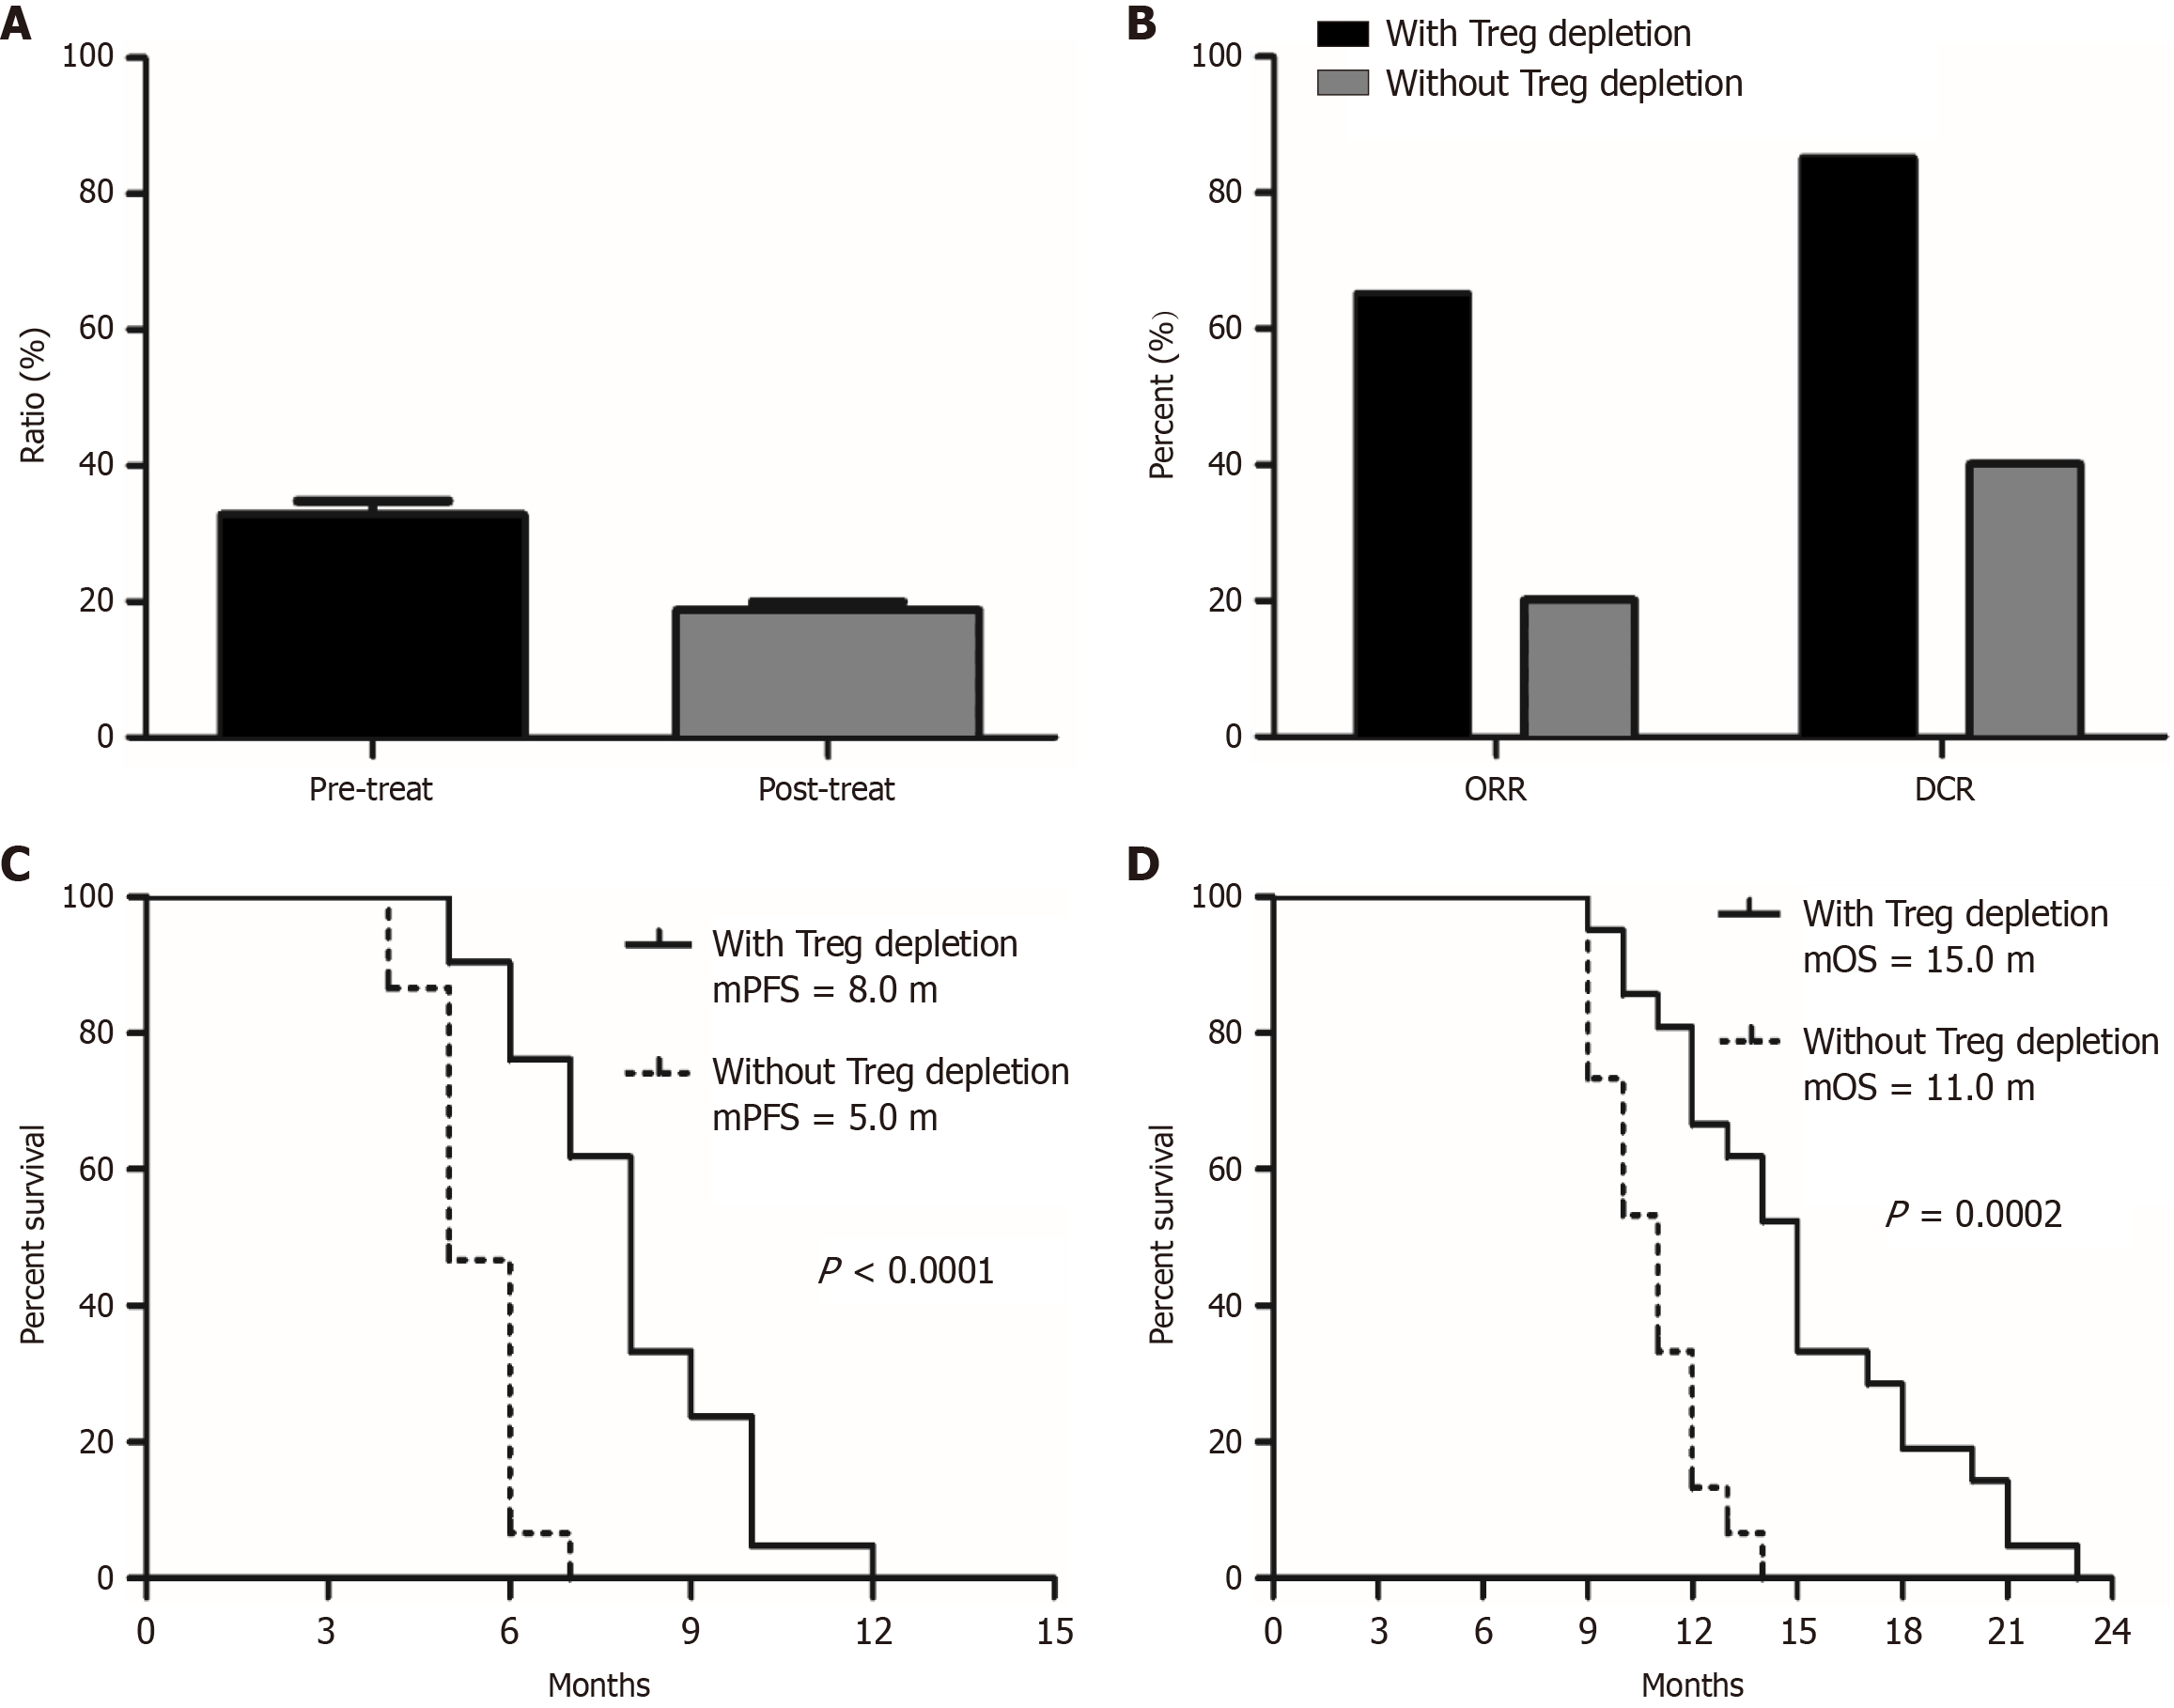
Figure 2 Changes in Treg cell proportions in peripheral blood before and after treatment with anlotinib combined with nab-ptx as second-line or above therapy for advanced gastric cancer patients, and their association with efficacy.
A: Changes in Treg proportions before and after treatment; B: The objective response rate and disease control rate in different populations after treatment based on Treg cell depletion (with Treg cell depletion vs without Treg cell depletion); C and D: Progression-free survival and overall survival comparisons among different populations after treatment based on Treg cell depletion (with Treg cell depletion vs without Treg cell depletion). mPFS: Median progression-free survival; mOS: Median overall survival.
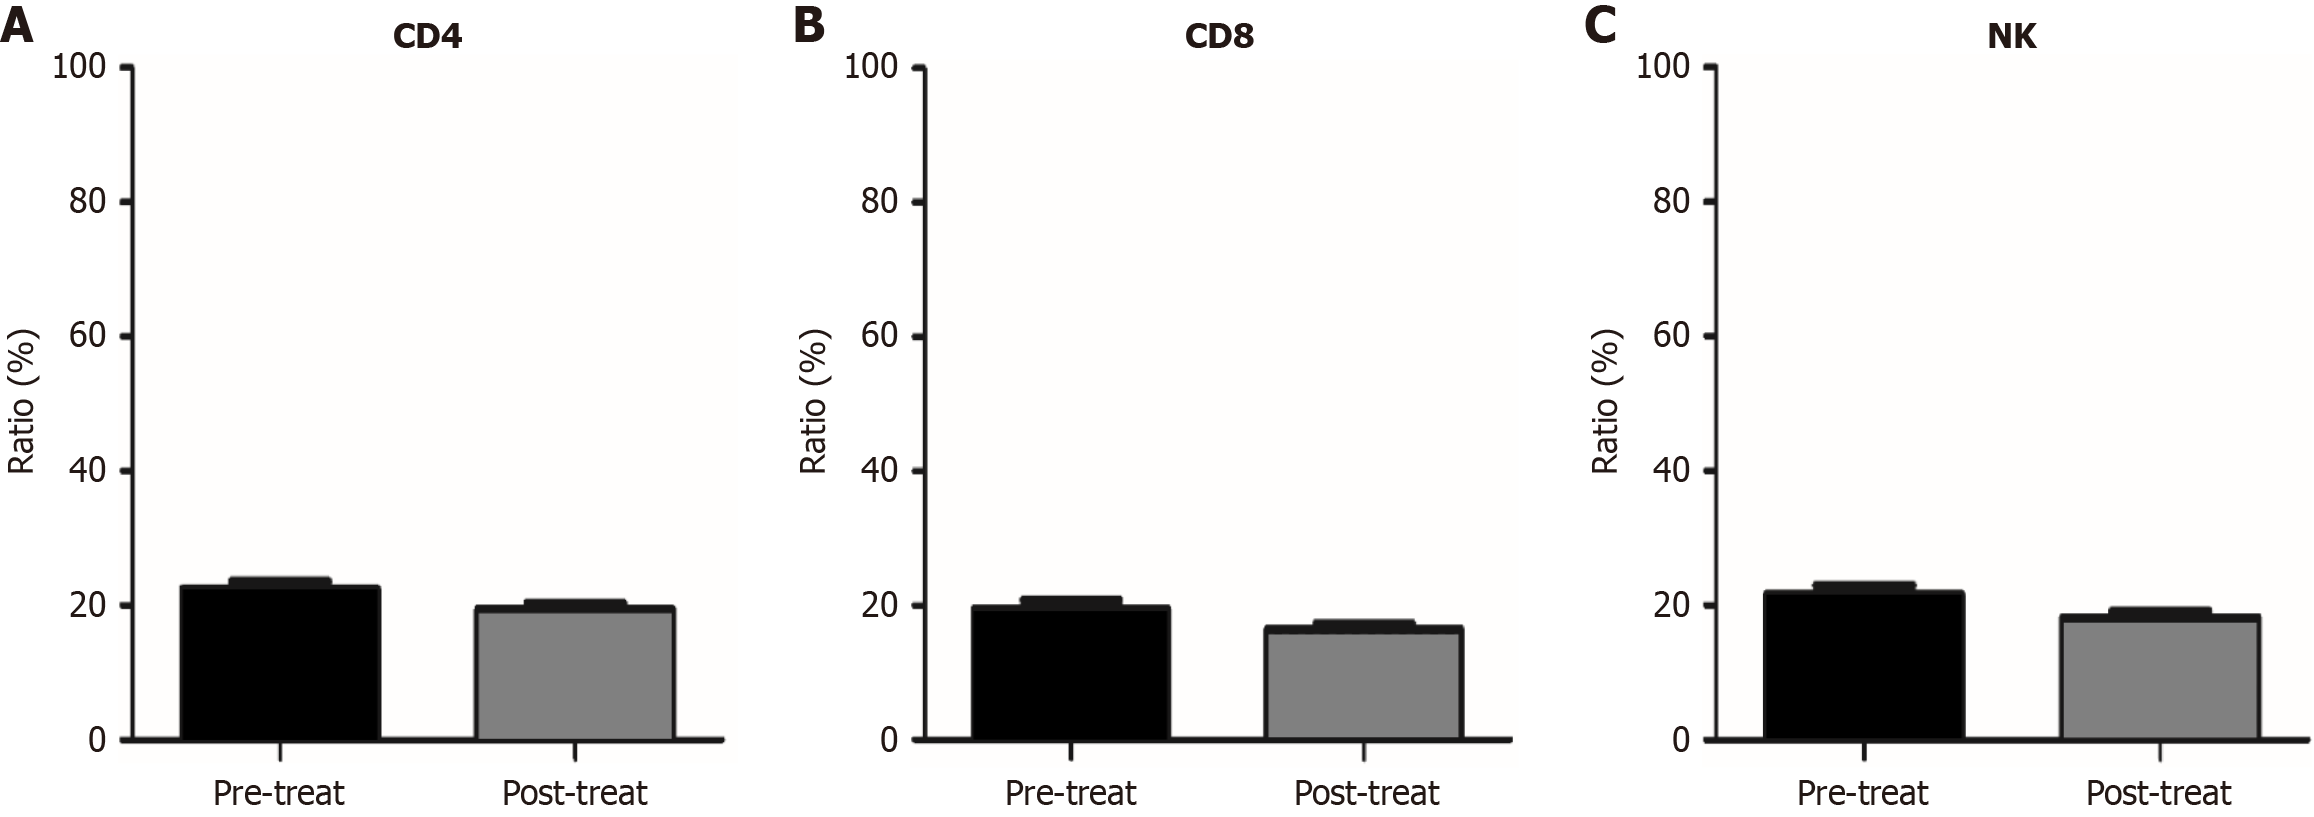
Figure 3 Changes in the proportion of other immune cells (CD4+, CD8+, and NK+ cells) in peripheral blood before and after treatment with anlotinib combined with nab-ptx in patients with advanced gastric cancer receiving second-line or higher treatment.
The changes in the proportions of CD4+, CD8+, and NK+ cells in peripheral blood before and after treatment, respectively. A: CD4+; B: CD8+; C: NK+.
- Citation: Liu WM, Liu YR, Peng Y, Tang J, Li XB. Combination of anlotinib and albumin-bound paclitaxel in 2nd line and above treatment of advanced gastric cancer: A retrospective study. World J Clin Oncol 2025; 16(4): 102199
- URL: https://www.wjgnet.com/2218-4333/full/v16/i4/102199.htm
- DOI: https://dx.doi.org/10.5306/wjco.v16.i4.102199


