Copyright
©The Author(s) 2025.
World J Clin Oncol. Mar 24, 2025; 16(3): 101725
Published online Mar 24, 2025. doi: 10.5306/wjco.v16.i3.101725
Published online Mar 24, 2025. doi: 10.5306/wjco.v16.i3.101725
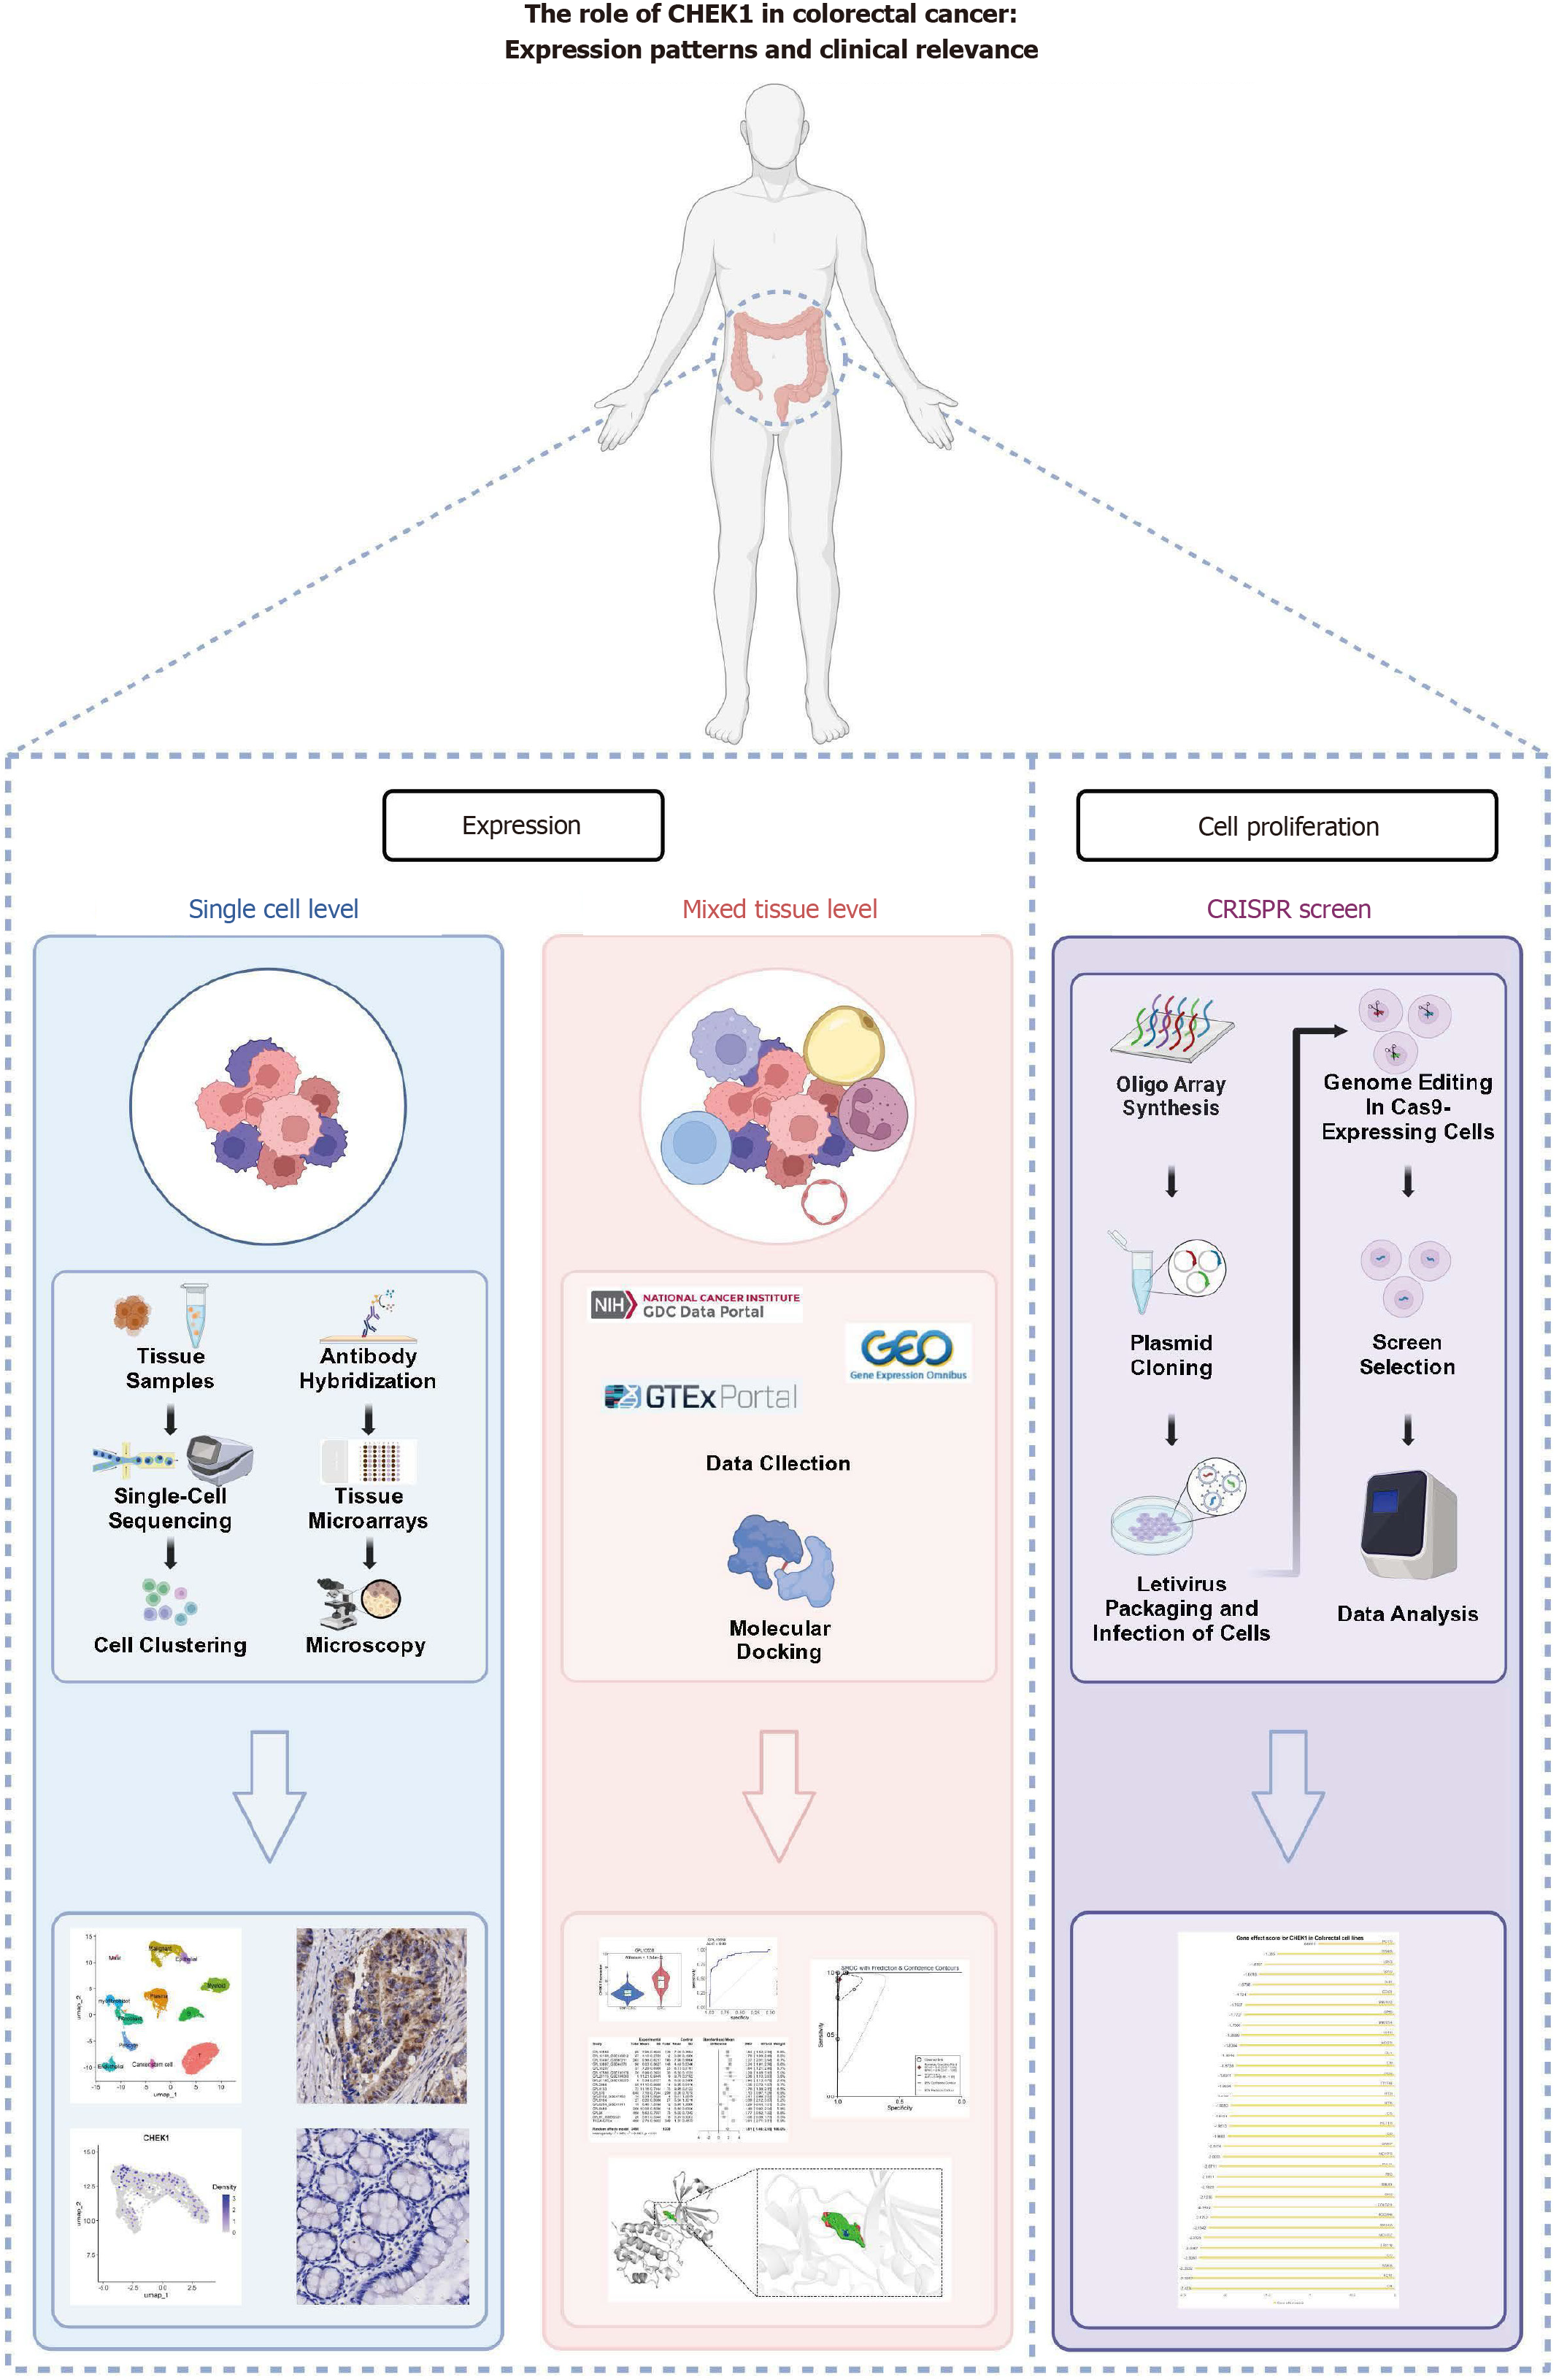
Figure 1 Flowchart of this study.
Shows the data analysis and main article structure.
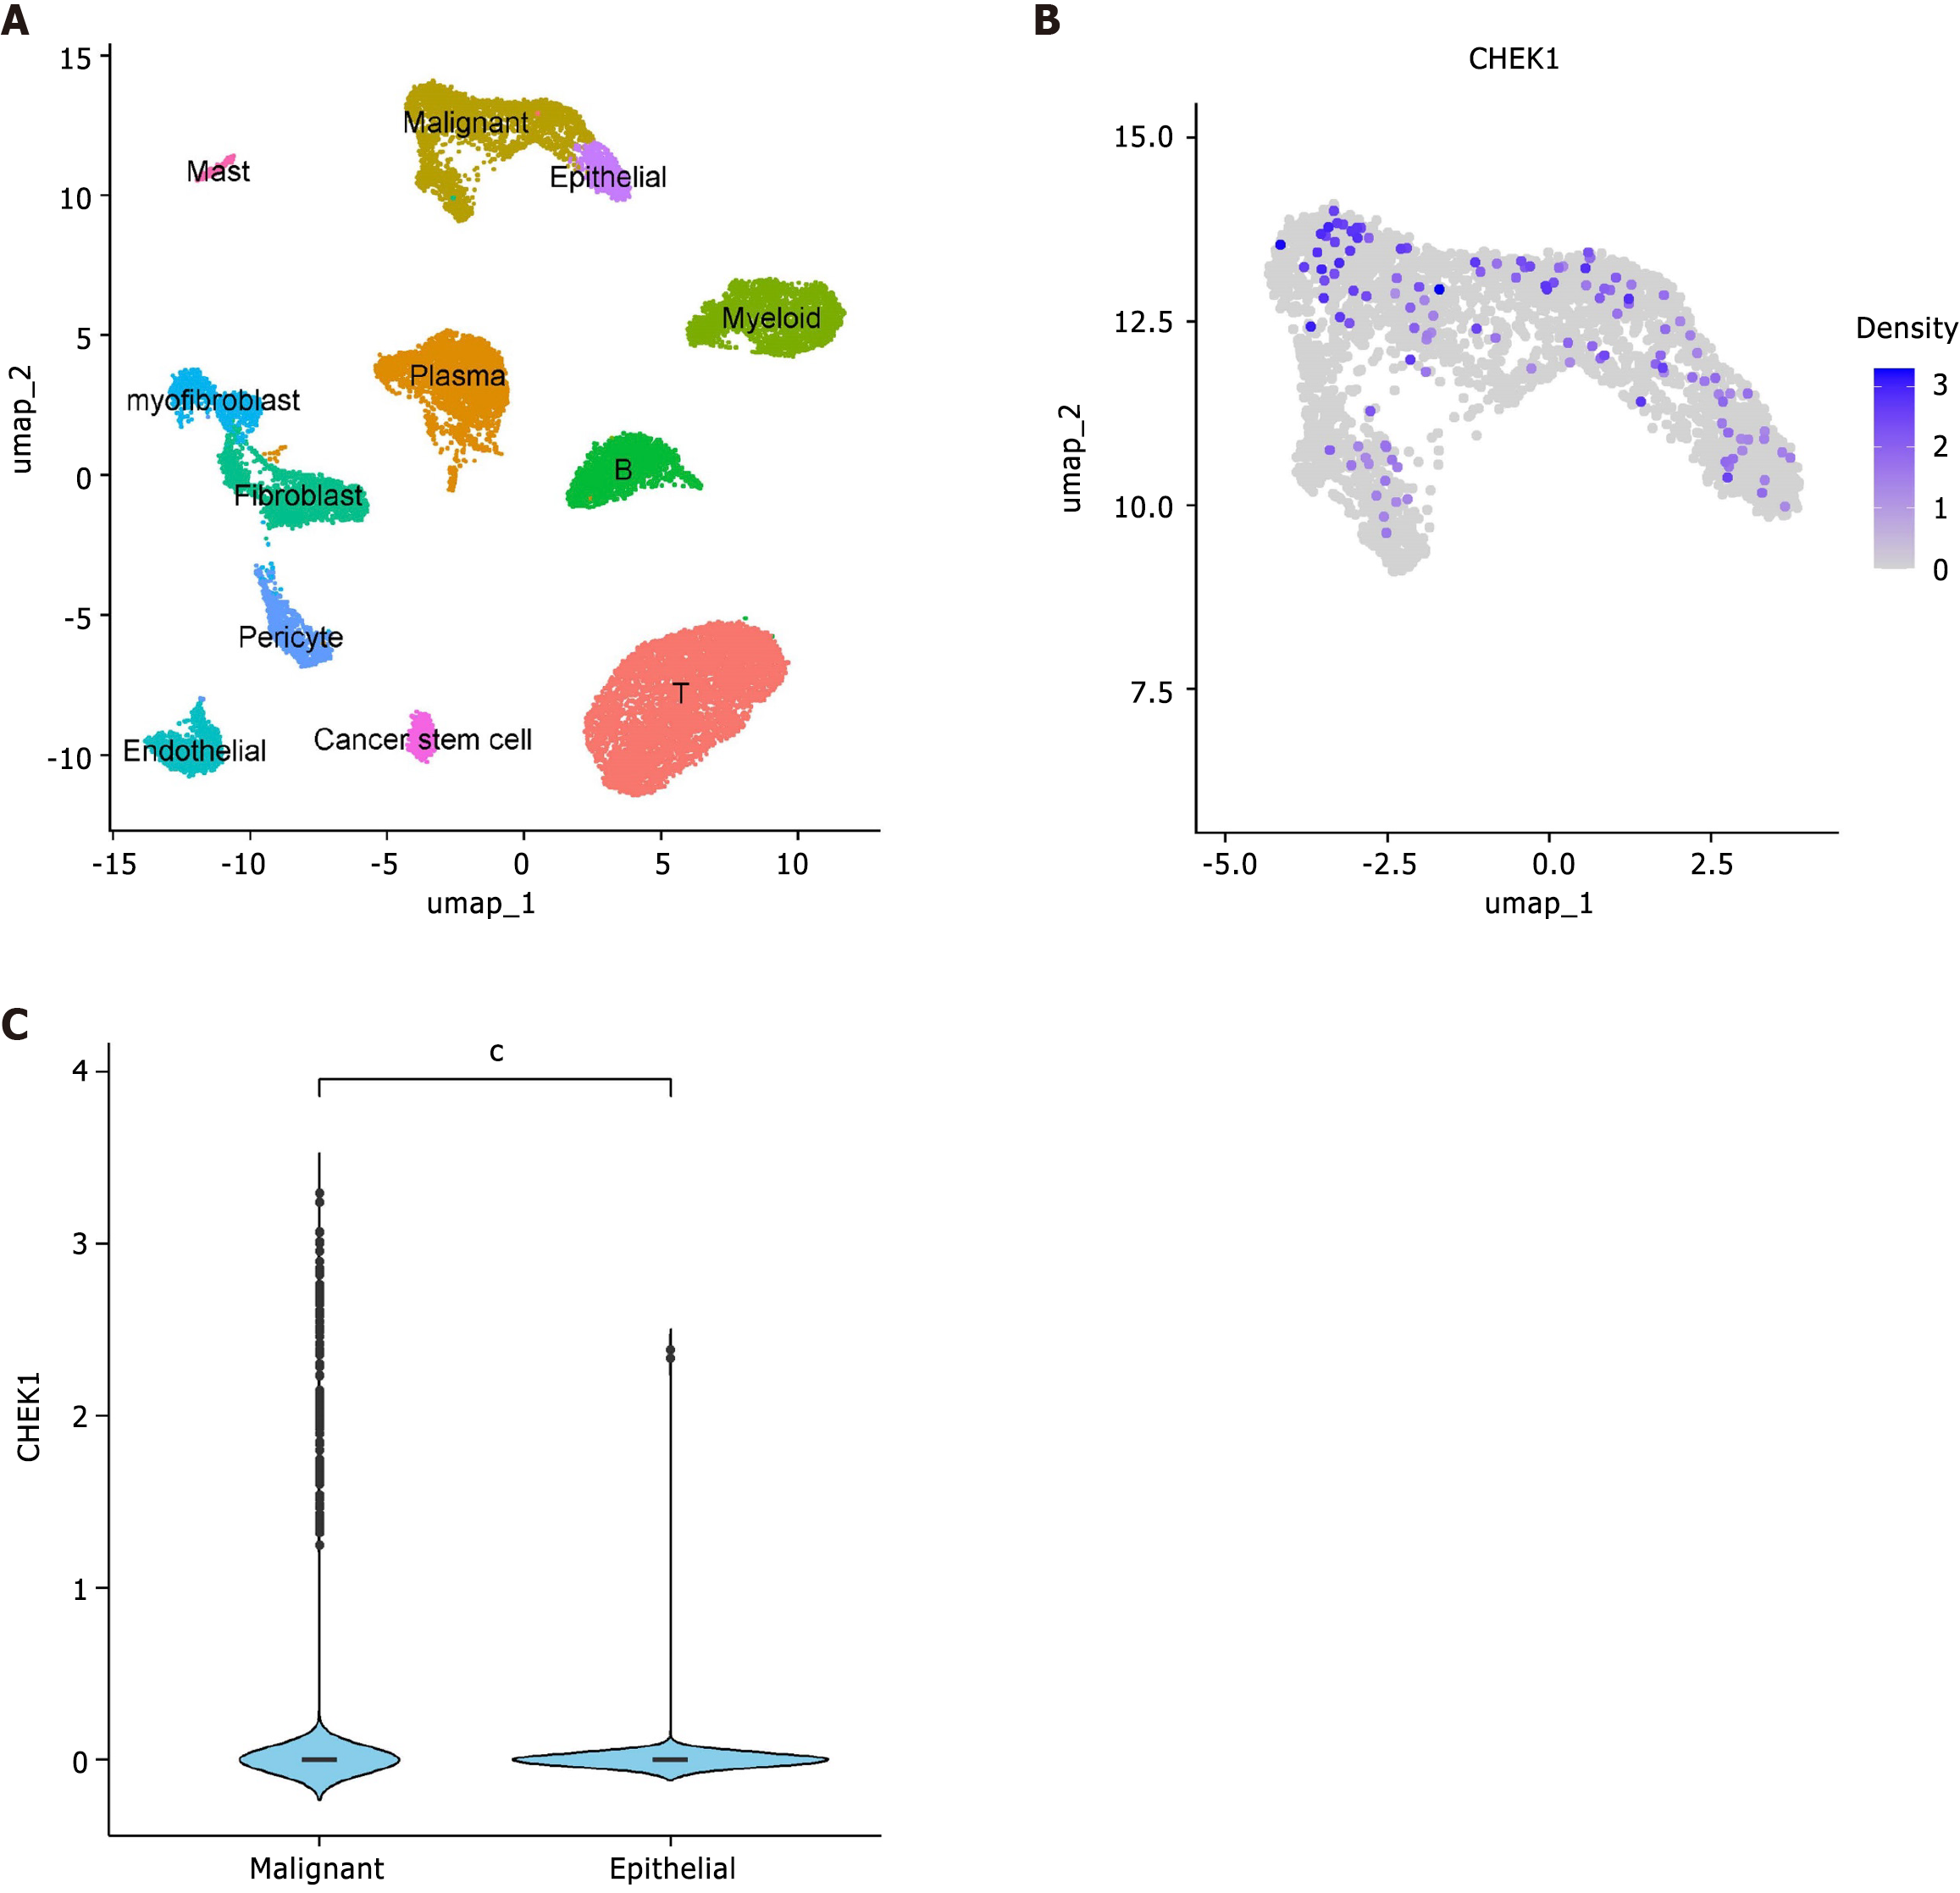
Figure 2 Single-cell analysis of checkpoint kinase 1 expression in Colorectal cancer tissues.
A: Cell annotation; B: Expression of checkpoint kinase 1 in epithelial cells; C: Expression of checkpoint kinase 1 in malignant and normal epithelial cells.
Figure 3 Expression of checkpoint kinase 1 protein in adjacent non-cancerous tissues (left side of images: 500 μm, middle column: 200 μm, right side: 50 μm).
A: Sample 1; B: Sample 2; C: Sample 3; D: Sample 4.
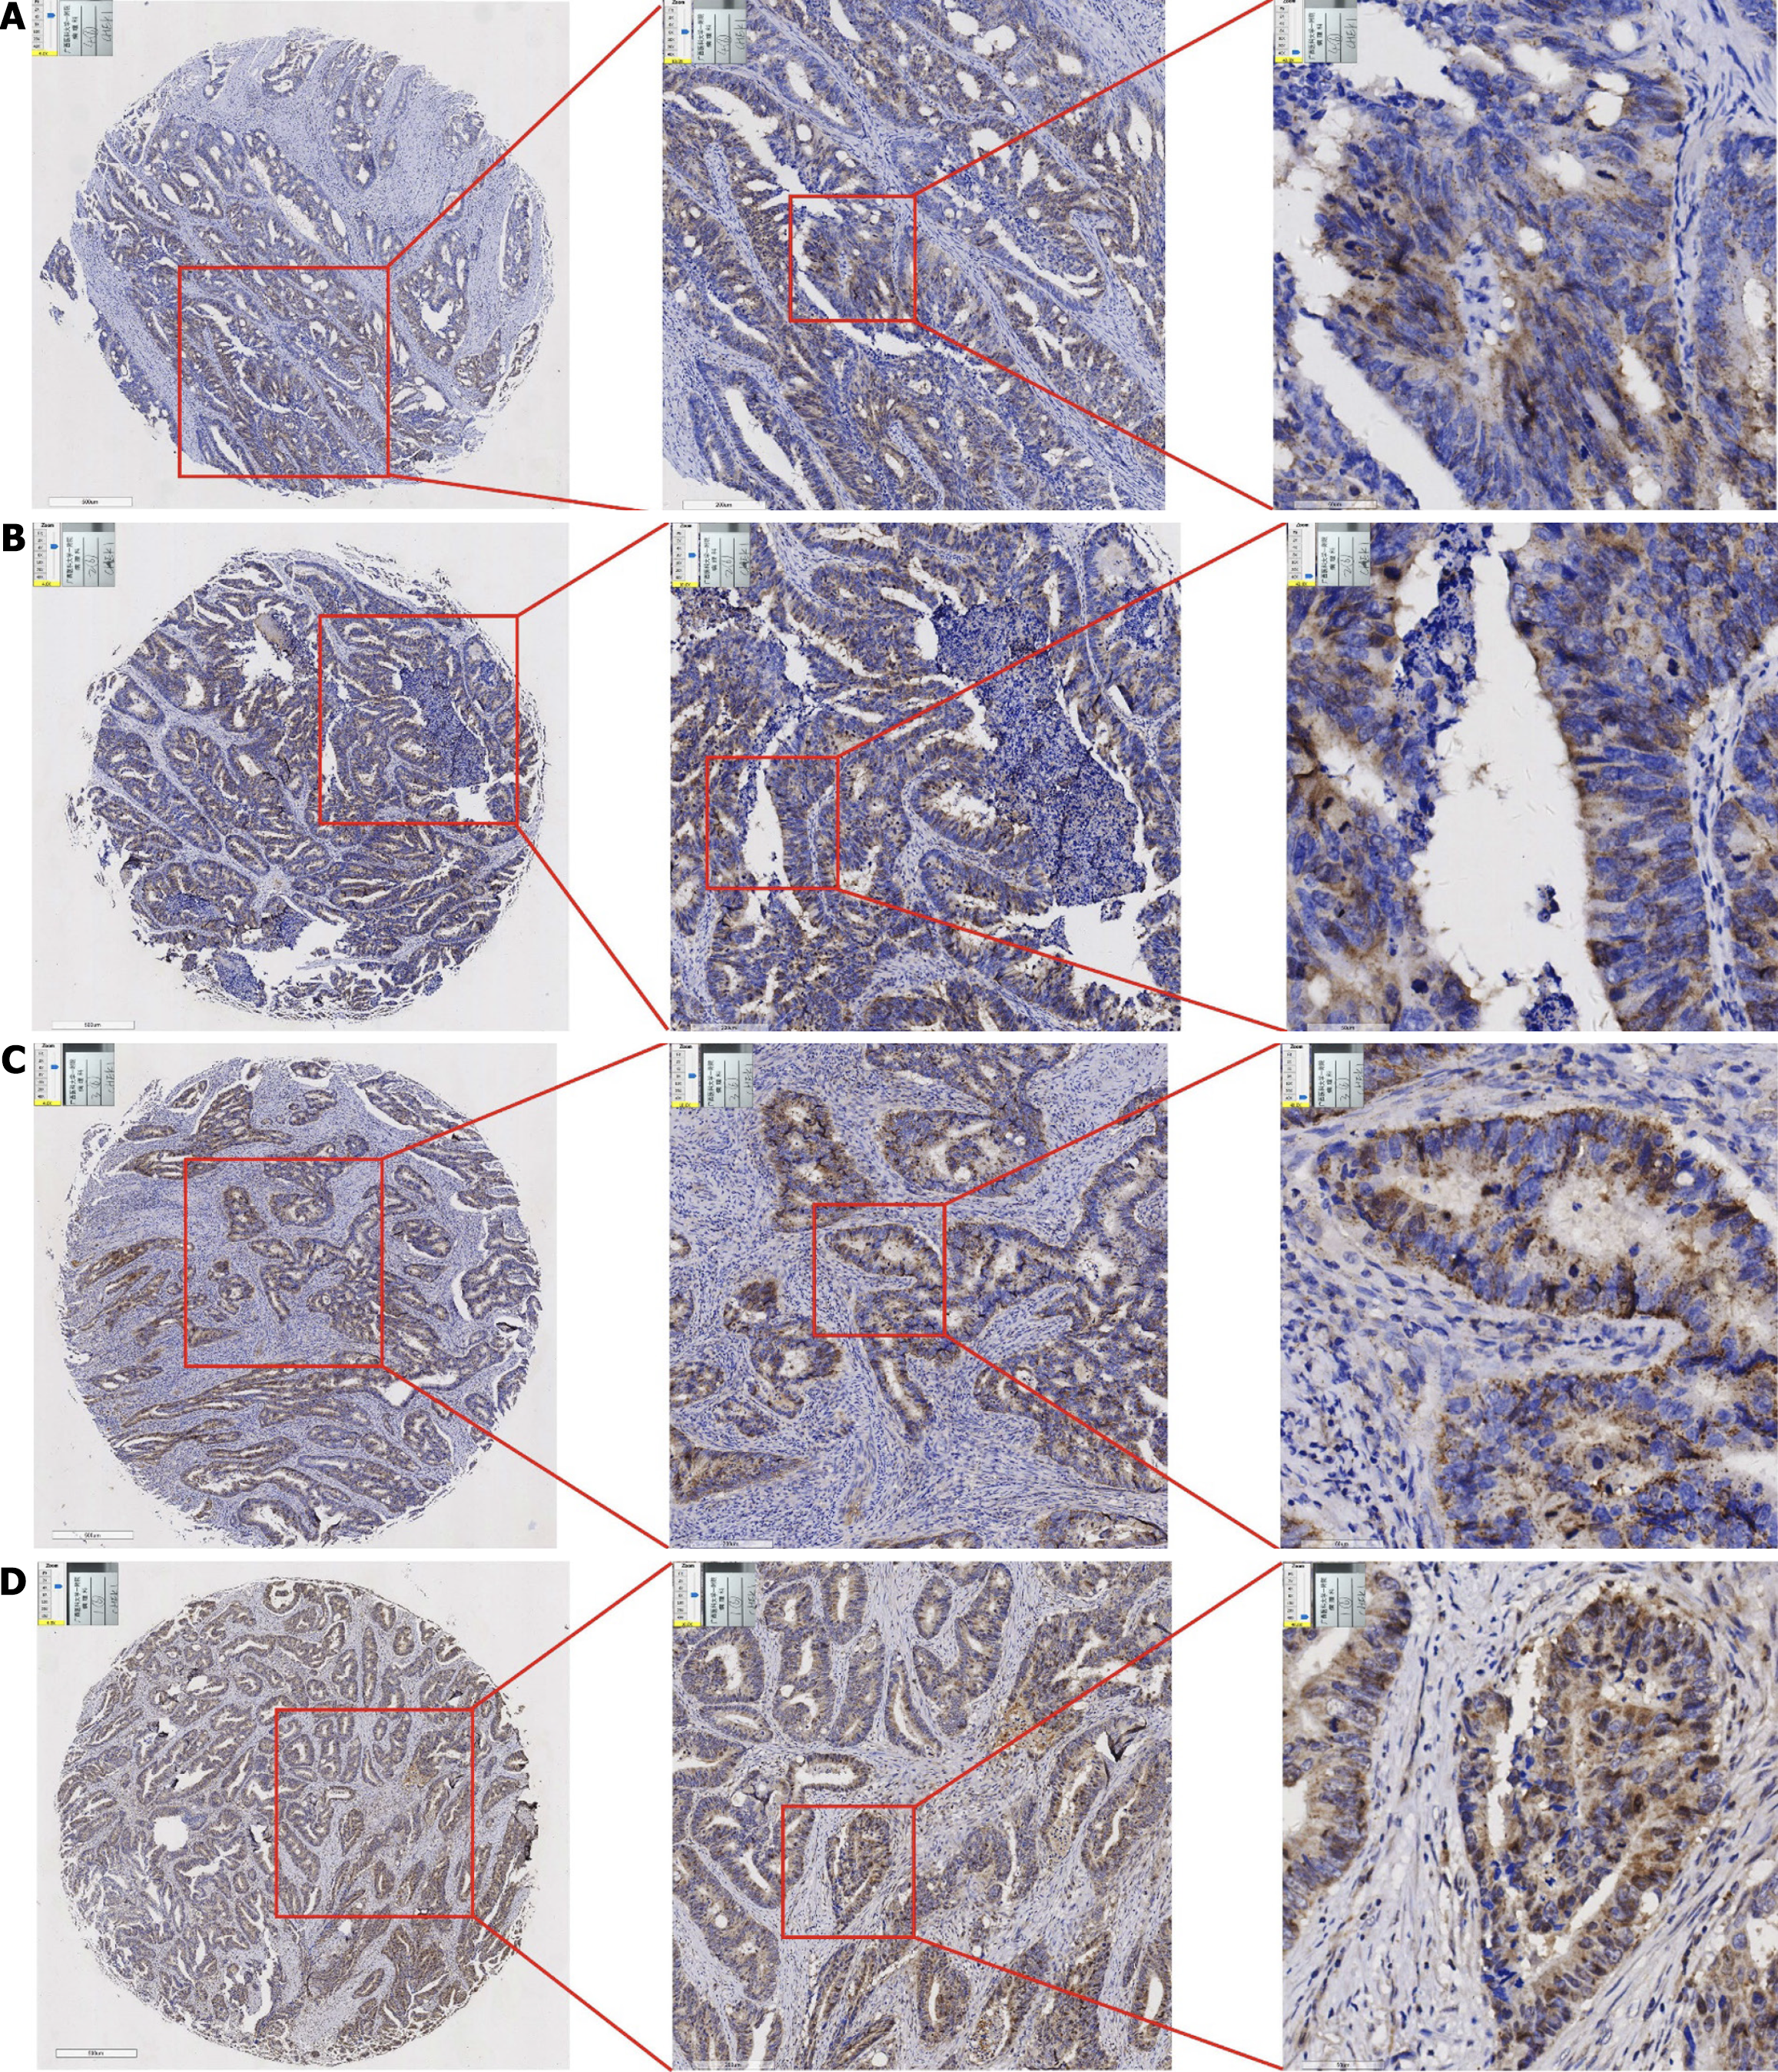
Figure 4 Expression of checkpoint kinase 1 protein in colorectal cancer tissues (left side of images: 500 μm, middle column: 200 μm, right side: 50 μm).
A: Sample 1; B: Sample 2; C: Sample 3; D: Sample 4.
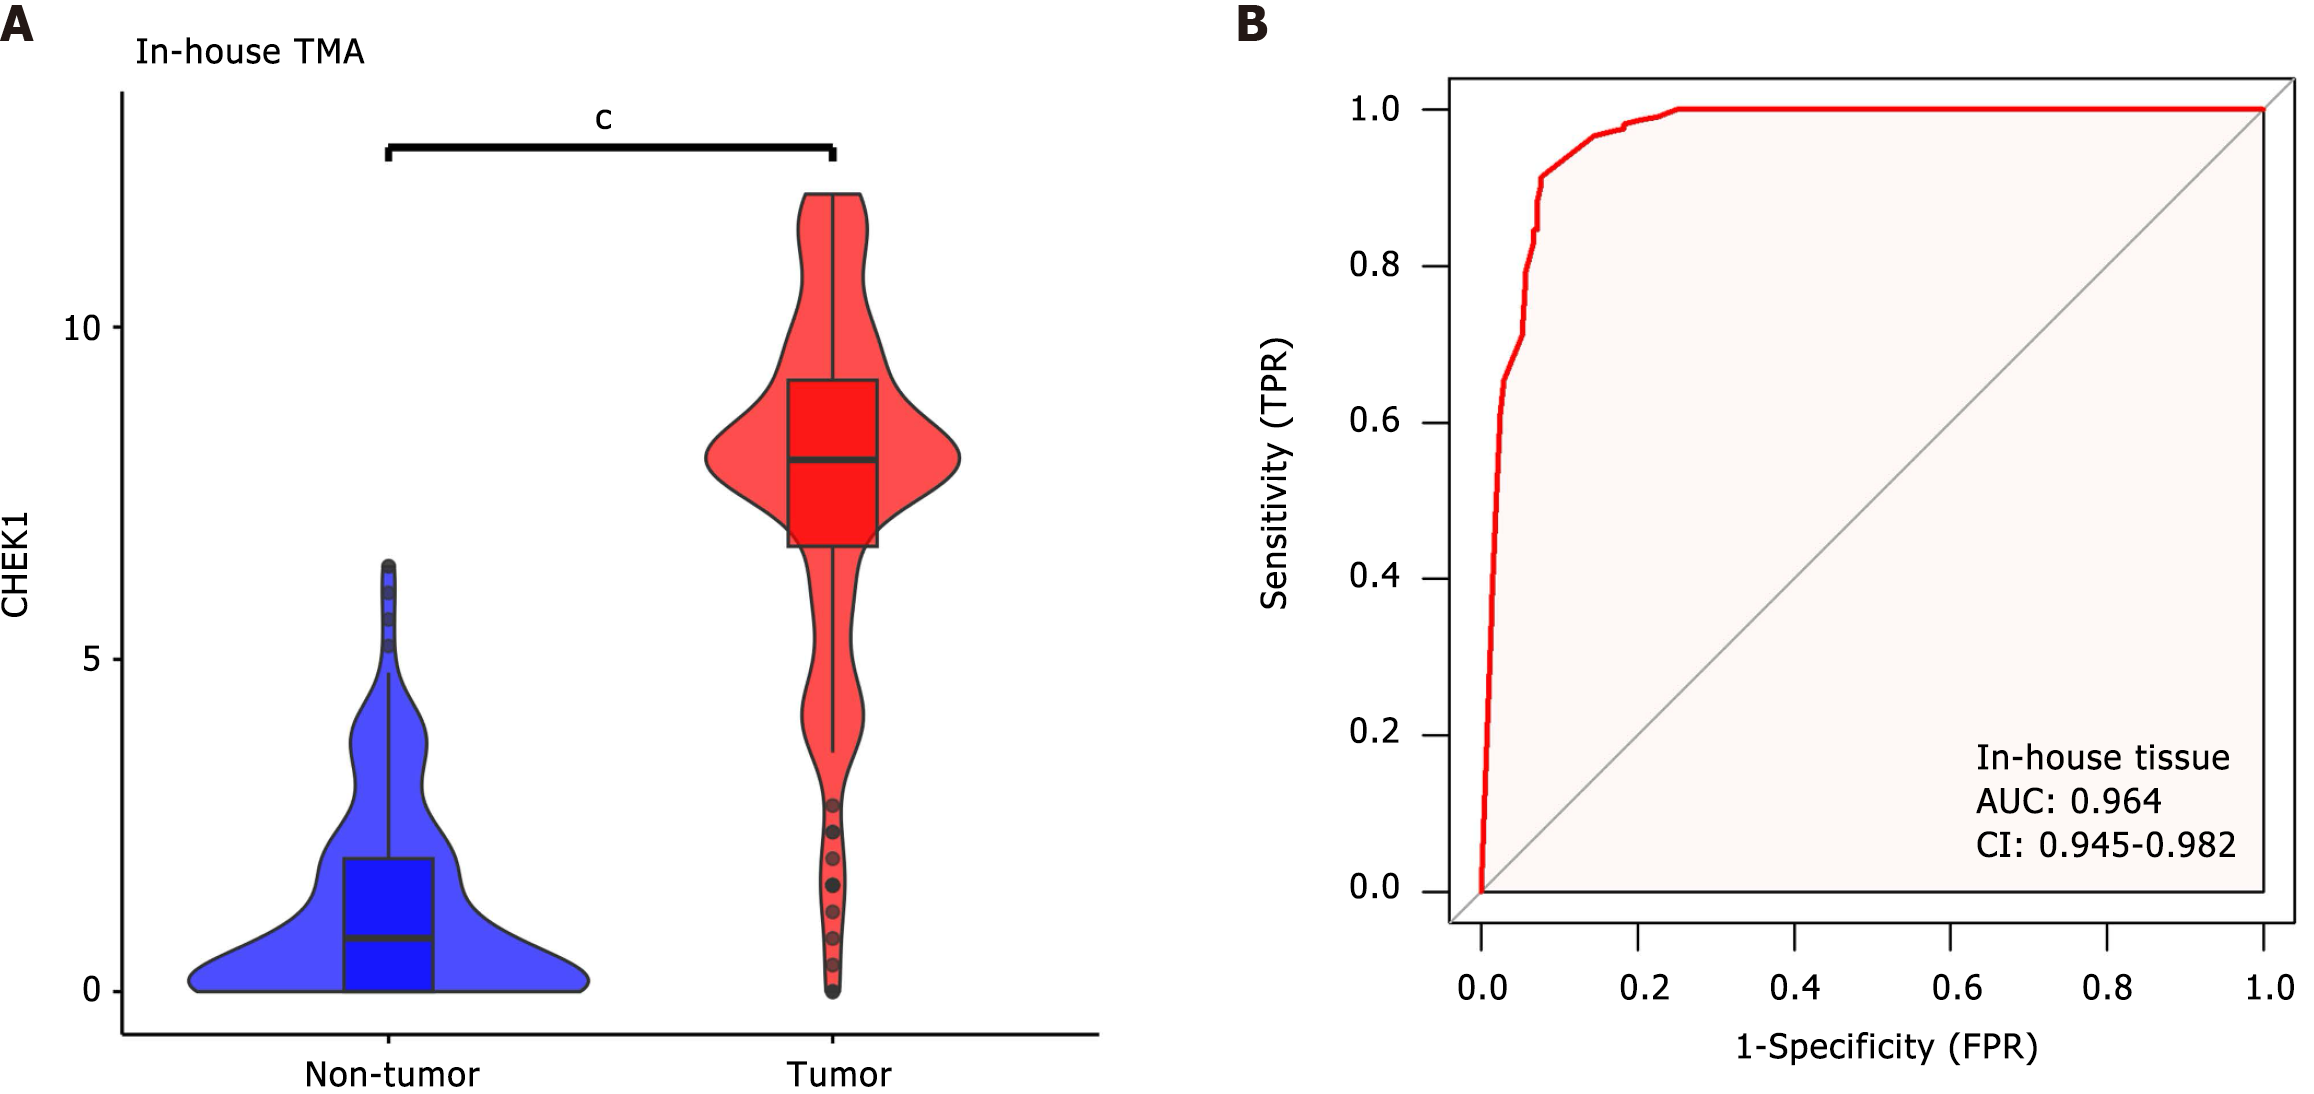
Figure 5 Internal tissue microarray analysis of checkpoint kinase 1 expression in colorectal cancer.
A: Violin plot; B: Receiver operating characteristic curve. TMA: Tissue microarray; TPR: True positive rate; FPR: False positive rate; AUC: Area under the curve.
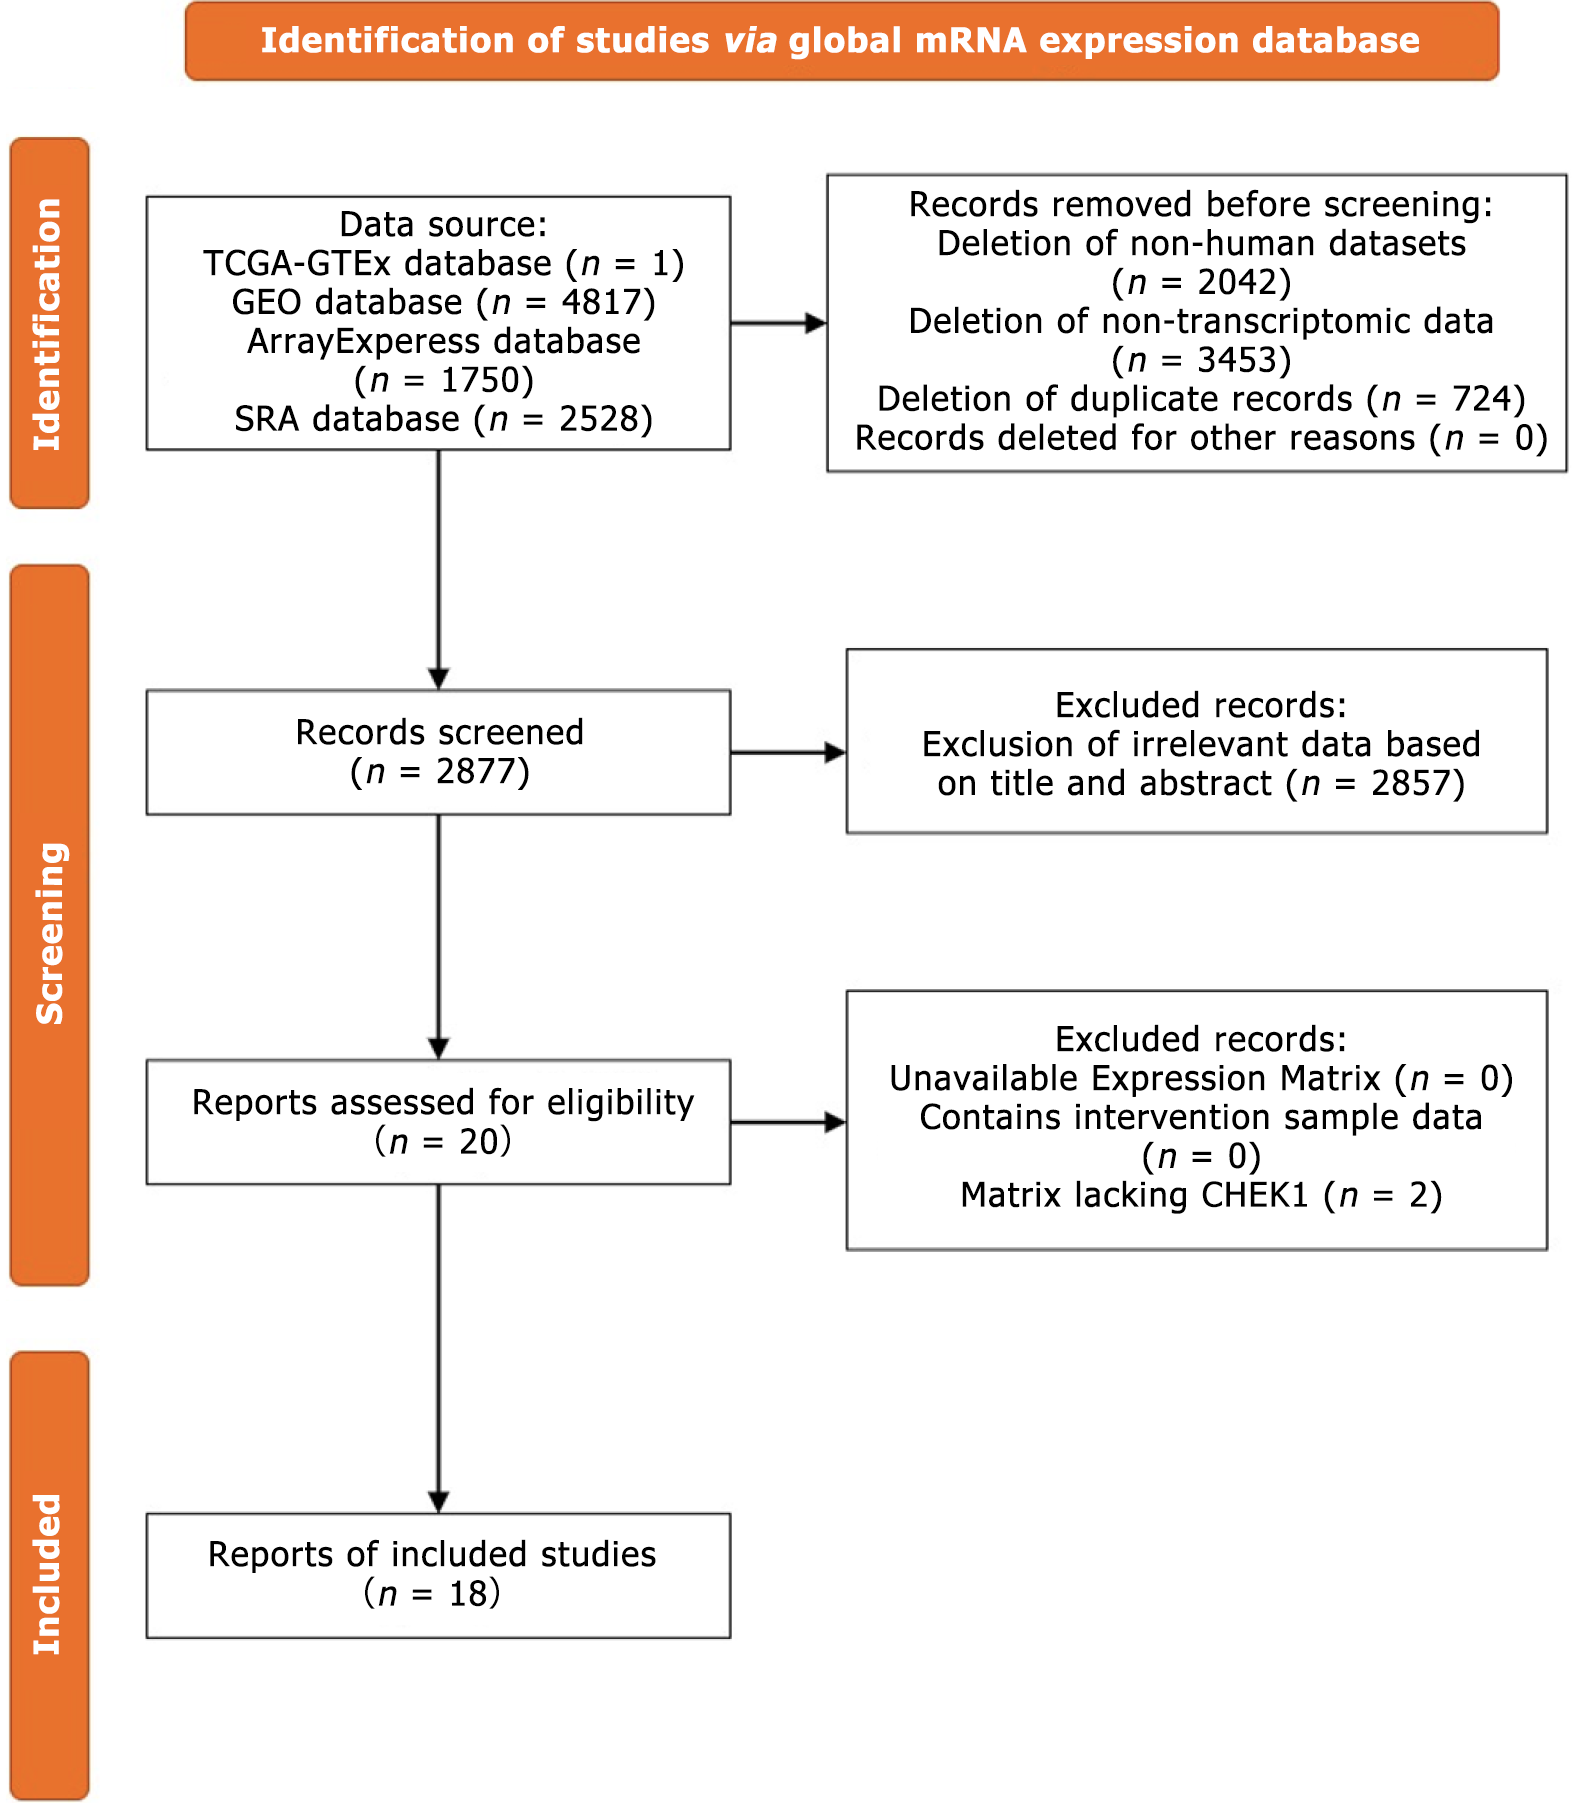
Figure 6 Flowchart of the selection process for the checkpoint kinase 1 mRNA dataset.
CHEK1: Checkpoint kinase 1.
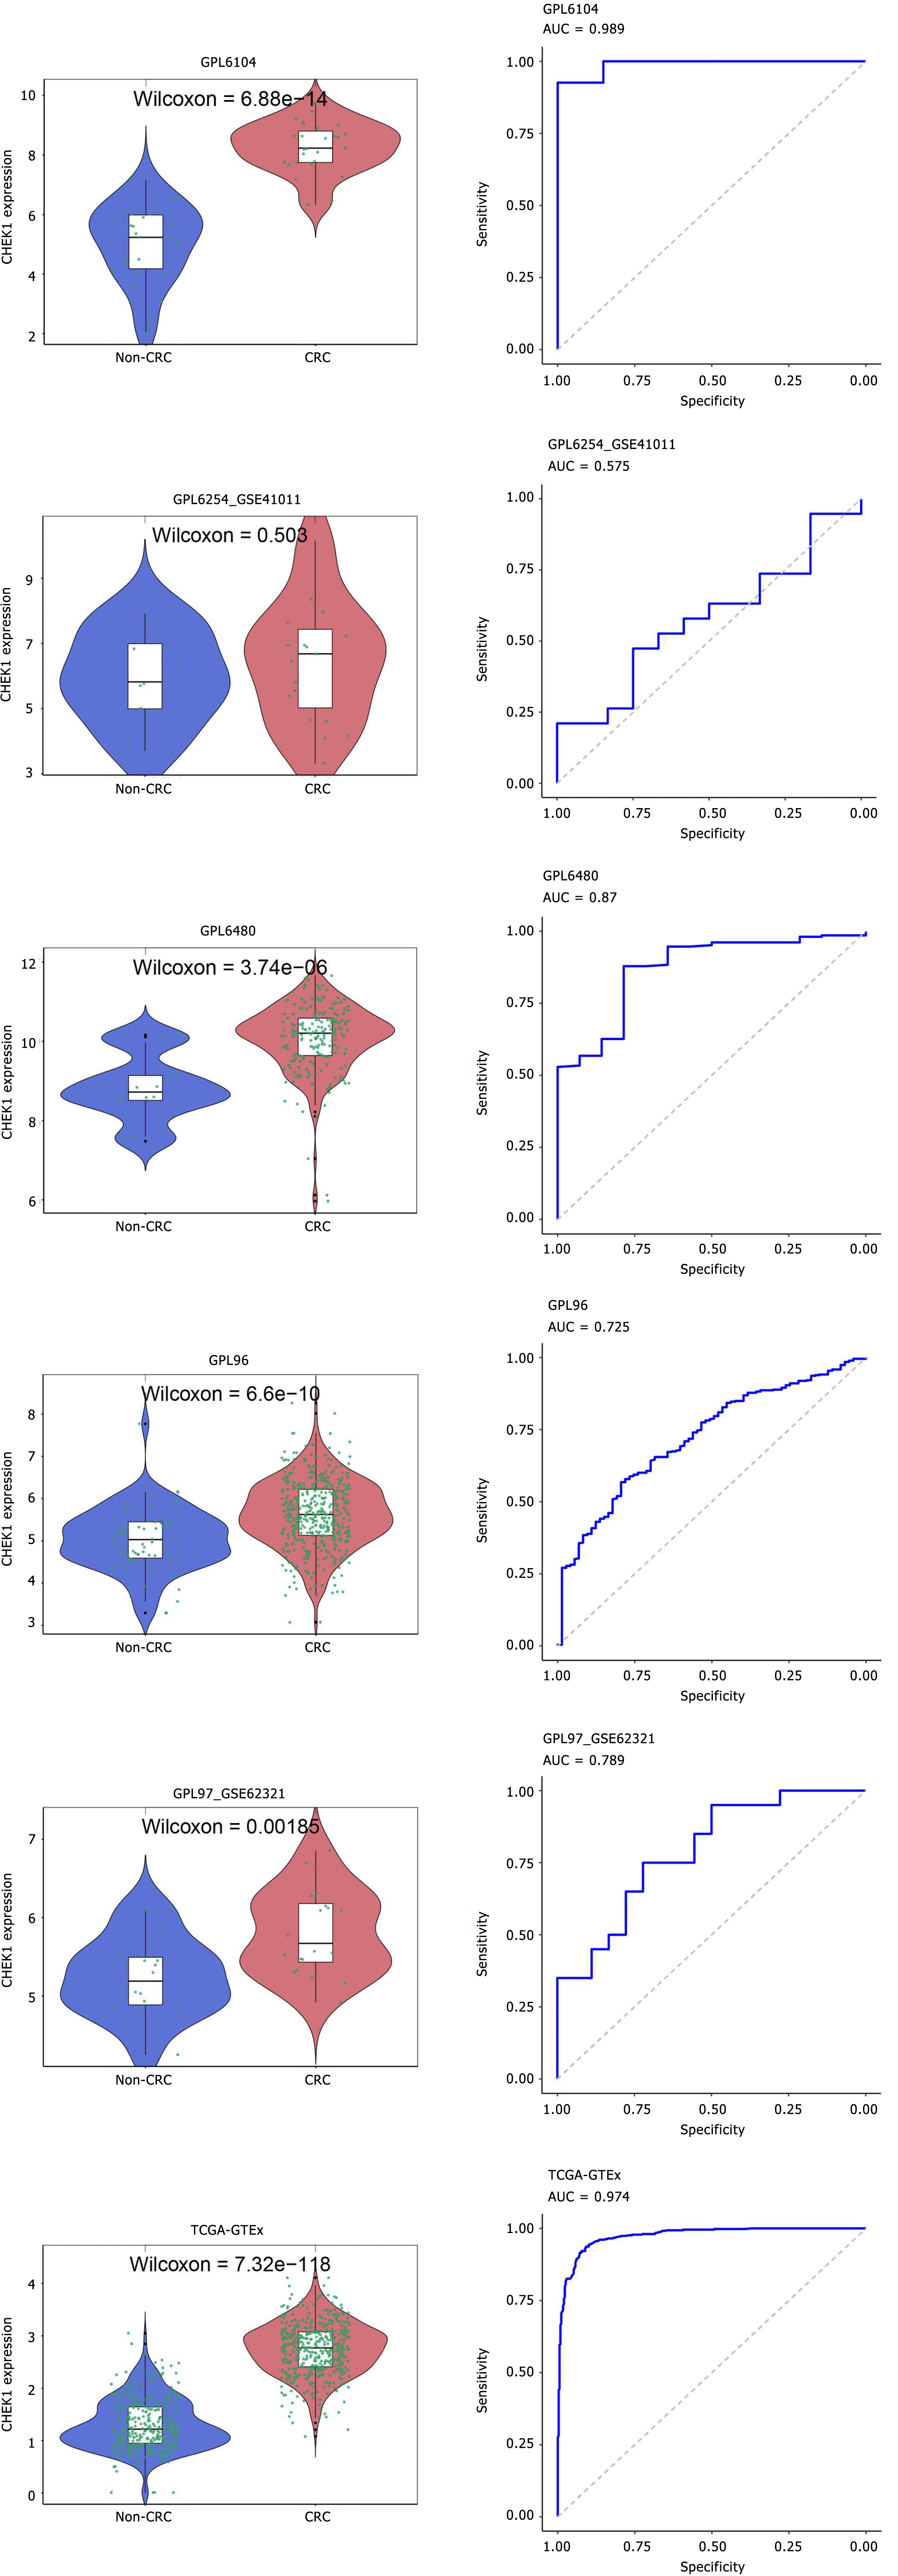
Figure 7 Differential expression of checkpoint kinase 1 in colorectal cancer samples vs non-colorectal cancer samples within the included datasets.
CRC: Colorectal cancer; AUC: Area under the curve.
Figure 8 Continued analysis of the differential expression of checkpoint kinase 1 in colorectal cancer samples compared to non-colorectal cancer samples within the included datasets.
CRC: Colorectal cancer; AUC: Area under the curve.
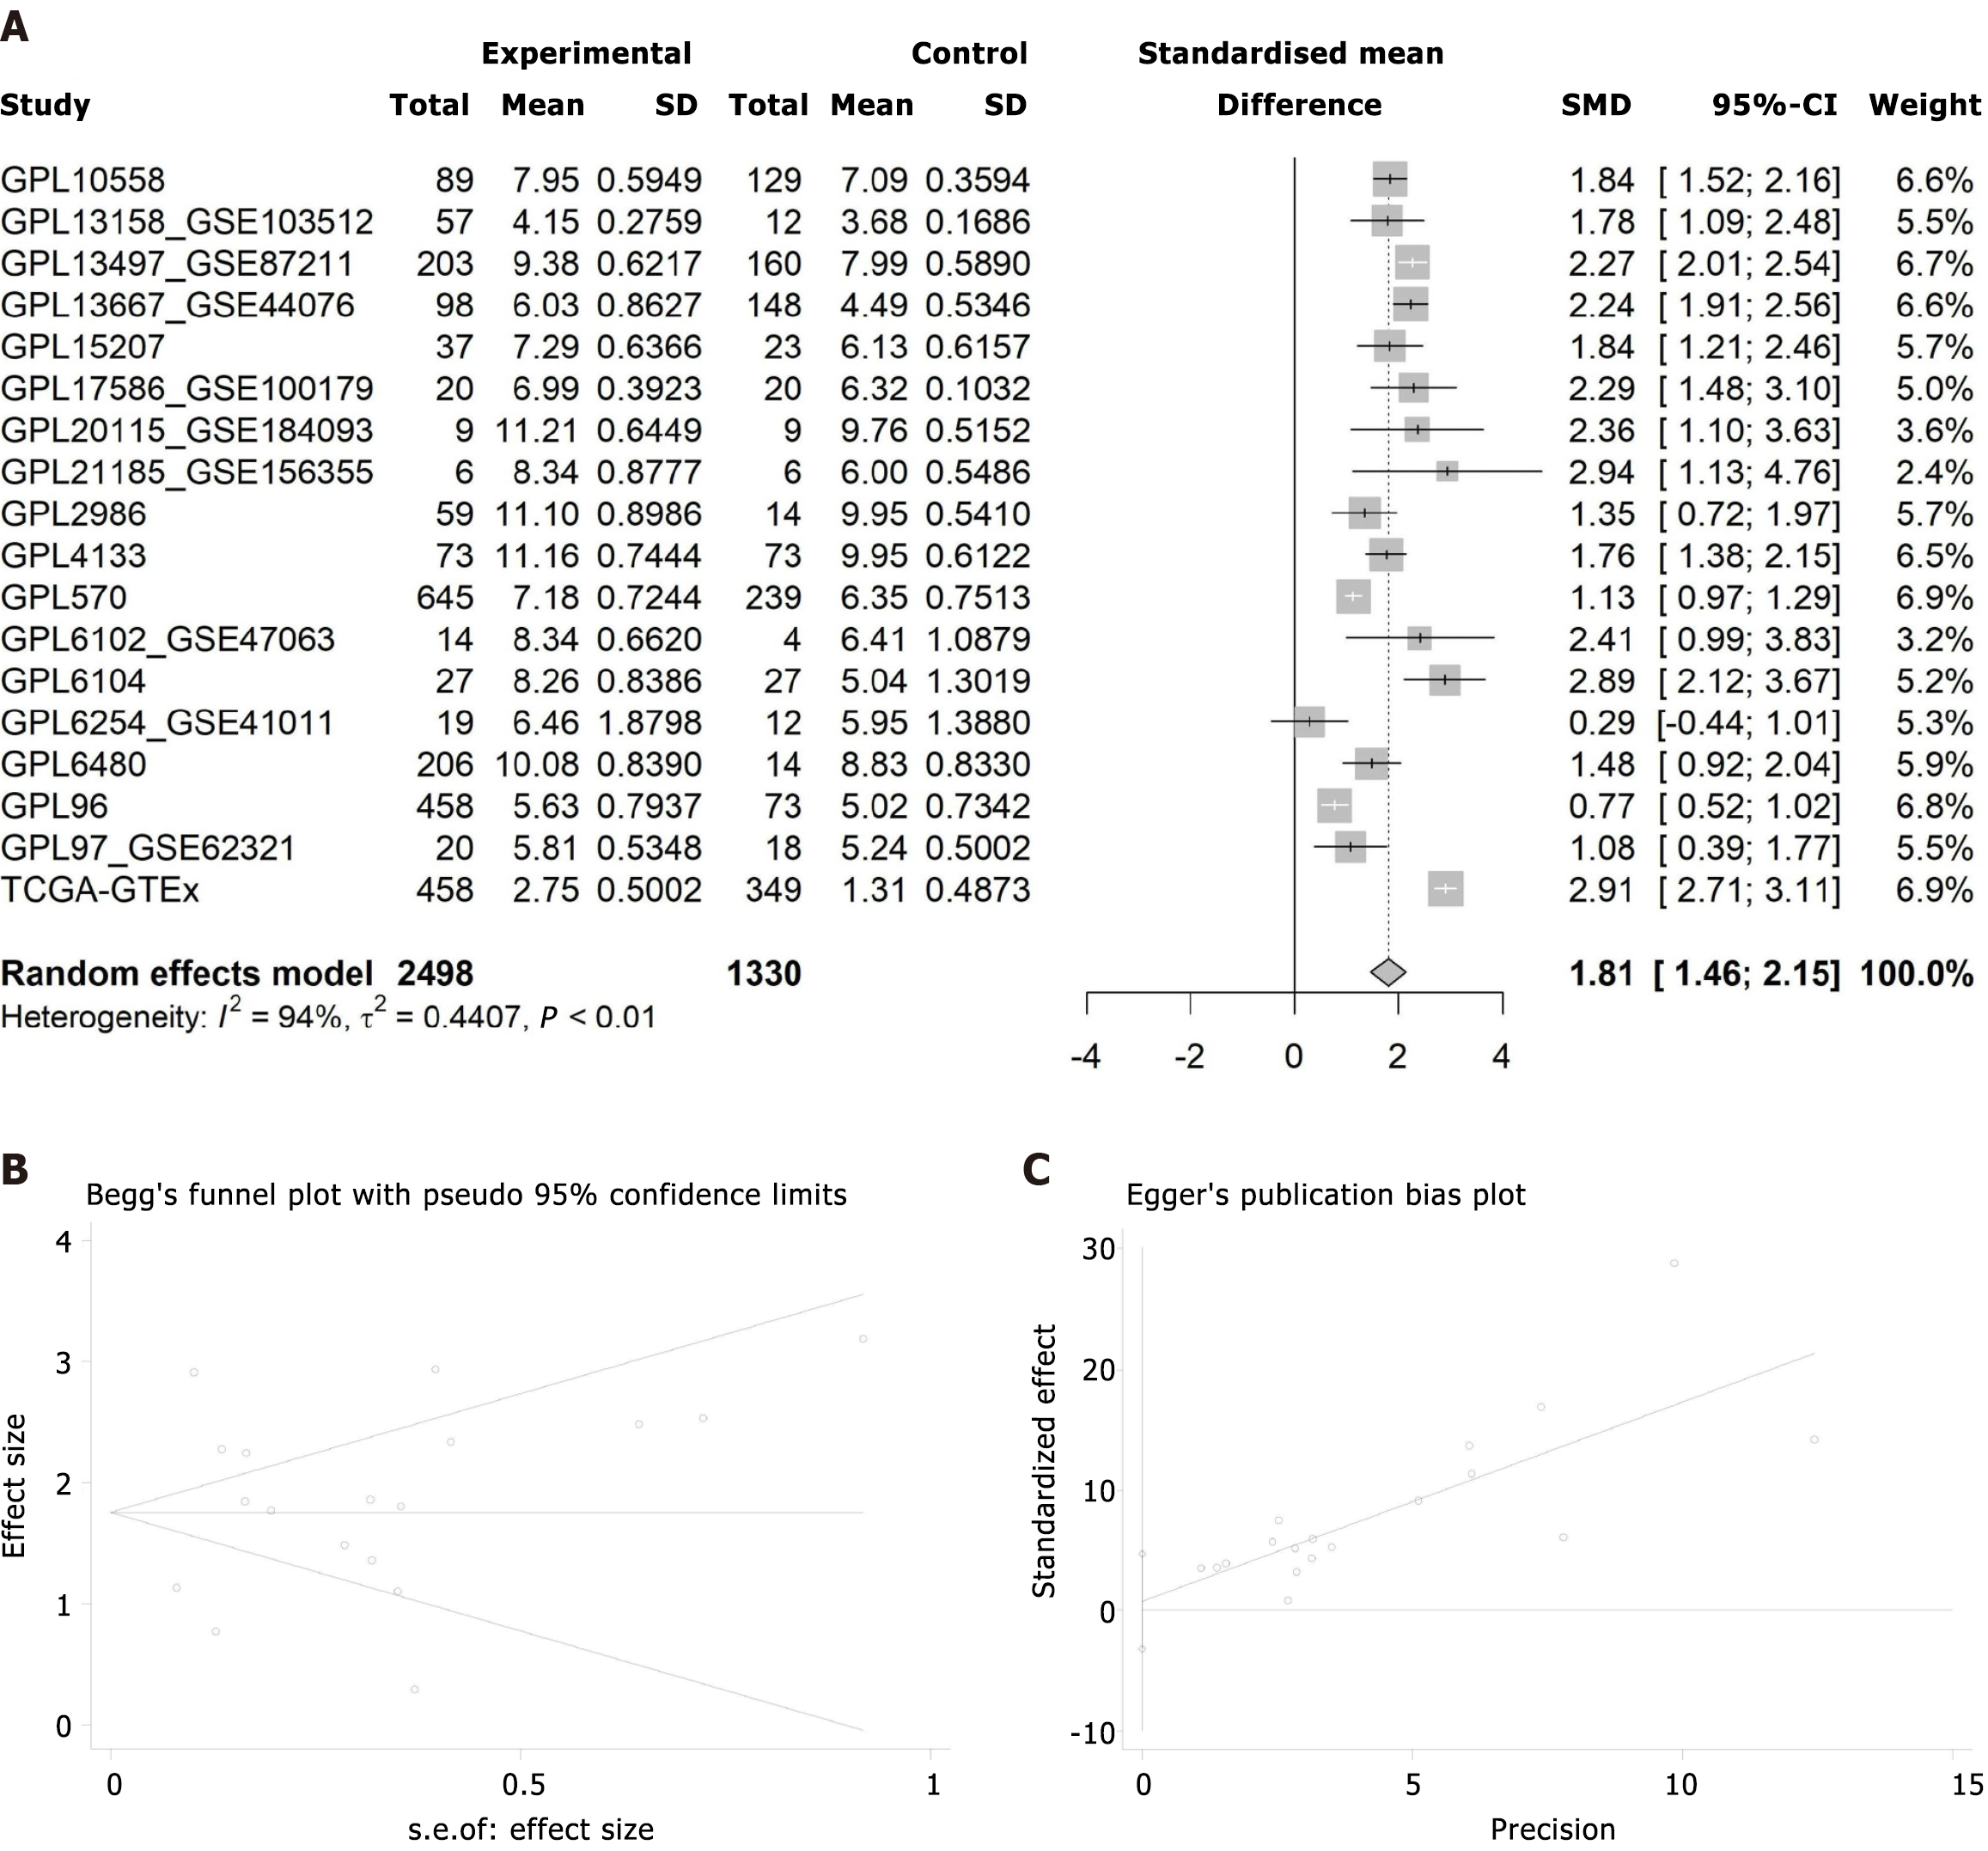
Figure 9 Comprehensive analysis of checkpoint kinase 1 expression in colorectal cancer.
A: Random effects model analysis; B: Begg's test for publication bias; C: Egger's test for publication bias.
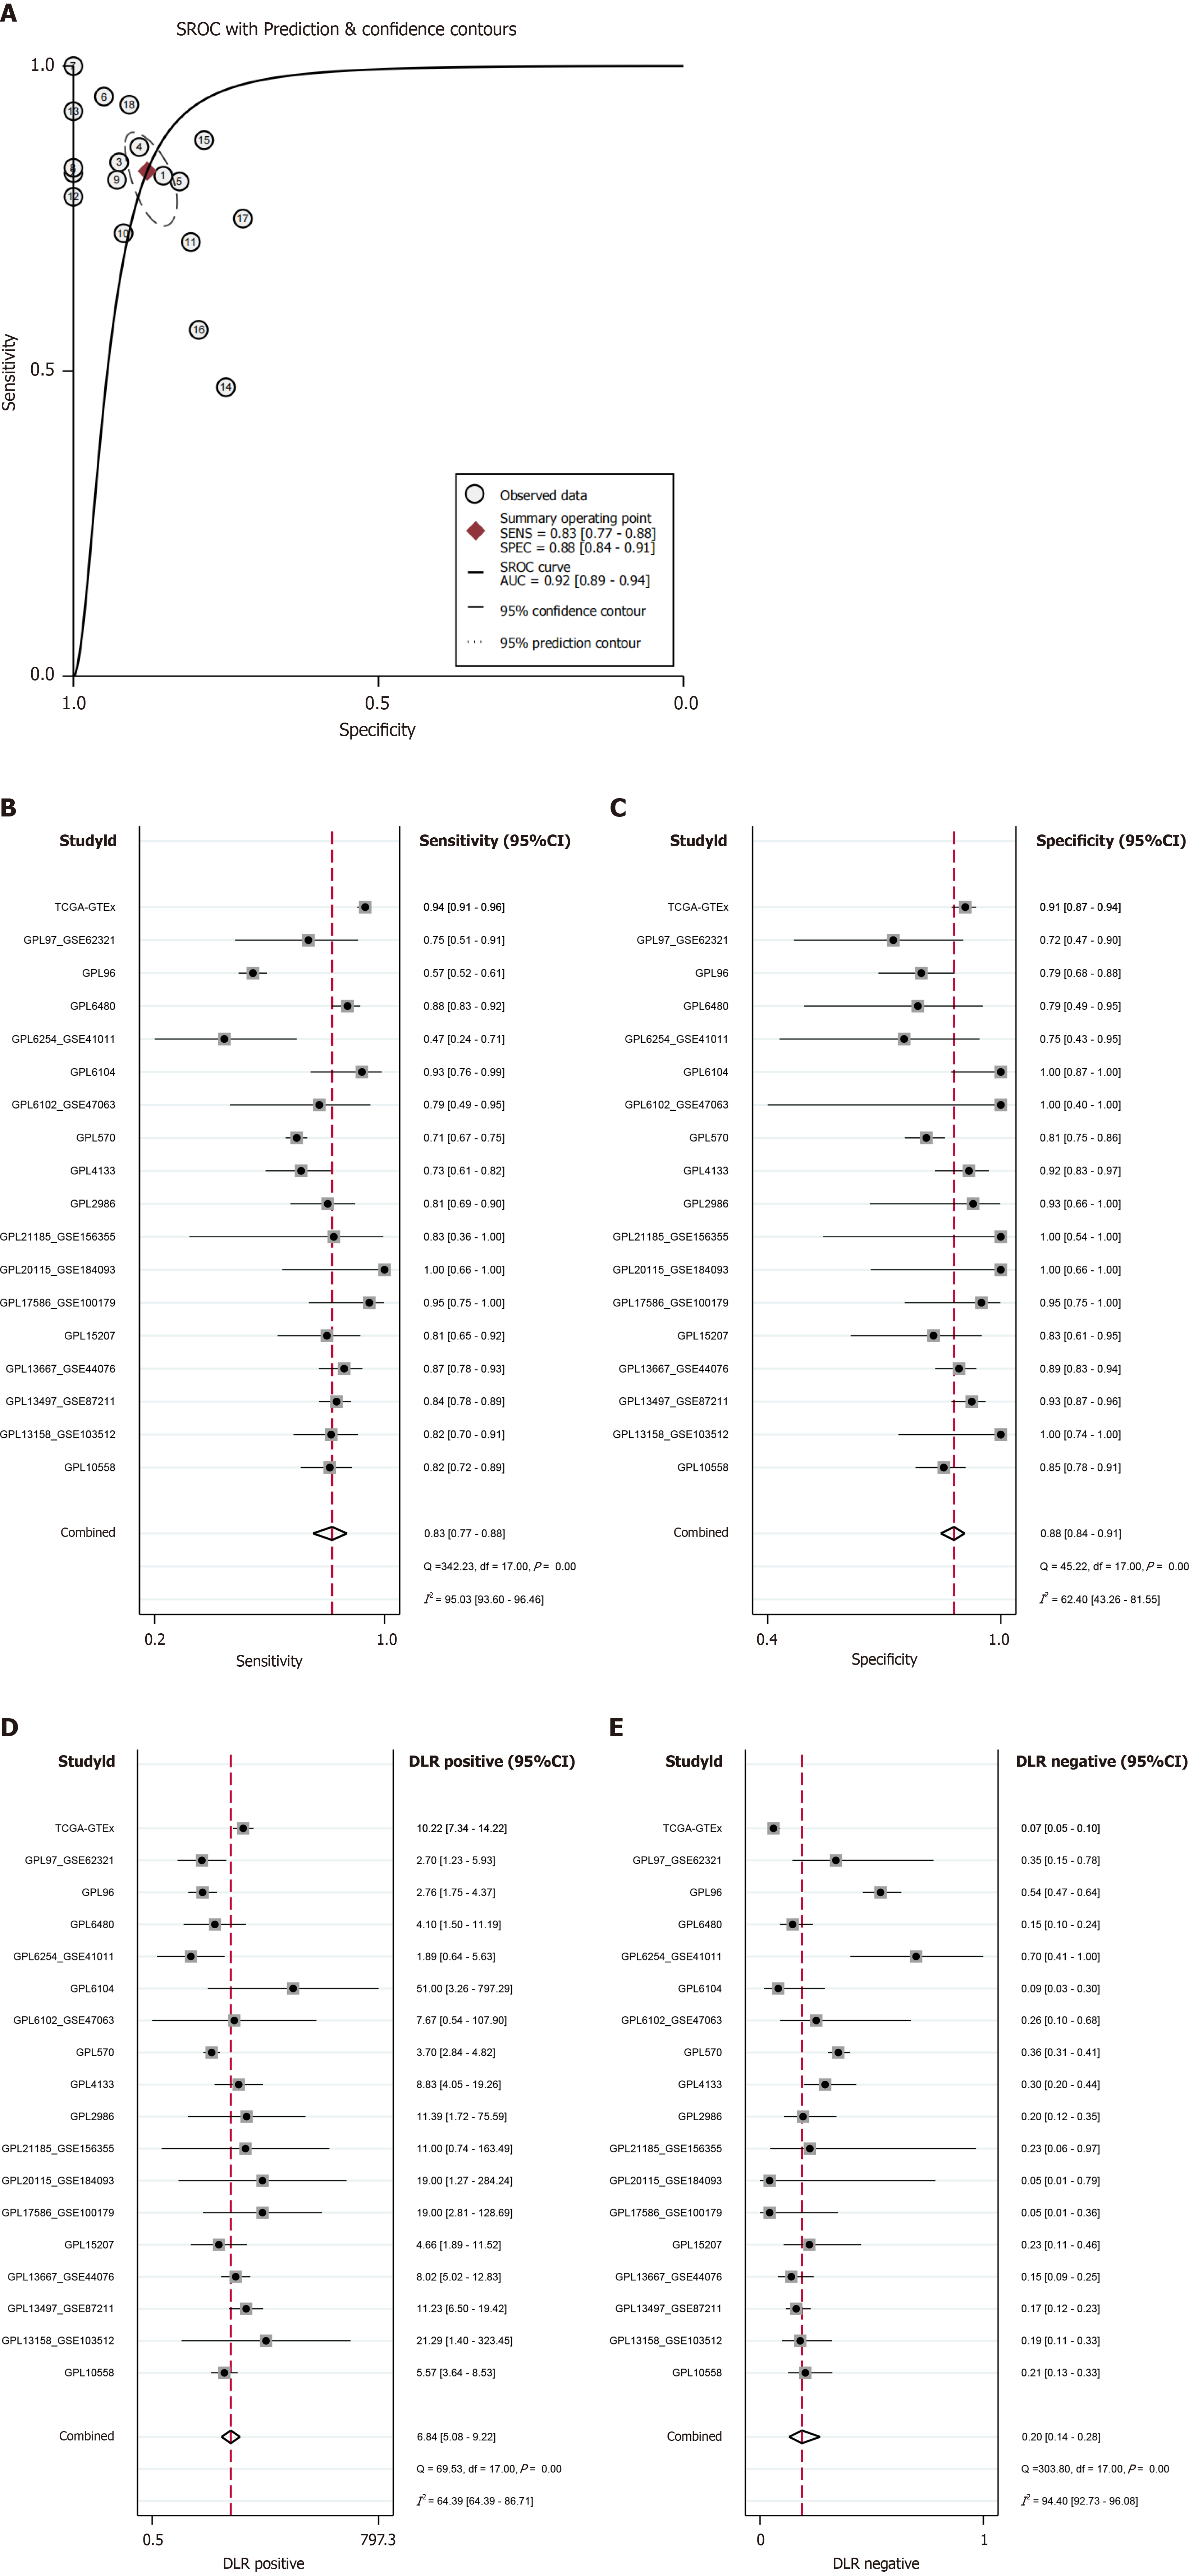
Figure 10 Quantitative evaluation of checkpoint kinase 1 characteristics in colorectal cancer.
A: Summary Receiver Operating Characteristic curve; B: Sensitivity; C: Specificity; D: Positive diagnostic likelihood ratio; E: Negative diagnostic likelihood ratio.
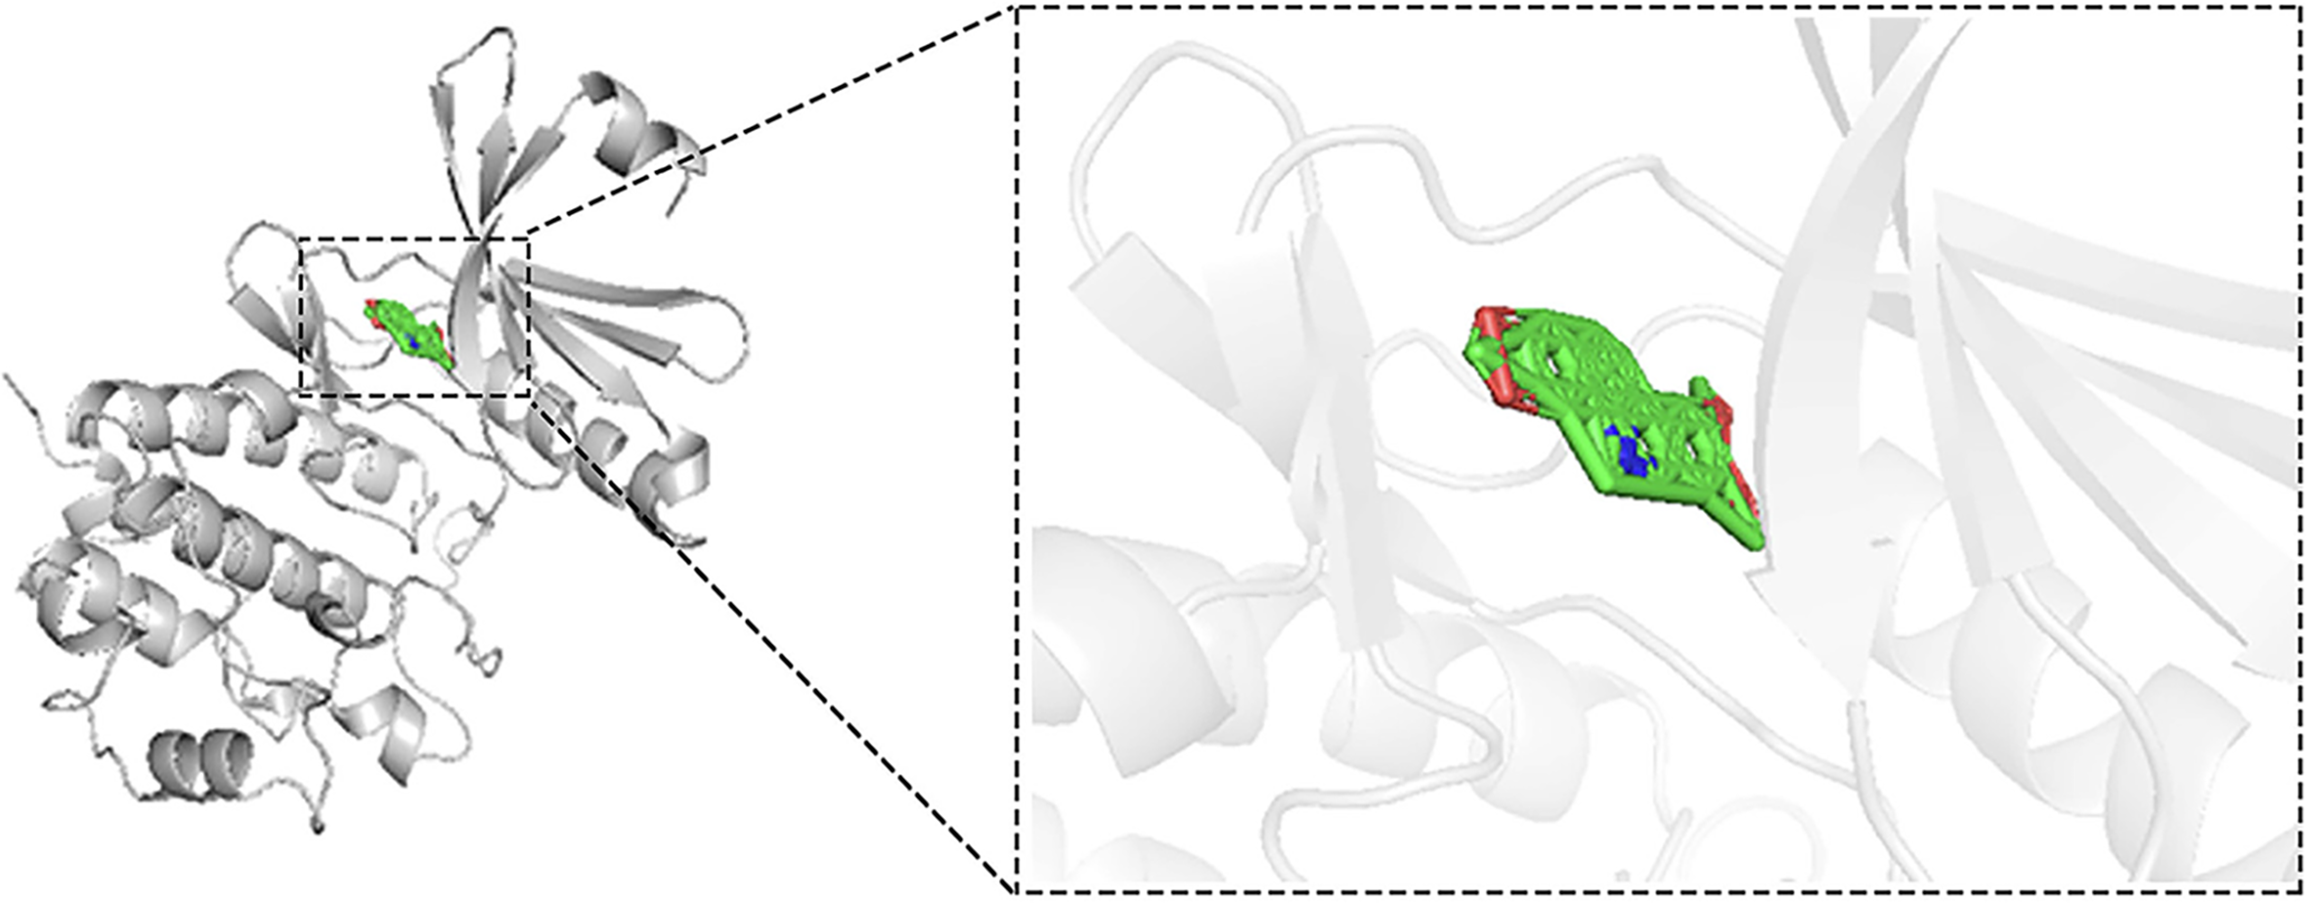
Figure 11 Molecular docking model of nitidine chloride with checkpoint kinase 1 (binding affinity = −11.
8 kcal/mol).
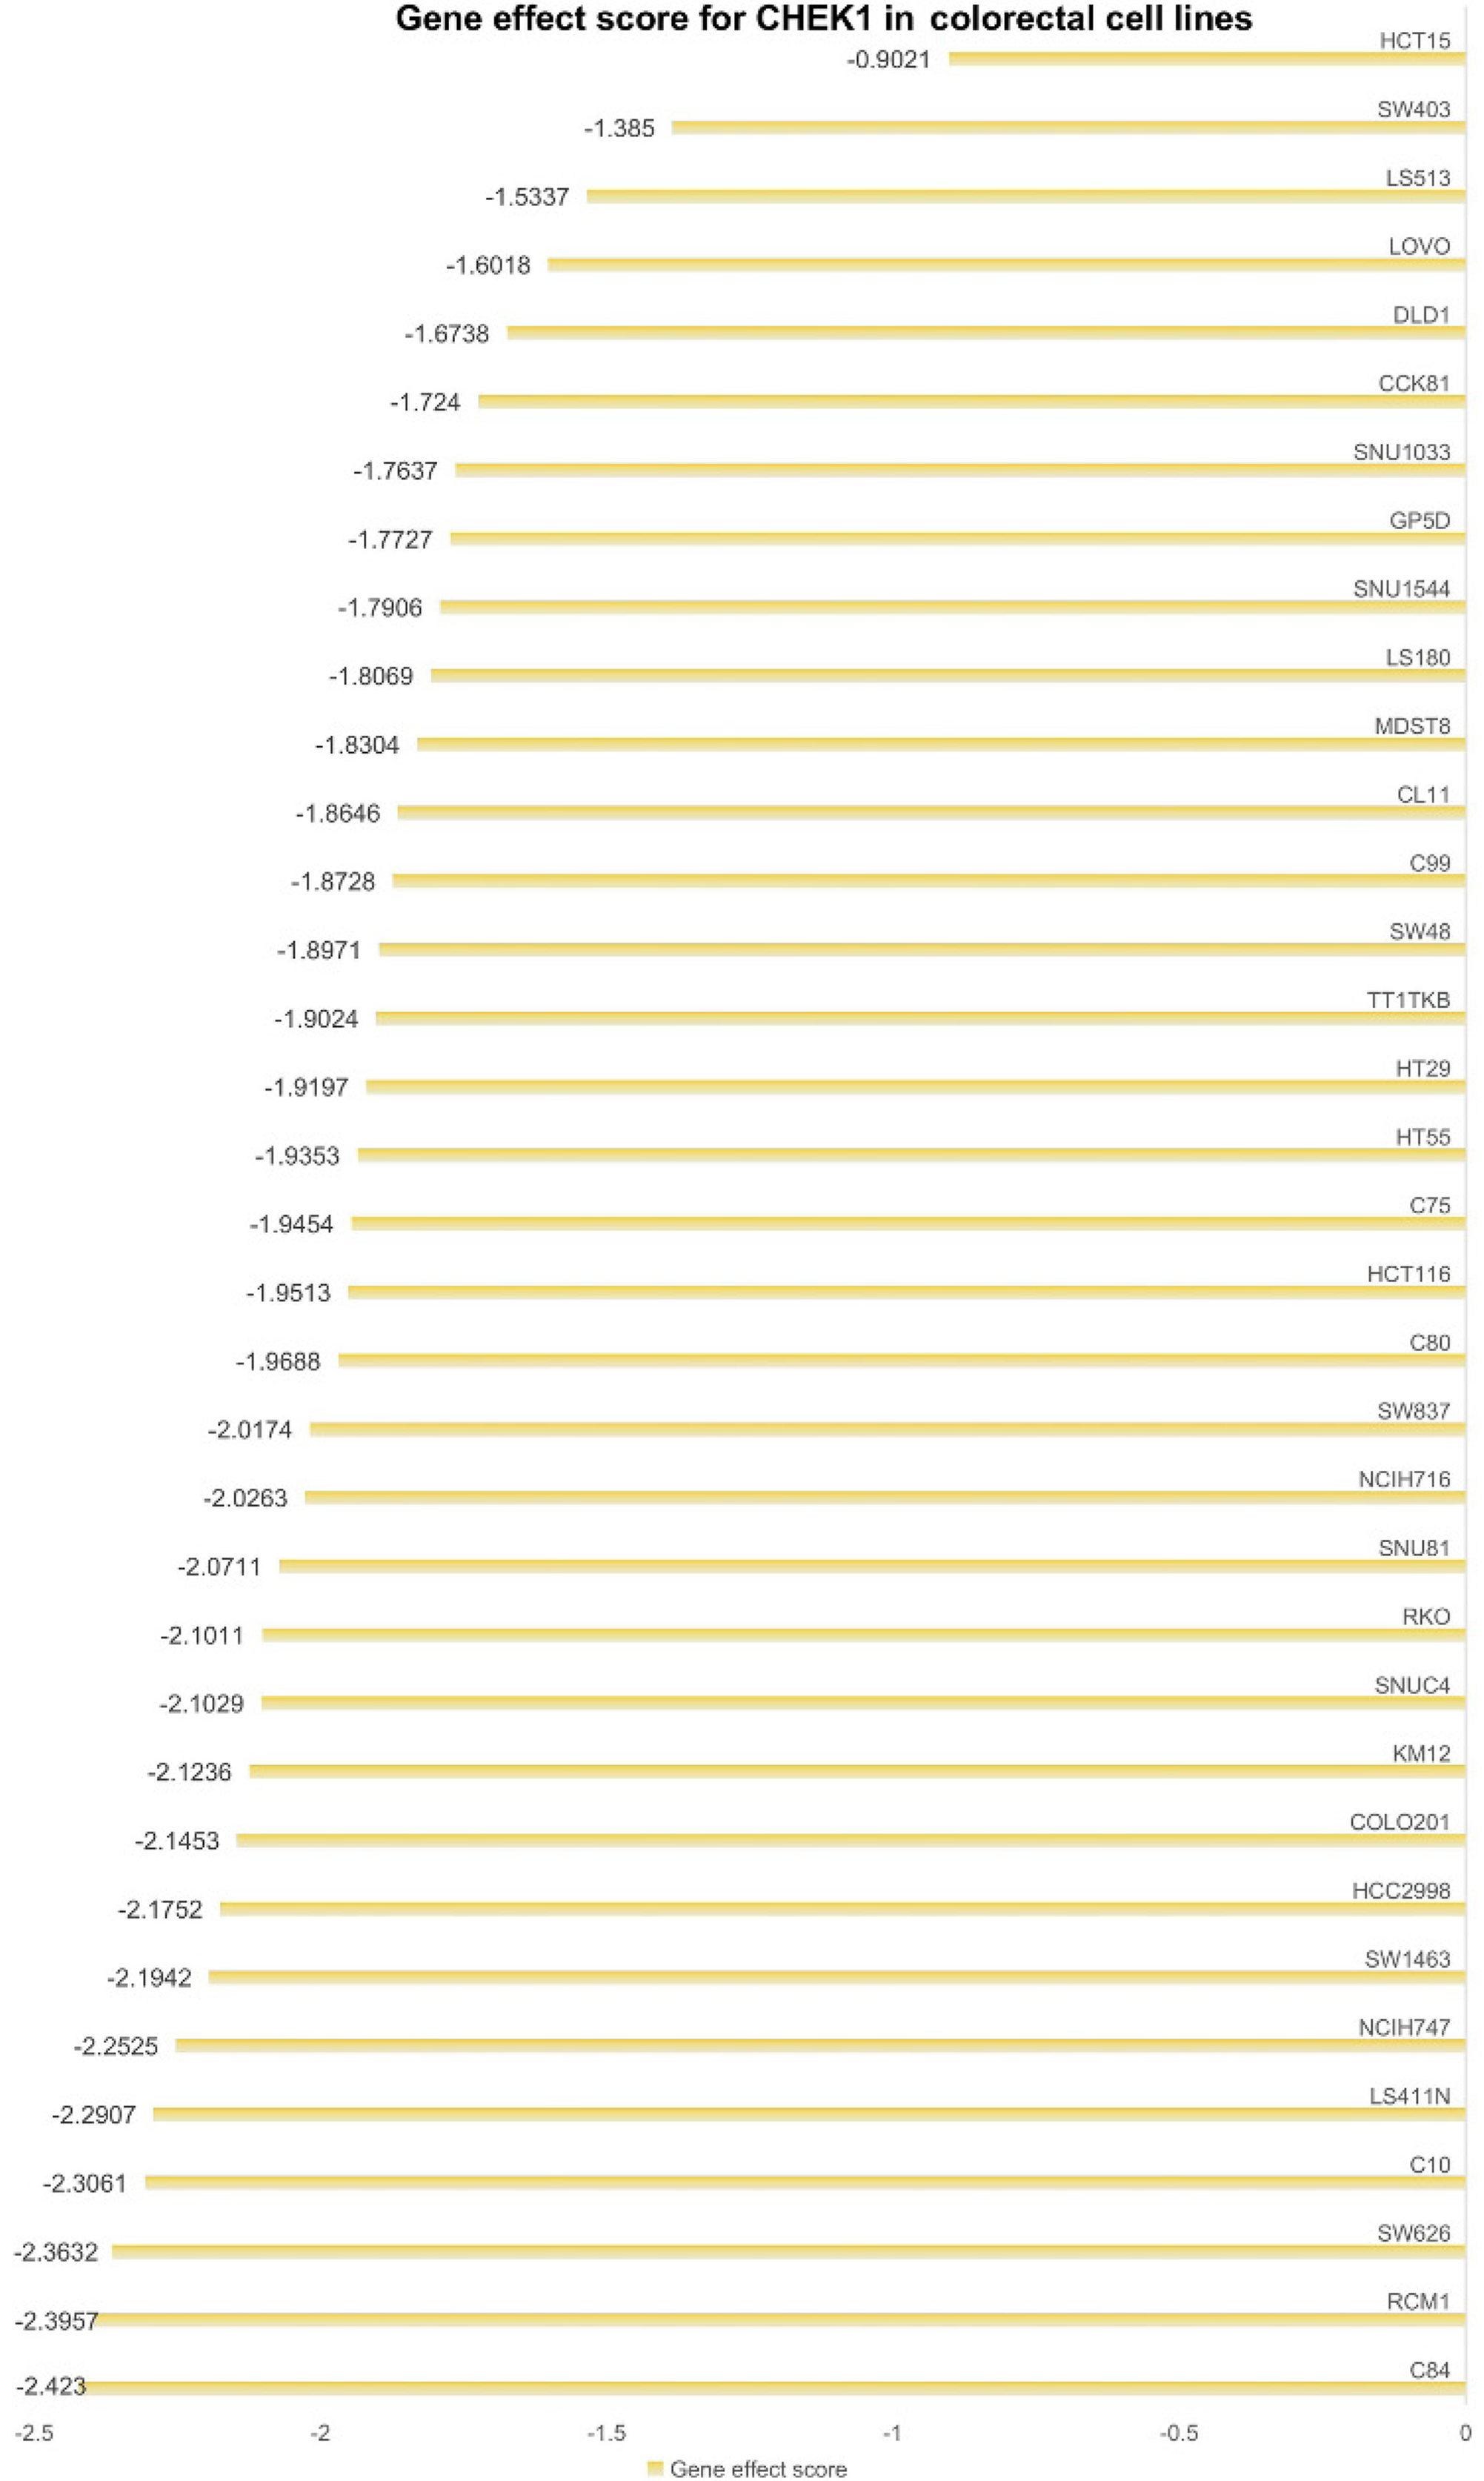
Figure 12 Impact of checkpoint kinase 1 on the proliferation of colorectal cancer cell lines.
Each row represents a colorectal cancer cell line, with corresponding gene effect scores at the end.
- Citation: Pang YY, Chen ZY, Zeng DT, Li DM, Li Q, Huang WY, Li B, Luo JY, Chi BT, Huang Q, Feng ZB, He RQ. Checkpoint kinase 1 in colorectal cancer: Upregulation of expression and promotion of cell proliferation. World J Clin Oncol 2025; 16(3): 101725
- URL: https://www.wjgnet.com/2218-4333/full/v16/i3/101725.htm
- DOI: https://dx.doi.org/10.5306/wjco.v16.i3.101725


