Copyright
©The Author(s) 2025.
World J Clin Oncol. Mar 24, 2025; 16(3): 101681
Published online Mar 24, 2025. doi: 10.5306/wjco.v16.i3.101681
Published online Mar 24, 2025. doi: 10.5306/wjco.v16.i3.101681
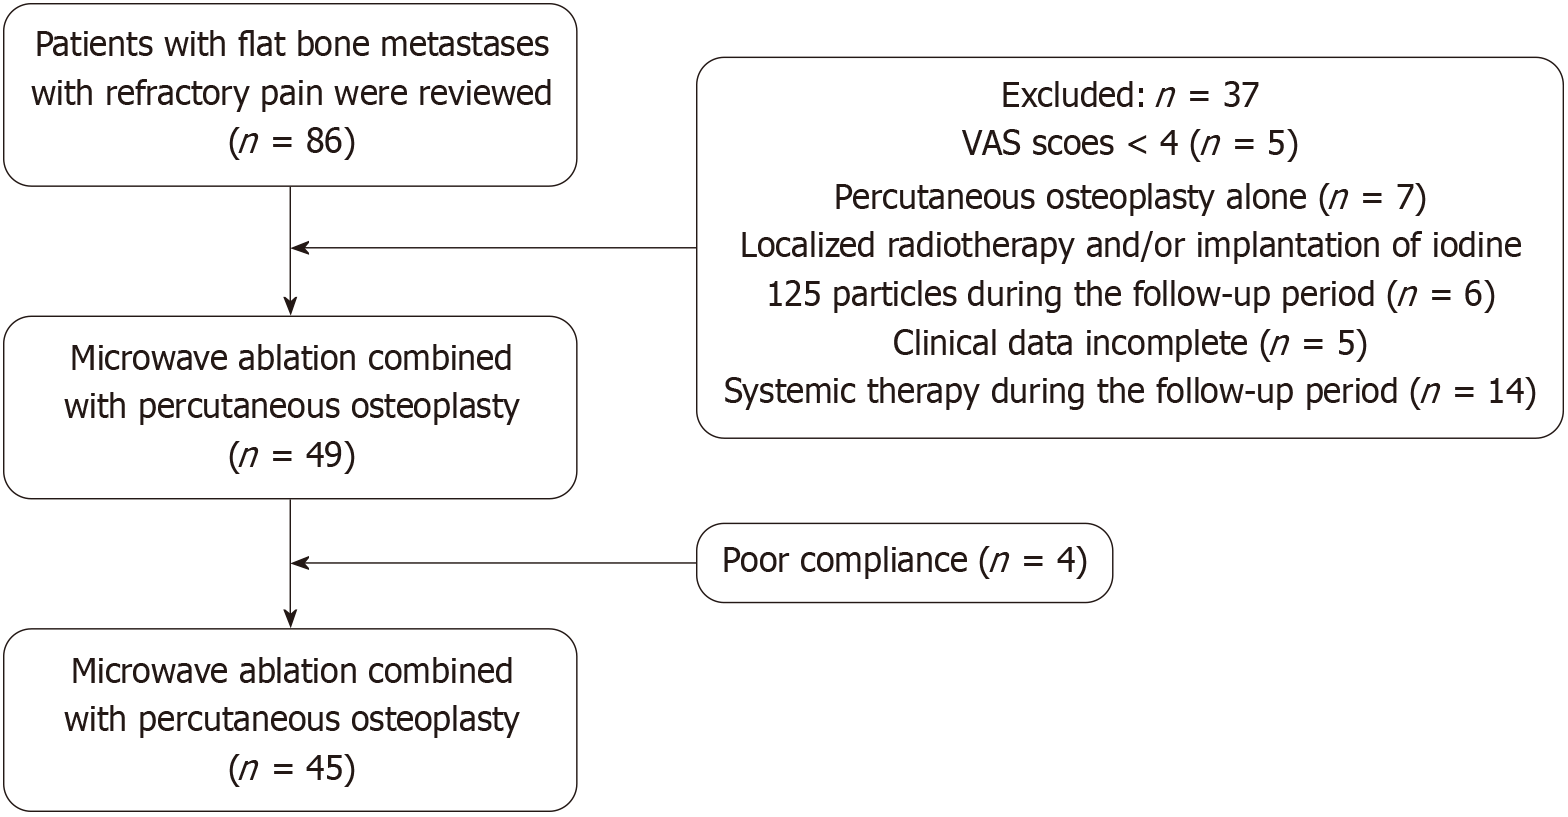
Figure 1 Schematic workflow diagram for this study.
VAS: Visual analog scale.
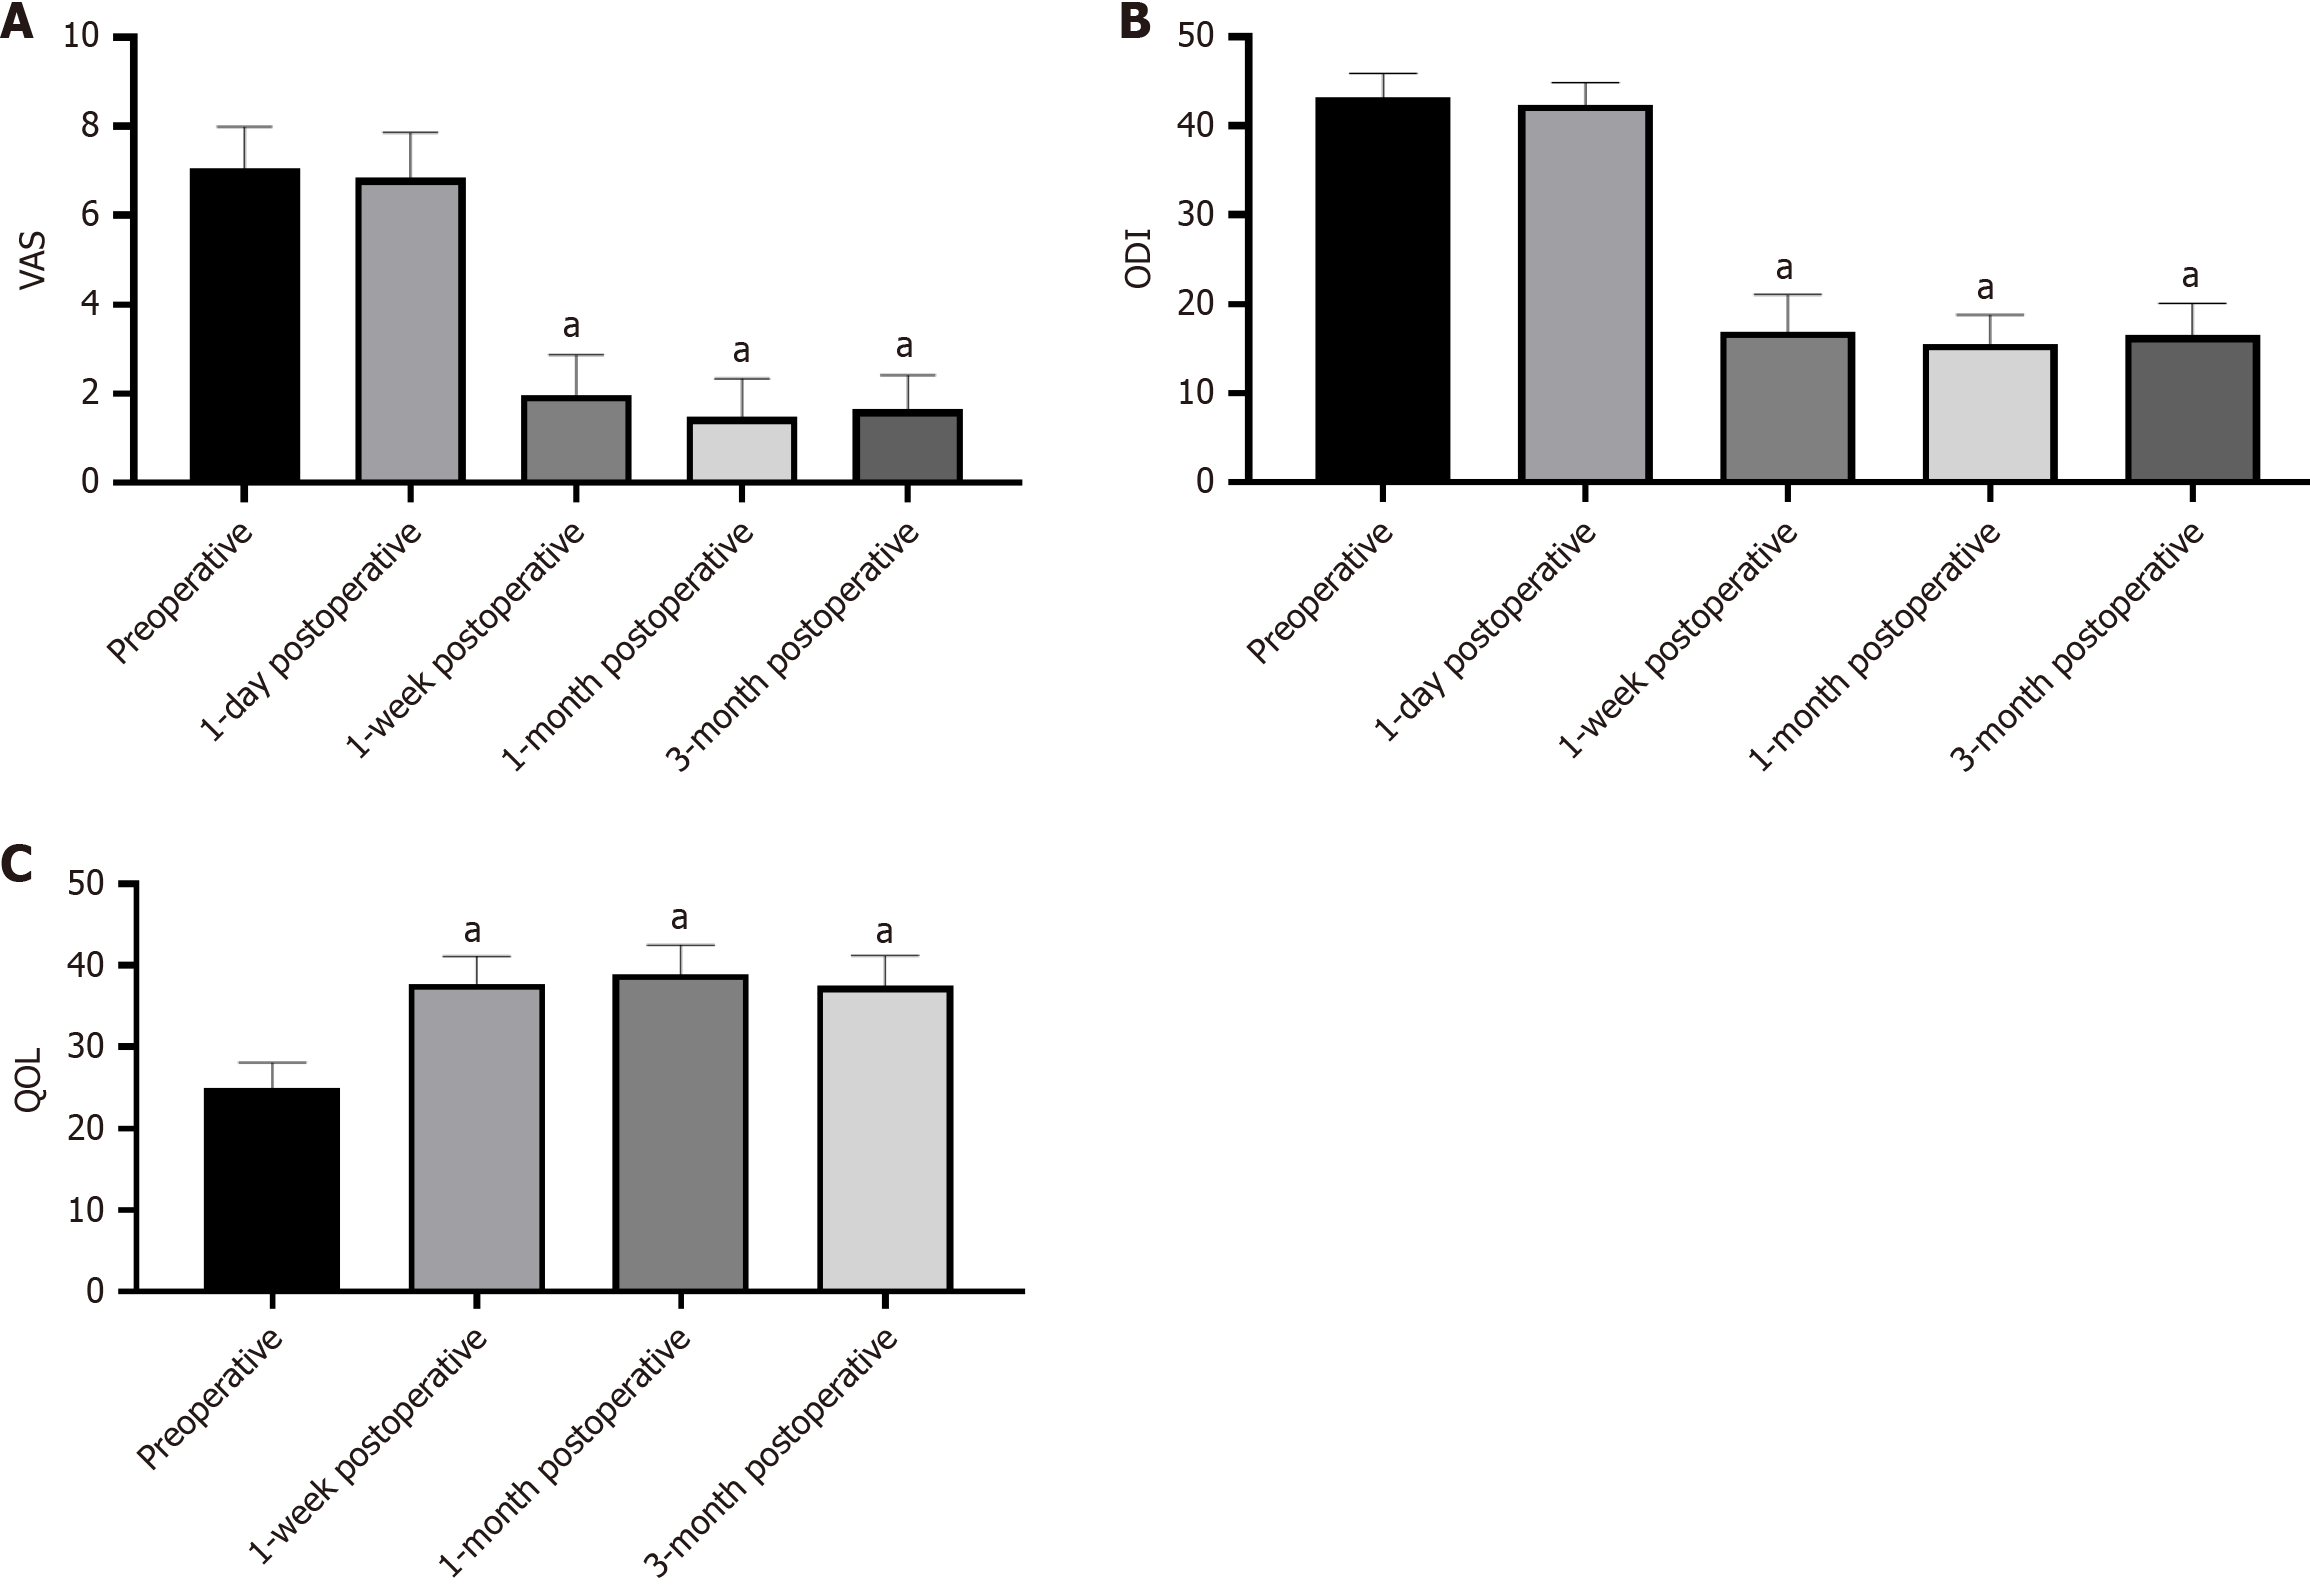
Figure 2 Changes in indexes before and after the procedure.
A: Visual analog scale before and after the procedure; B: Oswestry disability index; C: Quality of life. VAS: Visual analog scale; ODI: Oswestry disability index; QOL: Quality of life. aP < 0.01.
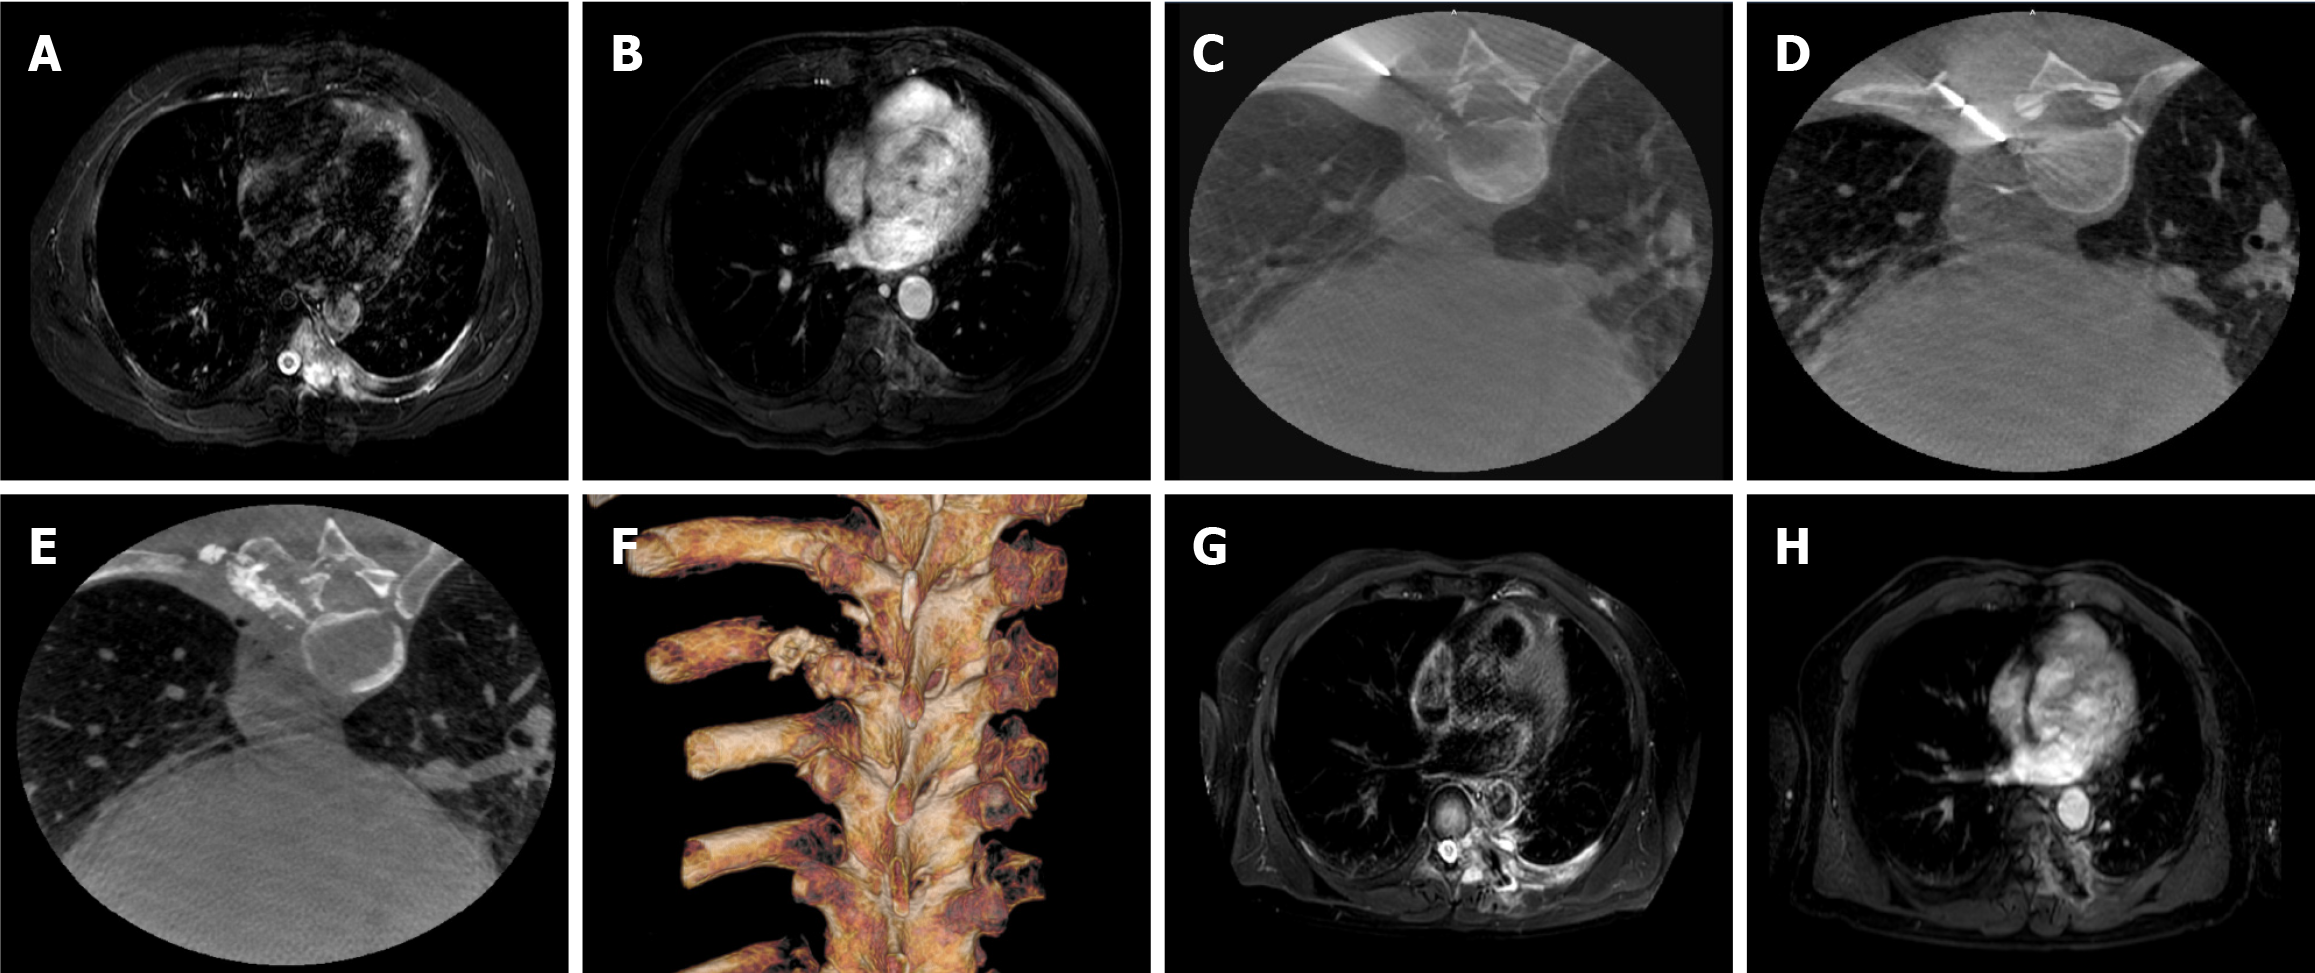
Figure 3 Changes in the lesion before and after the procedure in a patient with lung cancer and left 7th rib metastasis.
A and B: Magnetic resonance imaging (MRI) showing a metastatic tumor in the left 7th rib, with the largest diameter measuring 53 cm; C: C-arm computed tomography (CT) reconstruction showing the puncture path of the bone puncture needle; D: The microwave ablation needle reaches the lesion for ablation treatment; E: C-arm CT reconstruction showing the distribution of bone cement; F: Three-dimensional reconstruction of C-arm CT showing the distribution of bone cement; G and H: Follow-up MRI at 3 months post-procedure showing that most of the target lesion area does not exhibit significant enhancement, with the largest diameter measuring 53 cm.
- Citation: Lin ZP, Zou XG, Huang DB, Chen Y, Lin JW, Li XQ, Zhang J. Efficacy and safety of C-arm computed tomography-guided microwave ablation with percutaneous osteoplasty for flat bone metastases. World J Clin Oncol 2025; 16(3): 101681
- URL: https://www.wjgnet.com/2218-4333/full/v16/i3/101681.htm
- DOI: https://dx.doi.org/10.5306/wjco.v16.i3.101681


