Copyright
©The Author(s) 2025.
World J Clin Oncol. Feb 24, 2025; 16(2): 101611
Published online Feb 24, 2025. doi: 10.5306/wjco.v16.i2.101611
Published online Feb 24, 2025. doi: 10.5306/wjco.v16.i2.101611
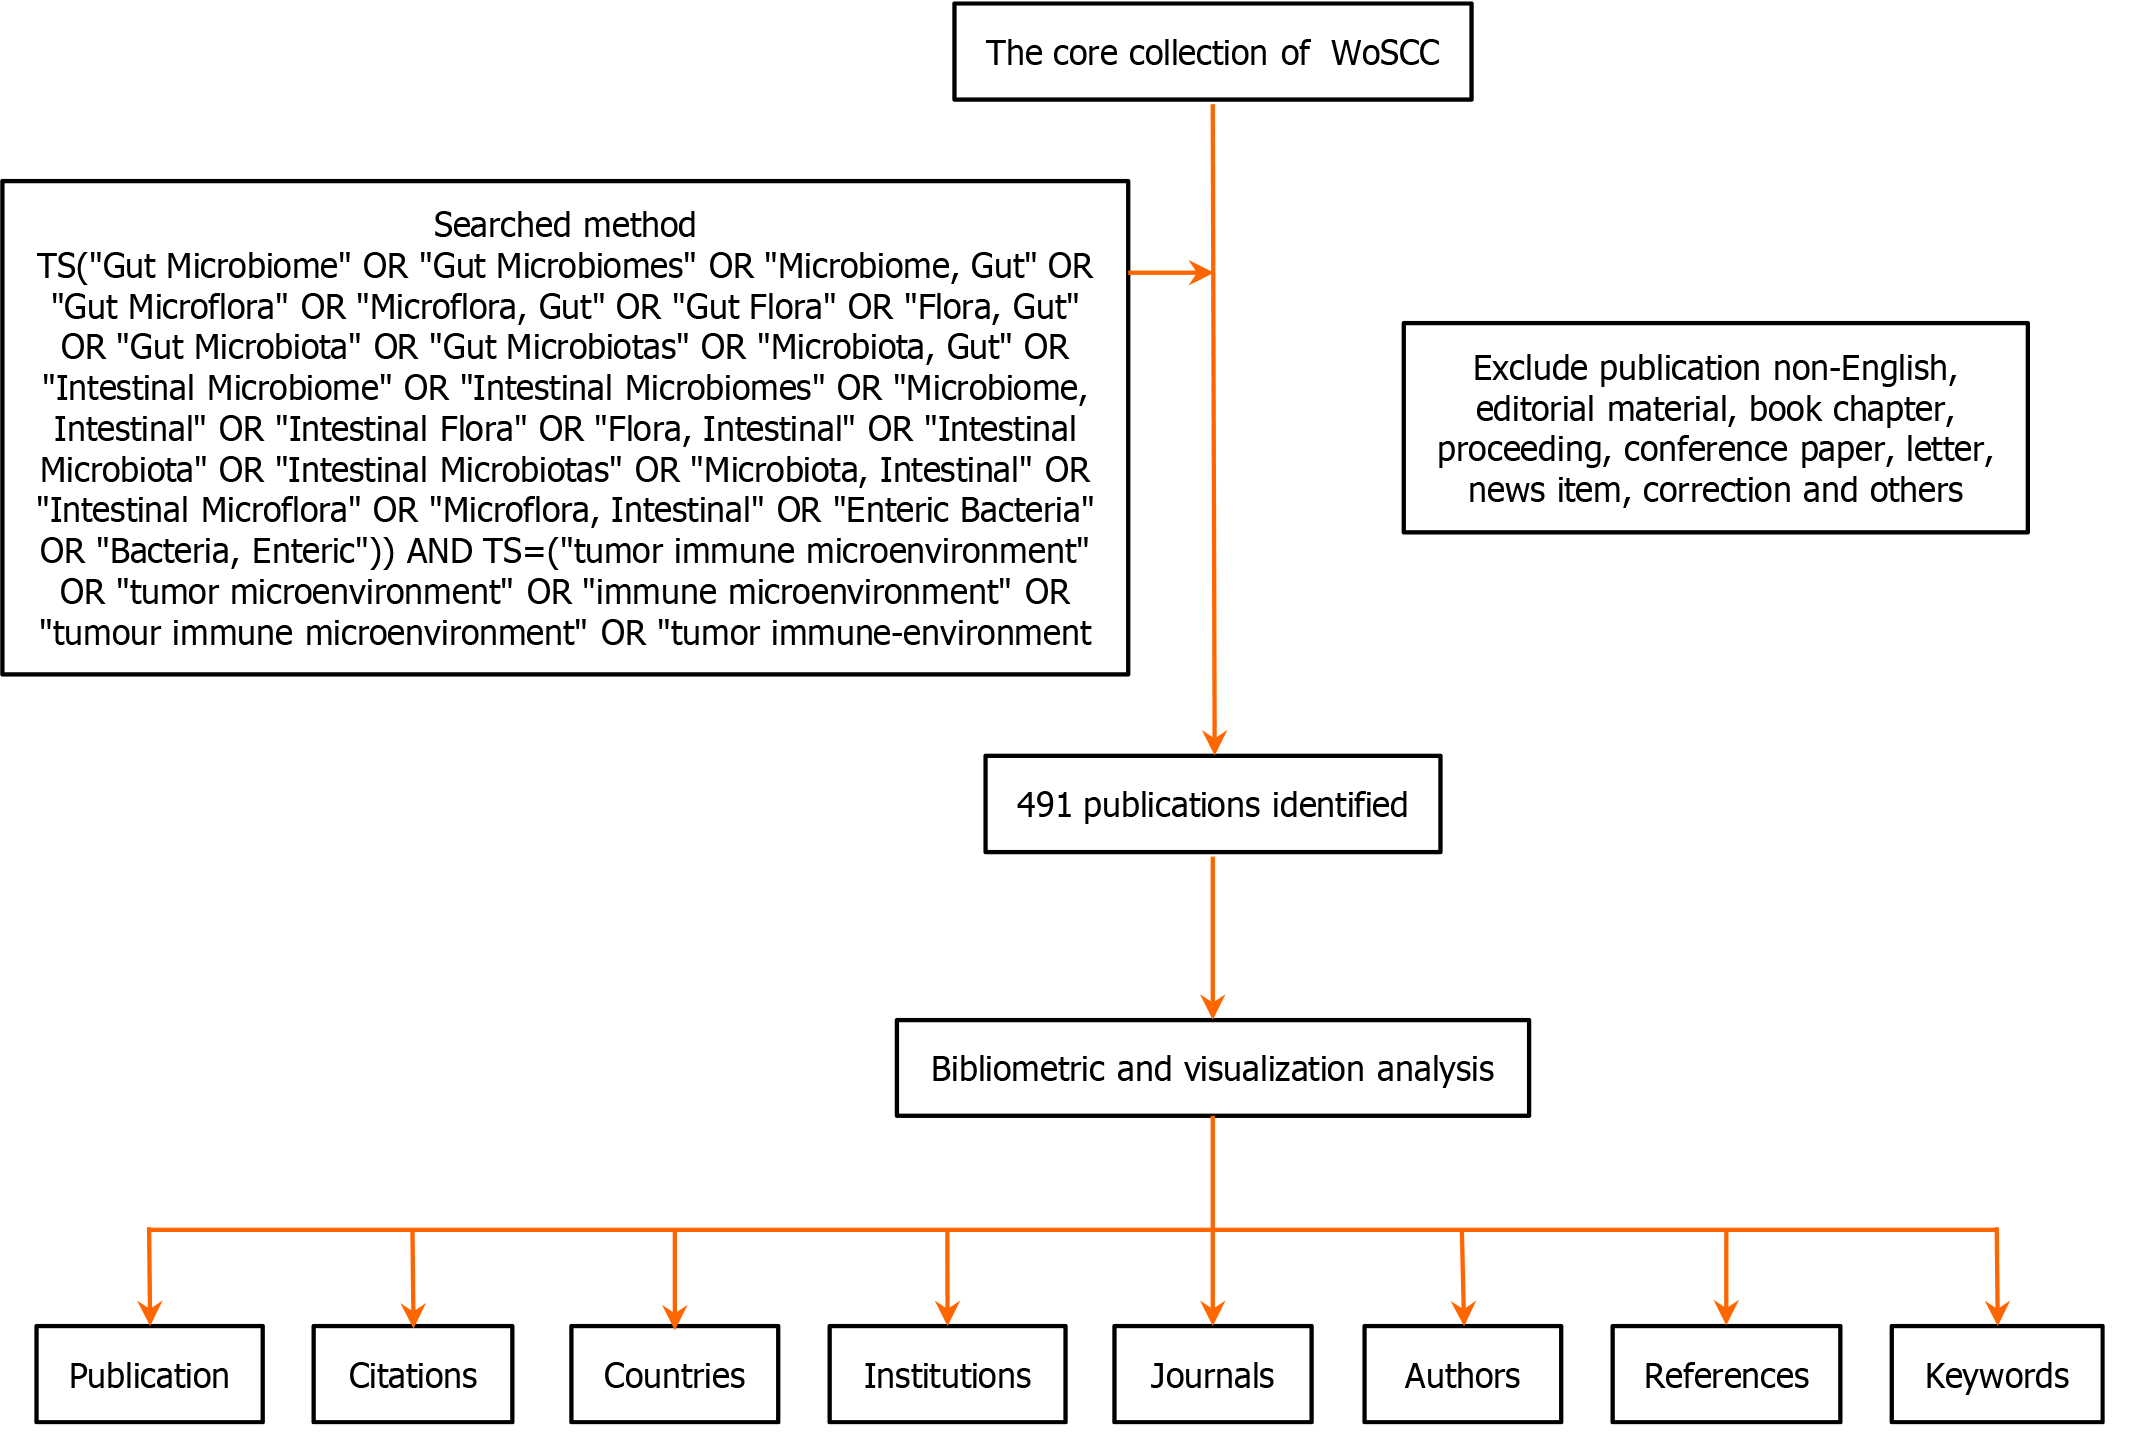
Figure 1 Publications screening.
WoSCC: Web of Science Core Collection.
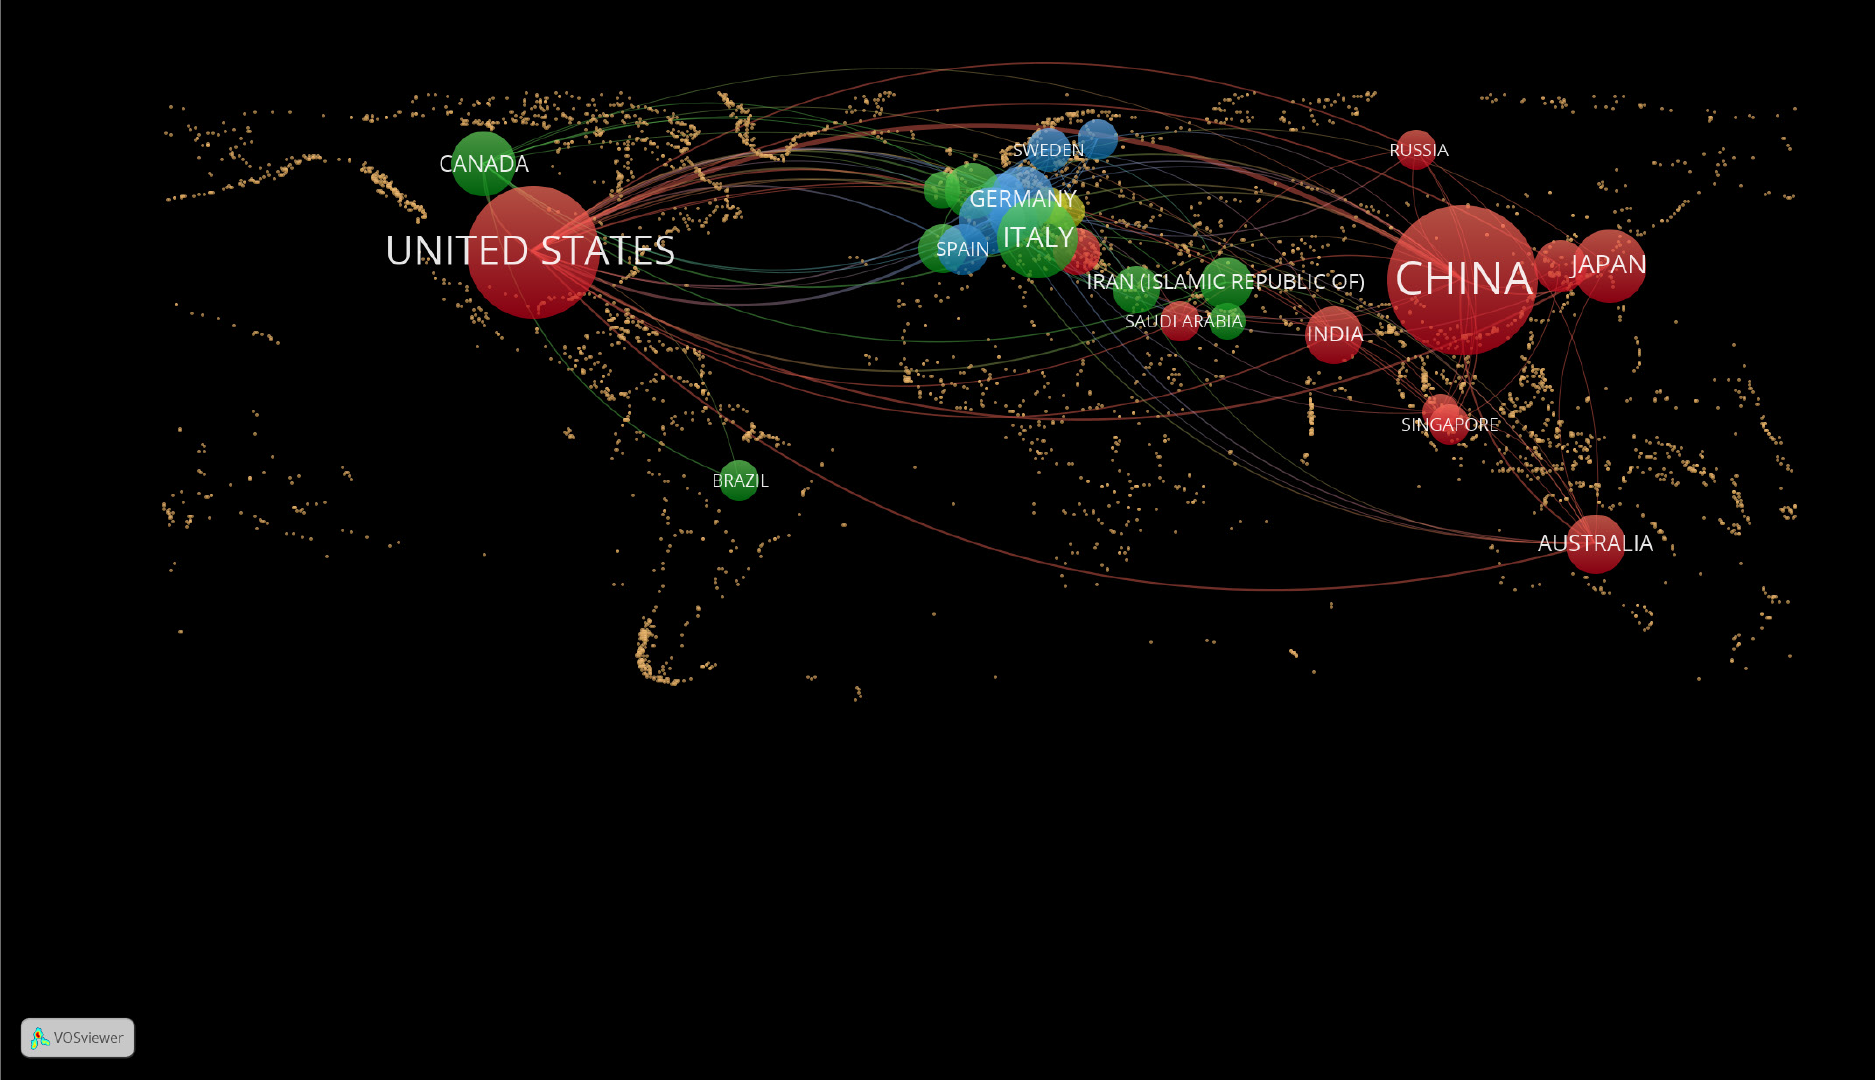
Figure 2
Geographical distribution of publications on the correlation between gut microbiota and tumor immune microenvironment research.
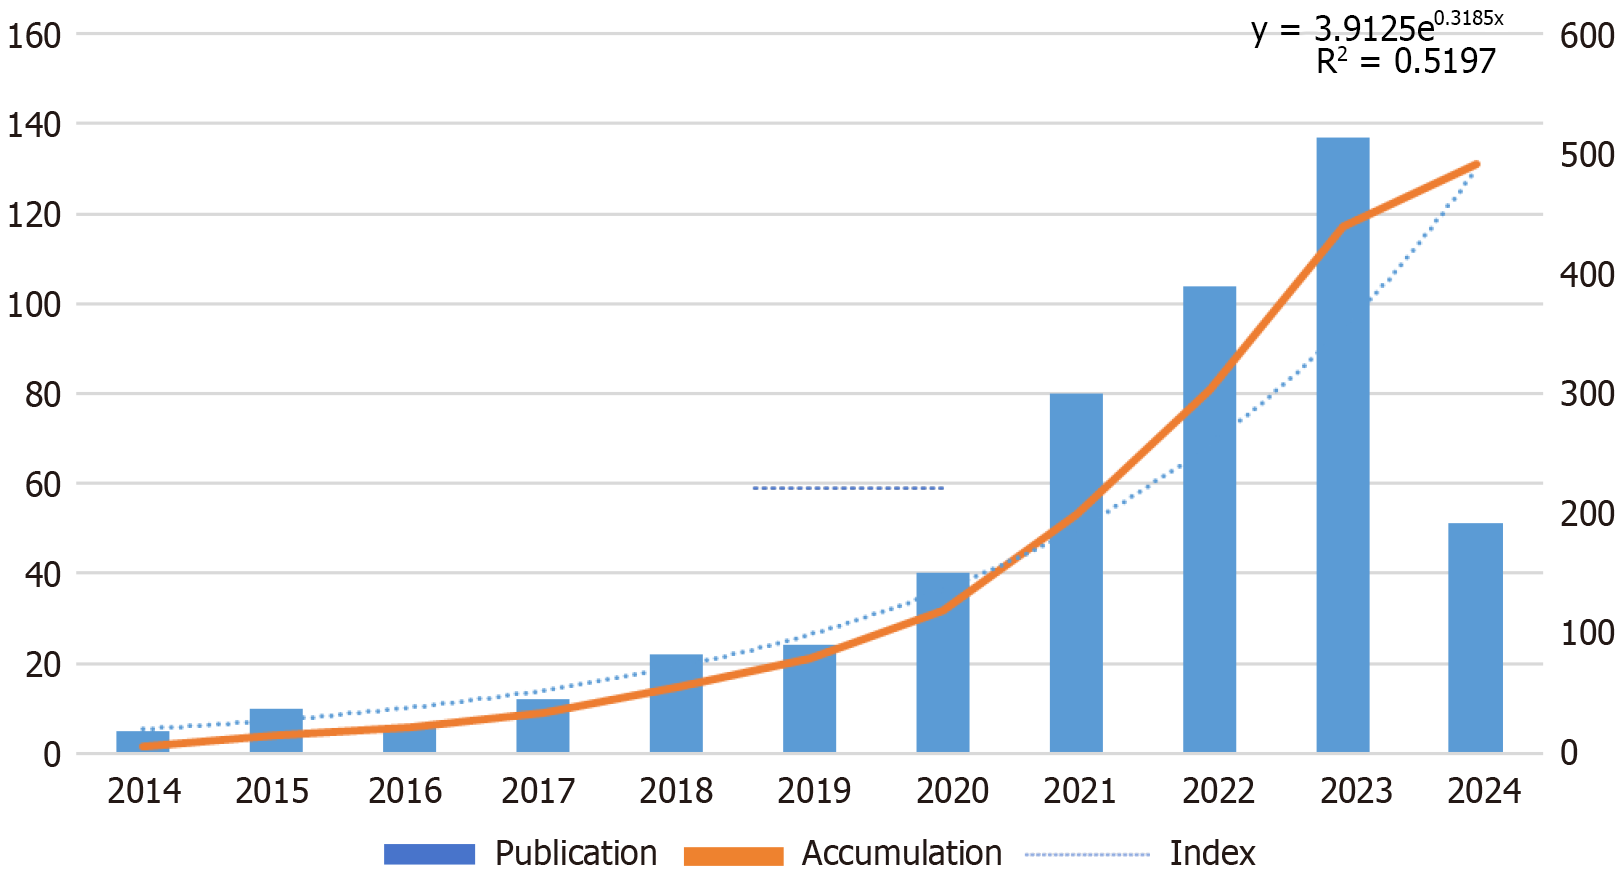
Figure 3
Publications divided by year over the past decade.
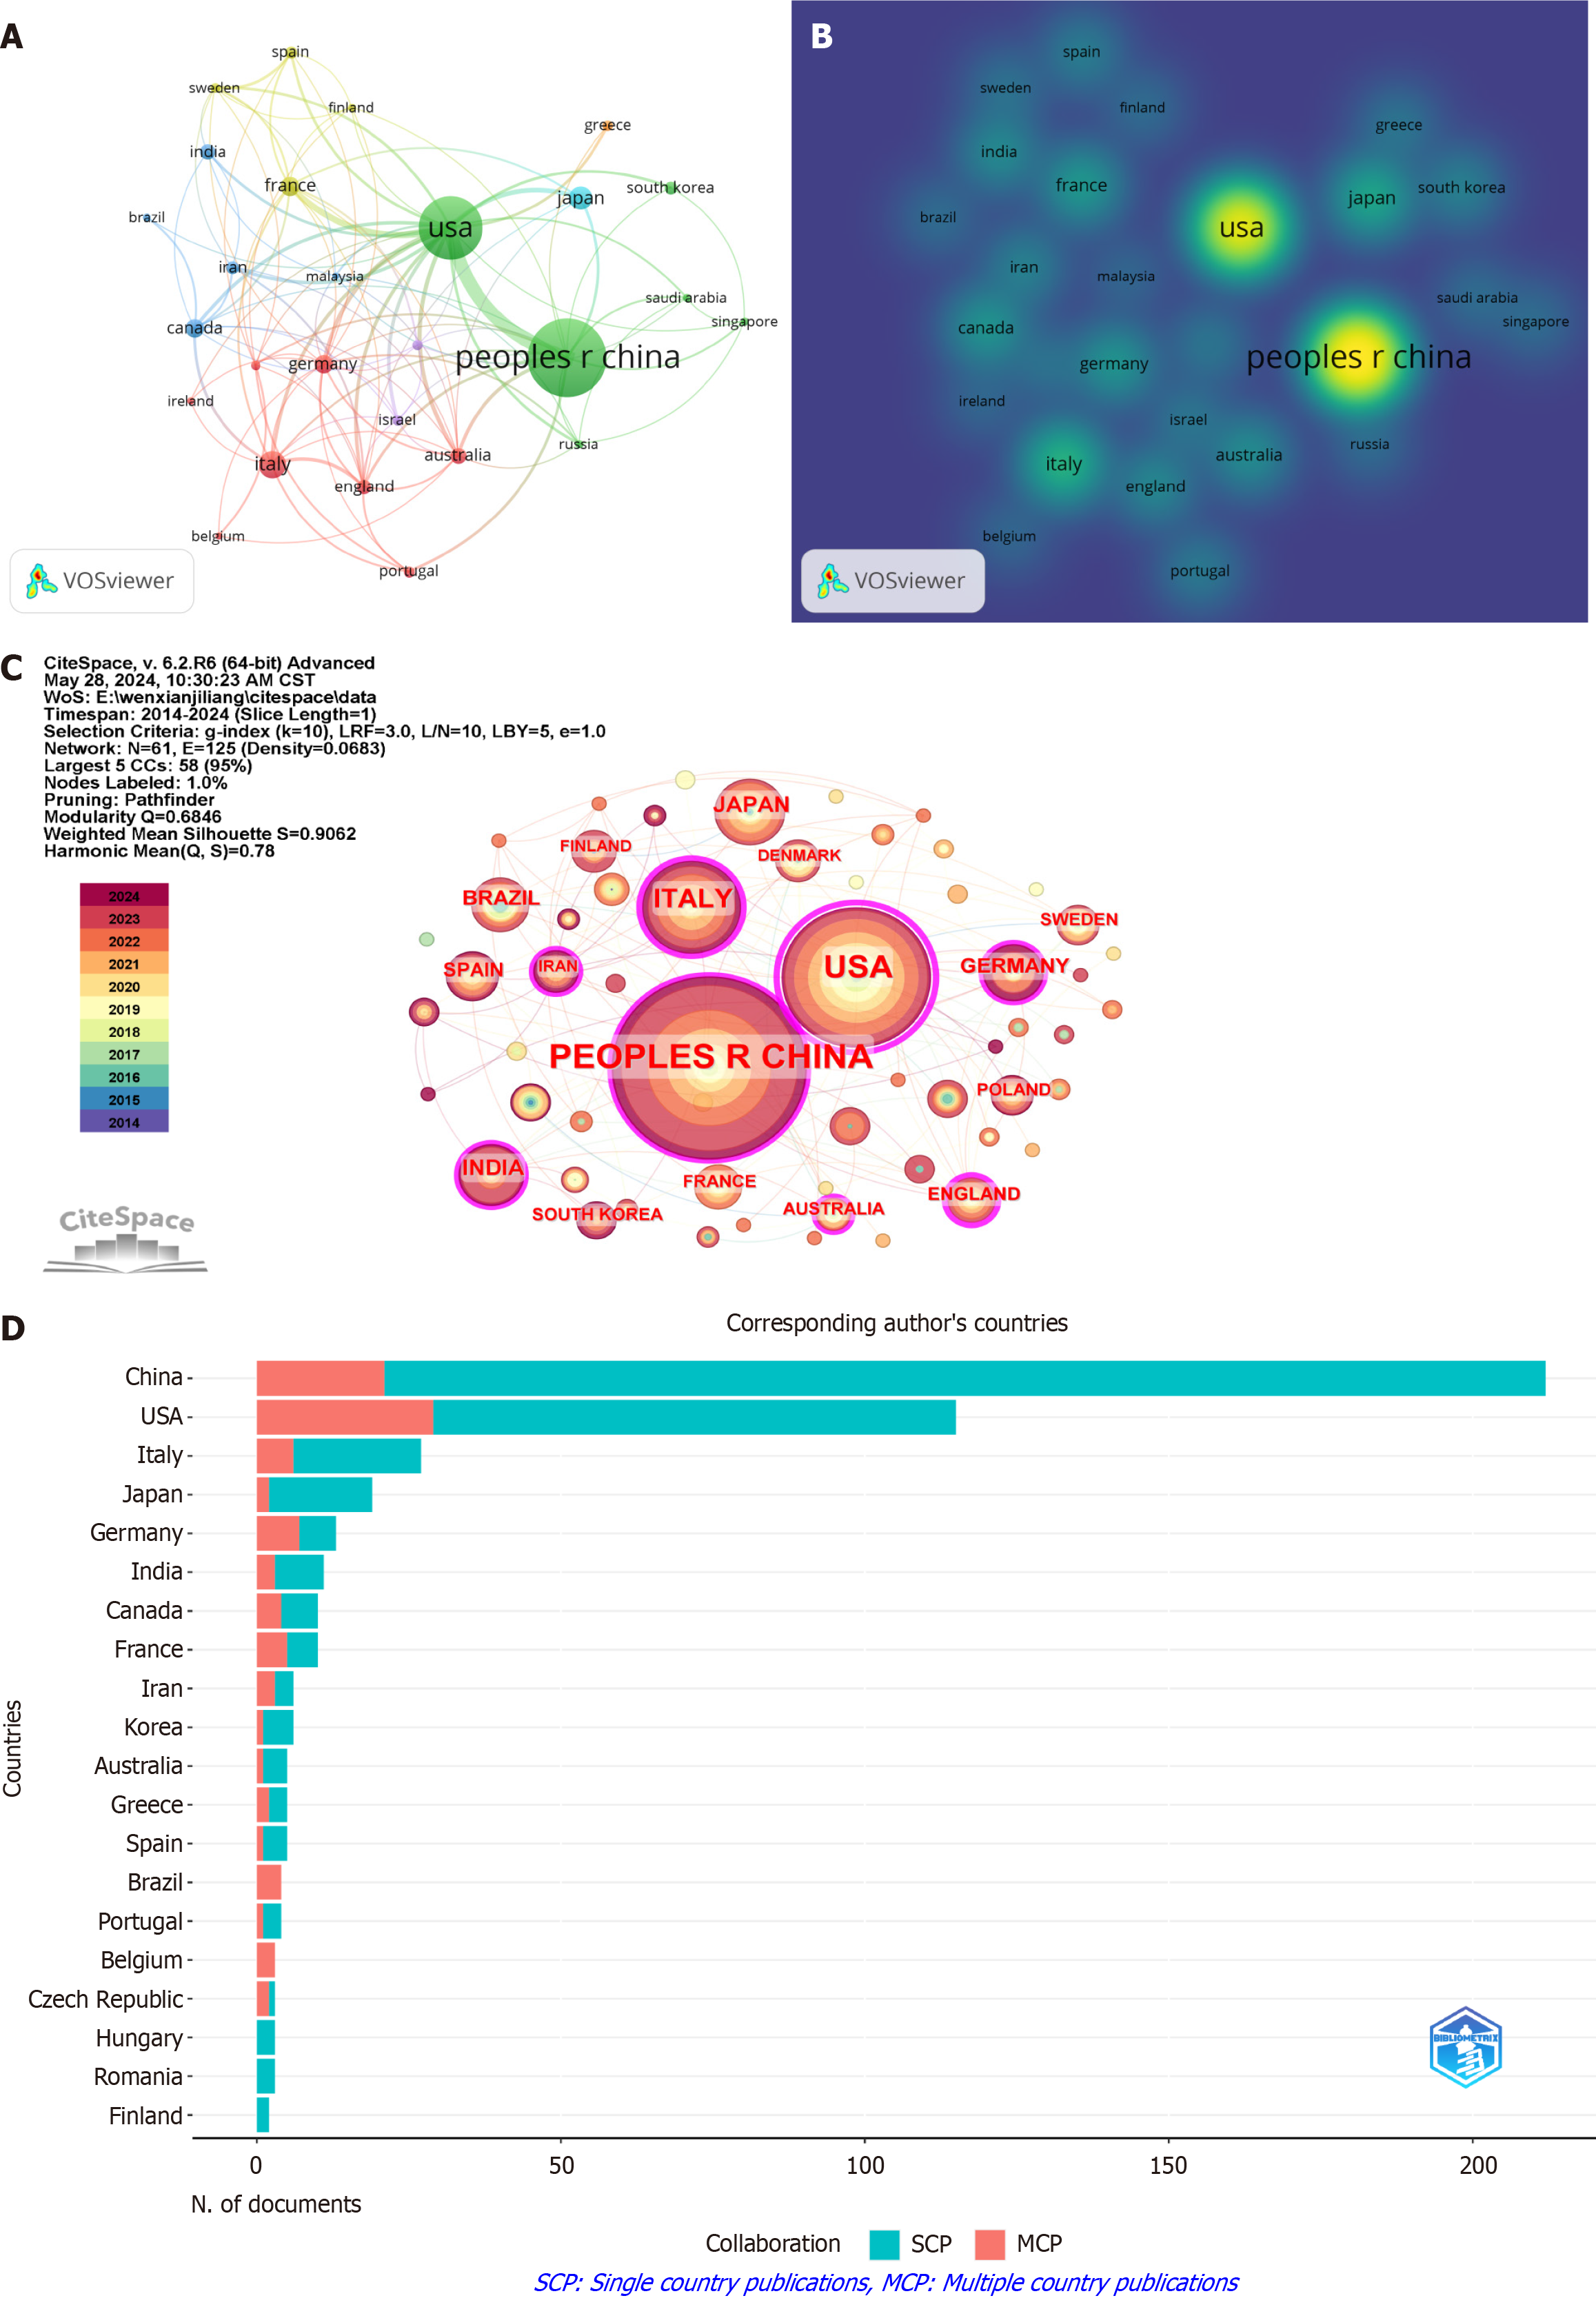
Figure 4 Contributions of different countries to research on the correlation between gut microbiota and tumor immune microen
Figure 5
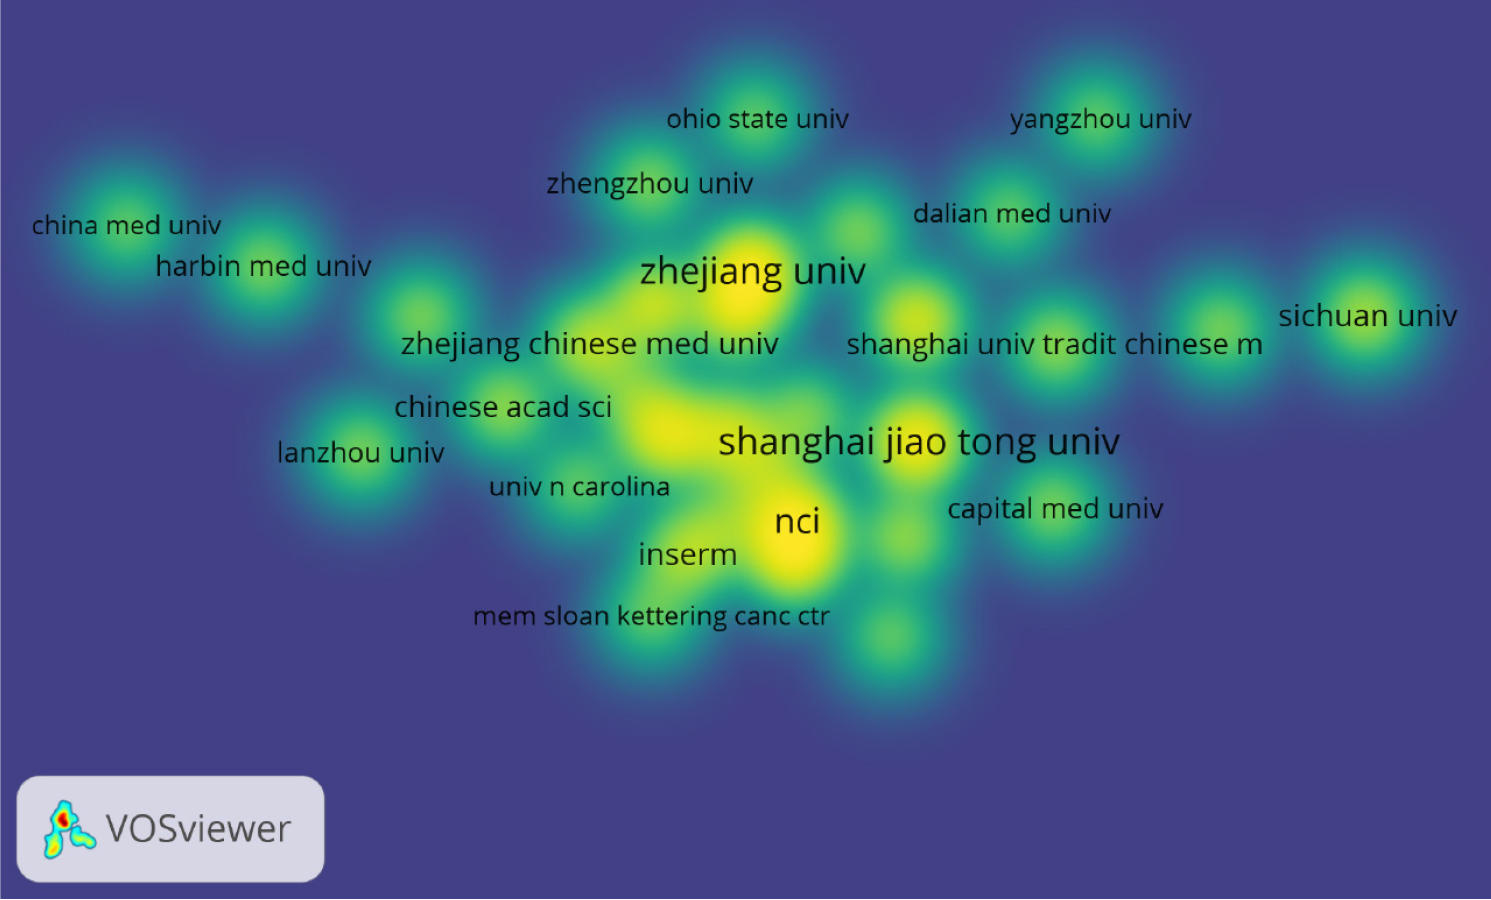
Institutional collaboration network diagram: Density map of cooperation between institutions.
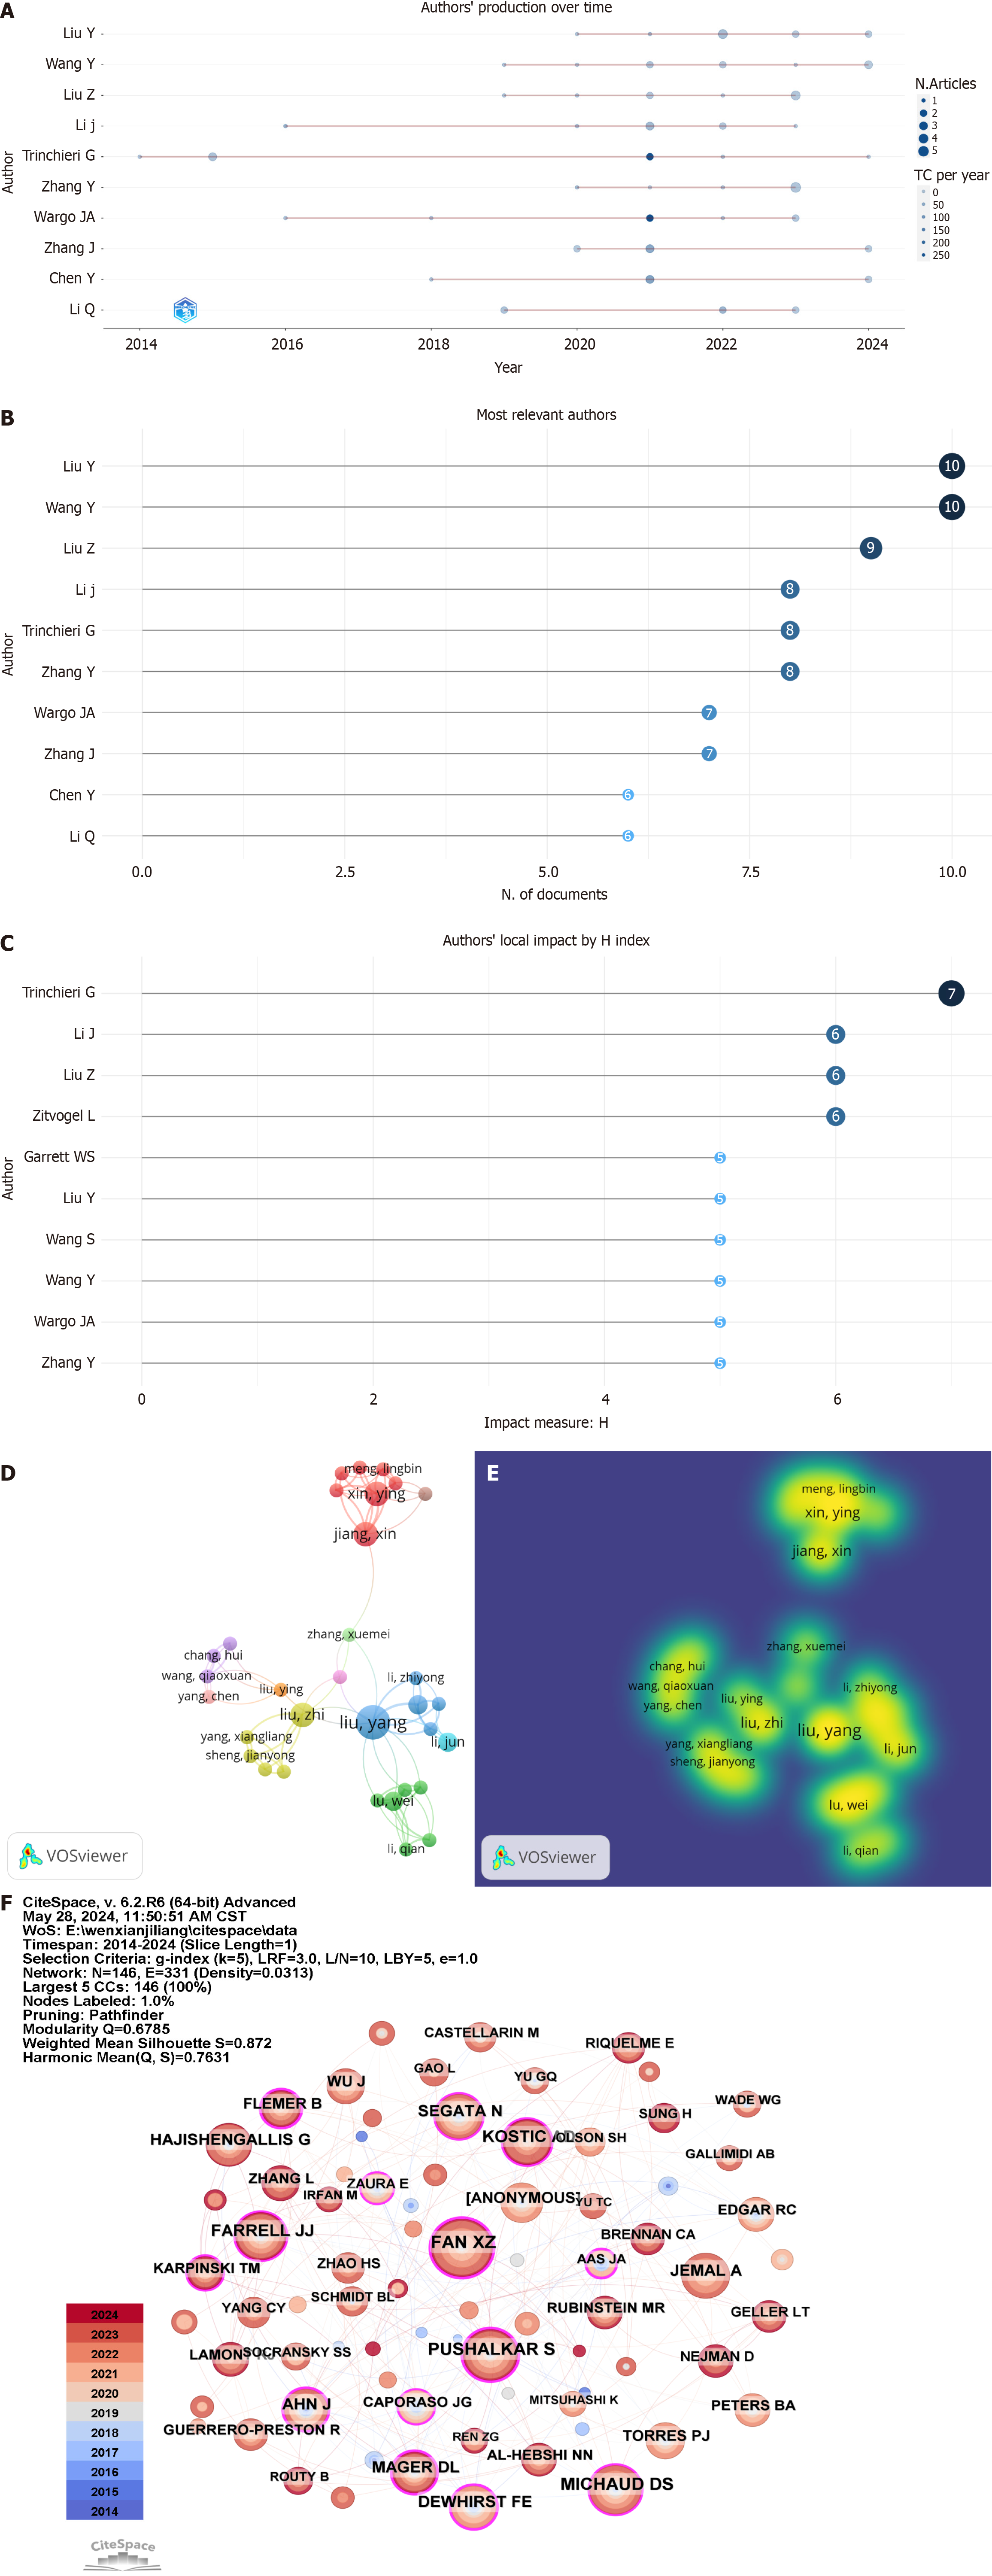
Figure 6 Contributions of different authors to research on the correlation between gut microbiota and tumor immune microenvironment.
A: Top 10 authors in terms of average publication count per year; B: Top10 most relevant authors; C: Top 10 influential authors based on the h-index; D: Network visualization of authors collaboration; E: Density map of cooperation between authors; F: Network diagram showing international collaborations.
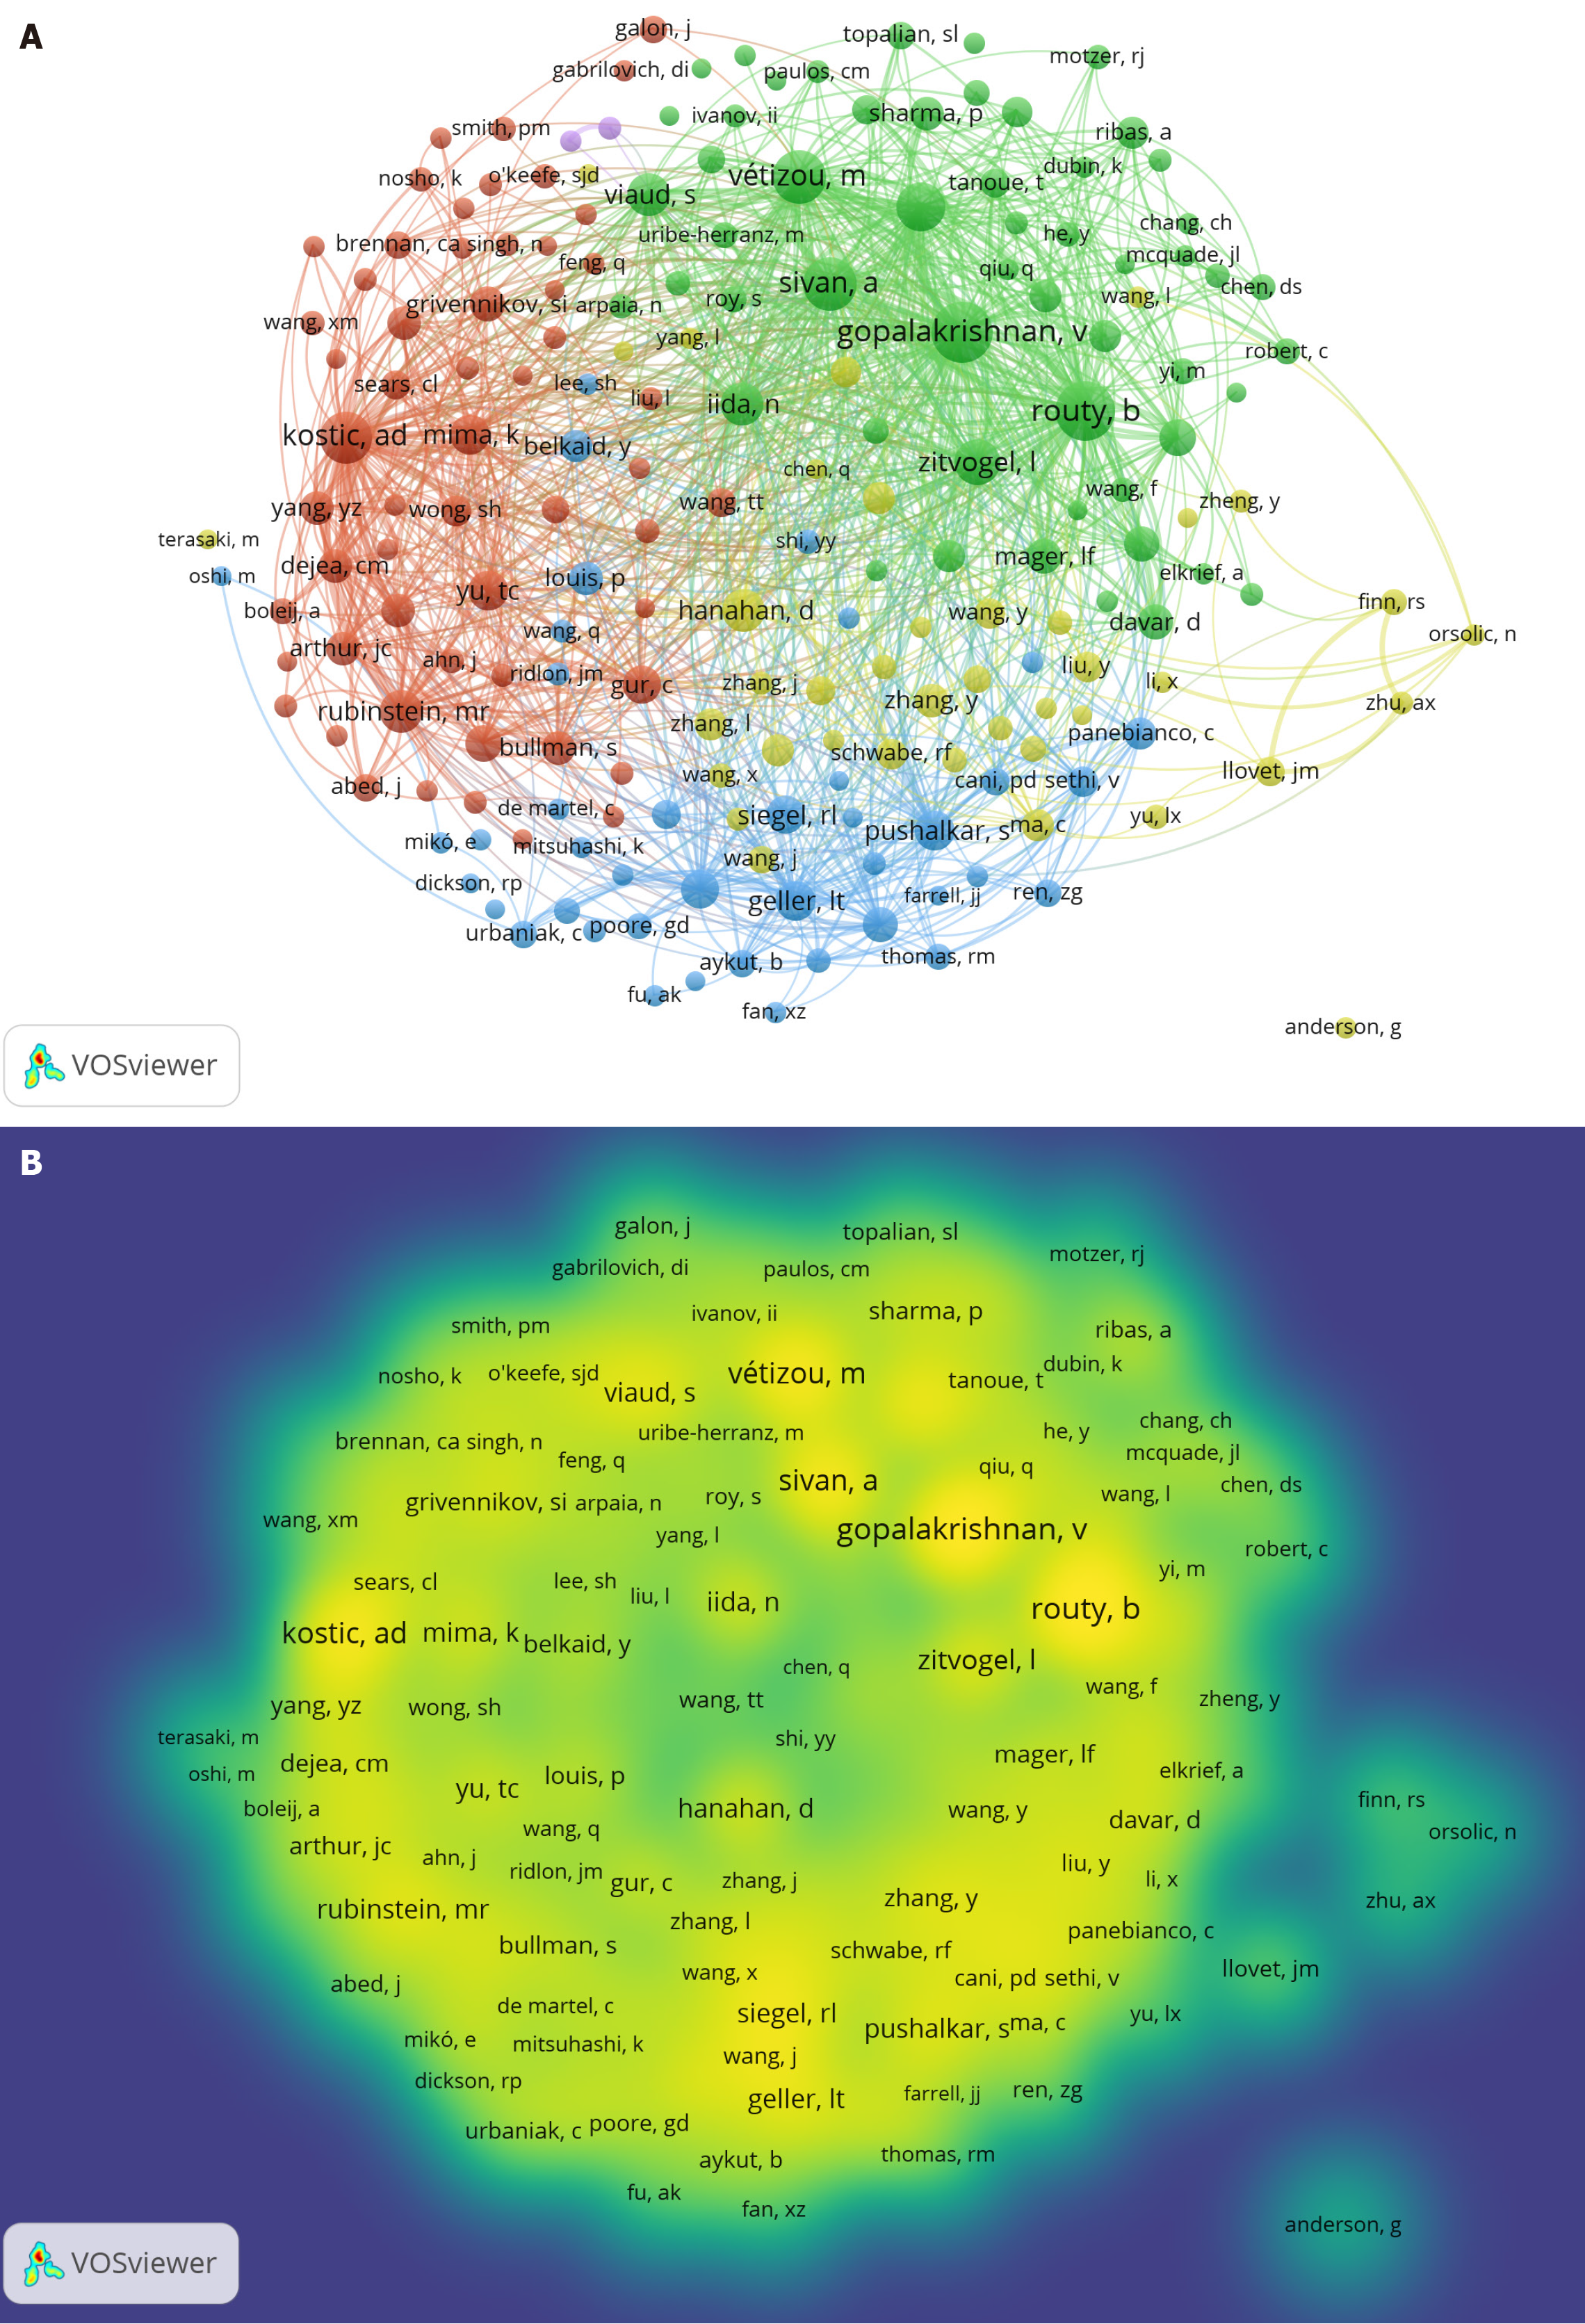
Figure 7 Analysis of co-cited authors.
A: Network visualization of co-cited authors; B: Density map of co-cited authors.
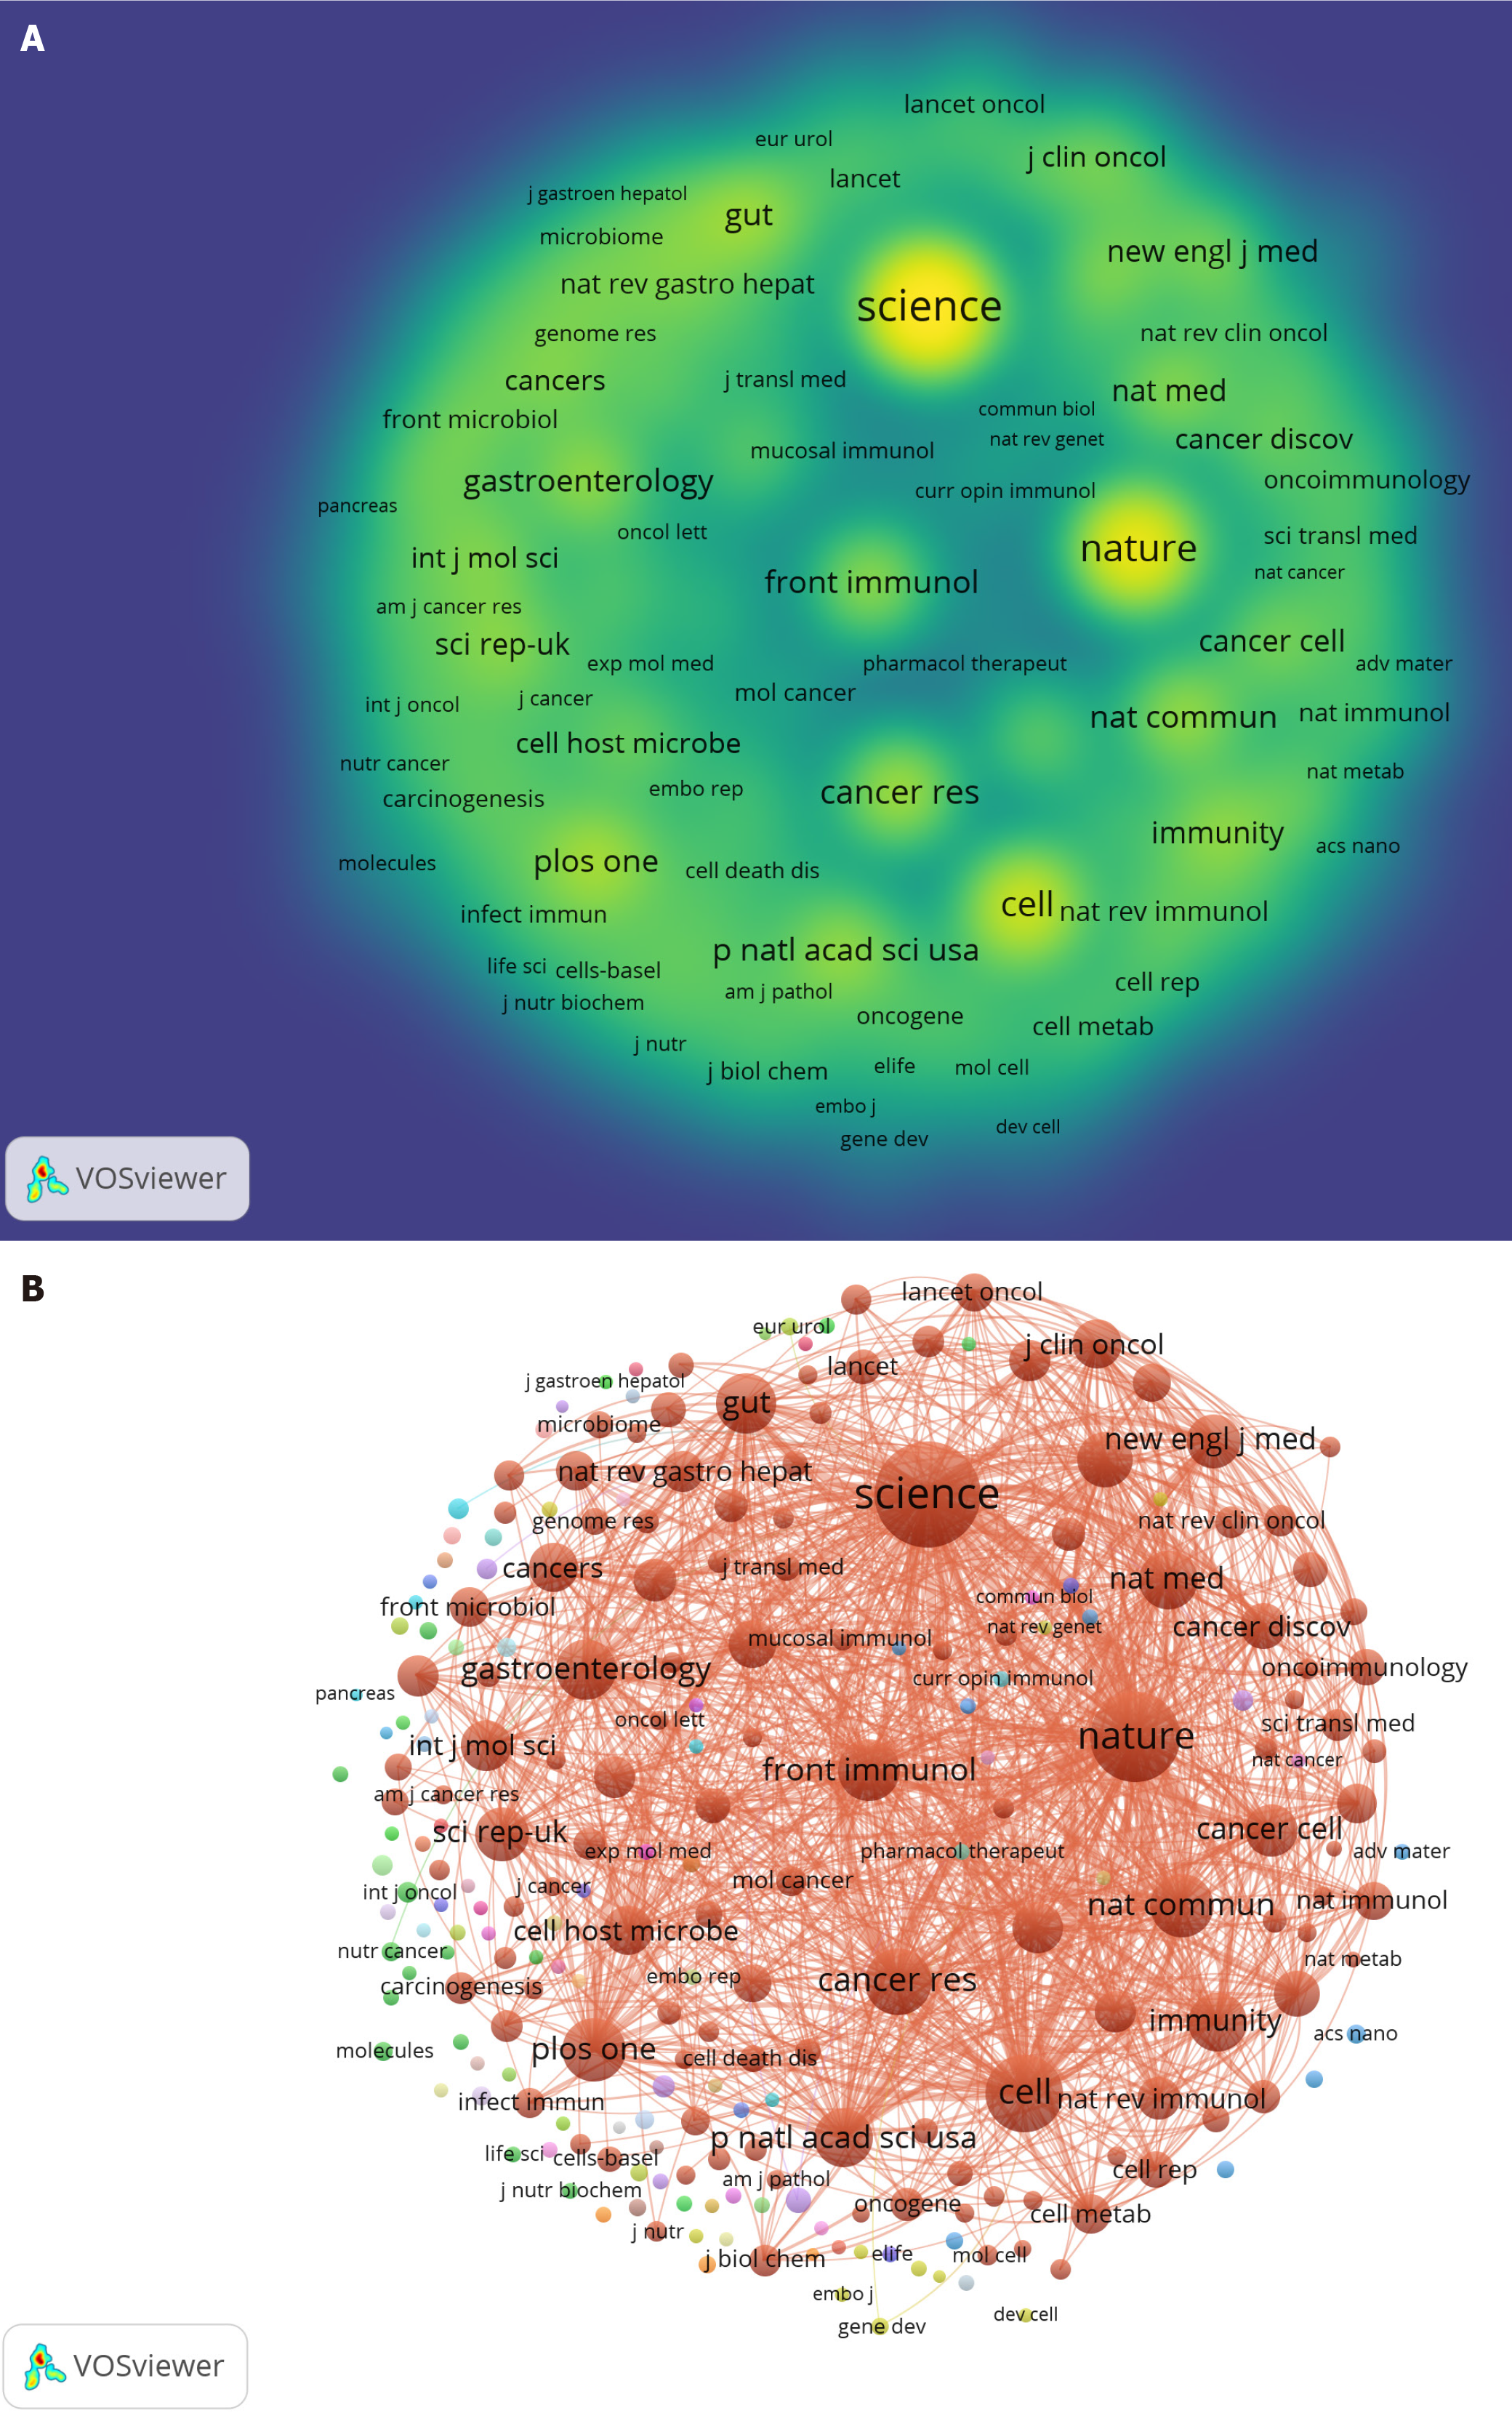
Figure 8 Analysis of co-cited journals.
A: Density map of co-cited journals; B: Network visualization of co-cited journals.
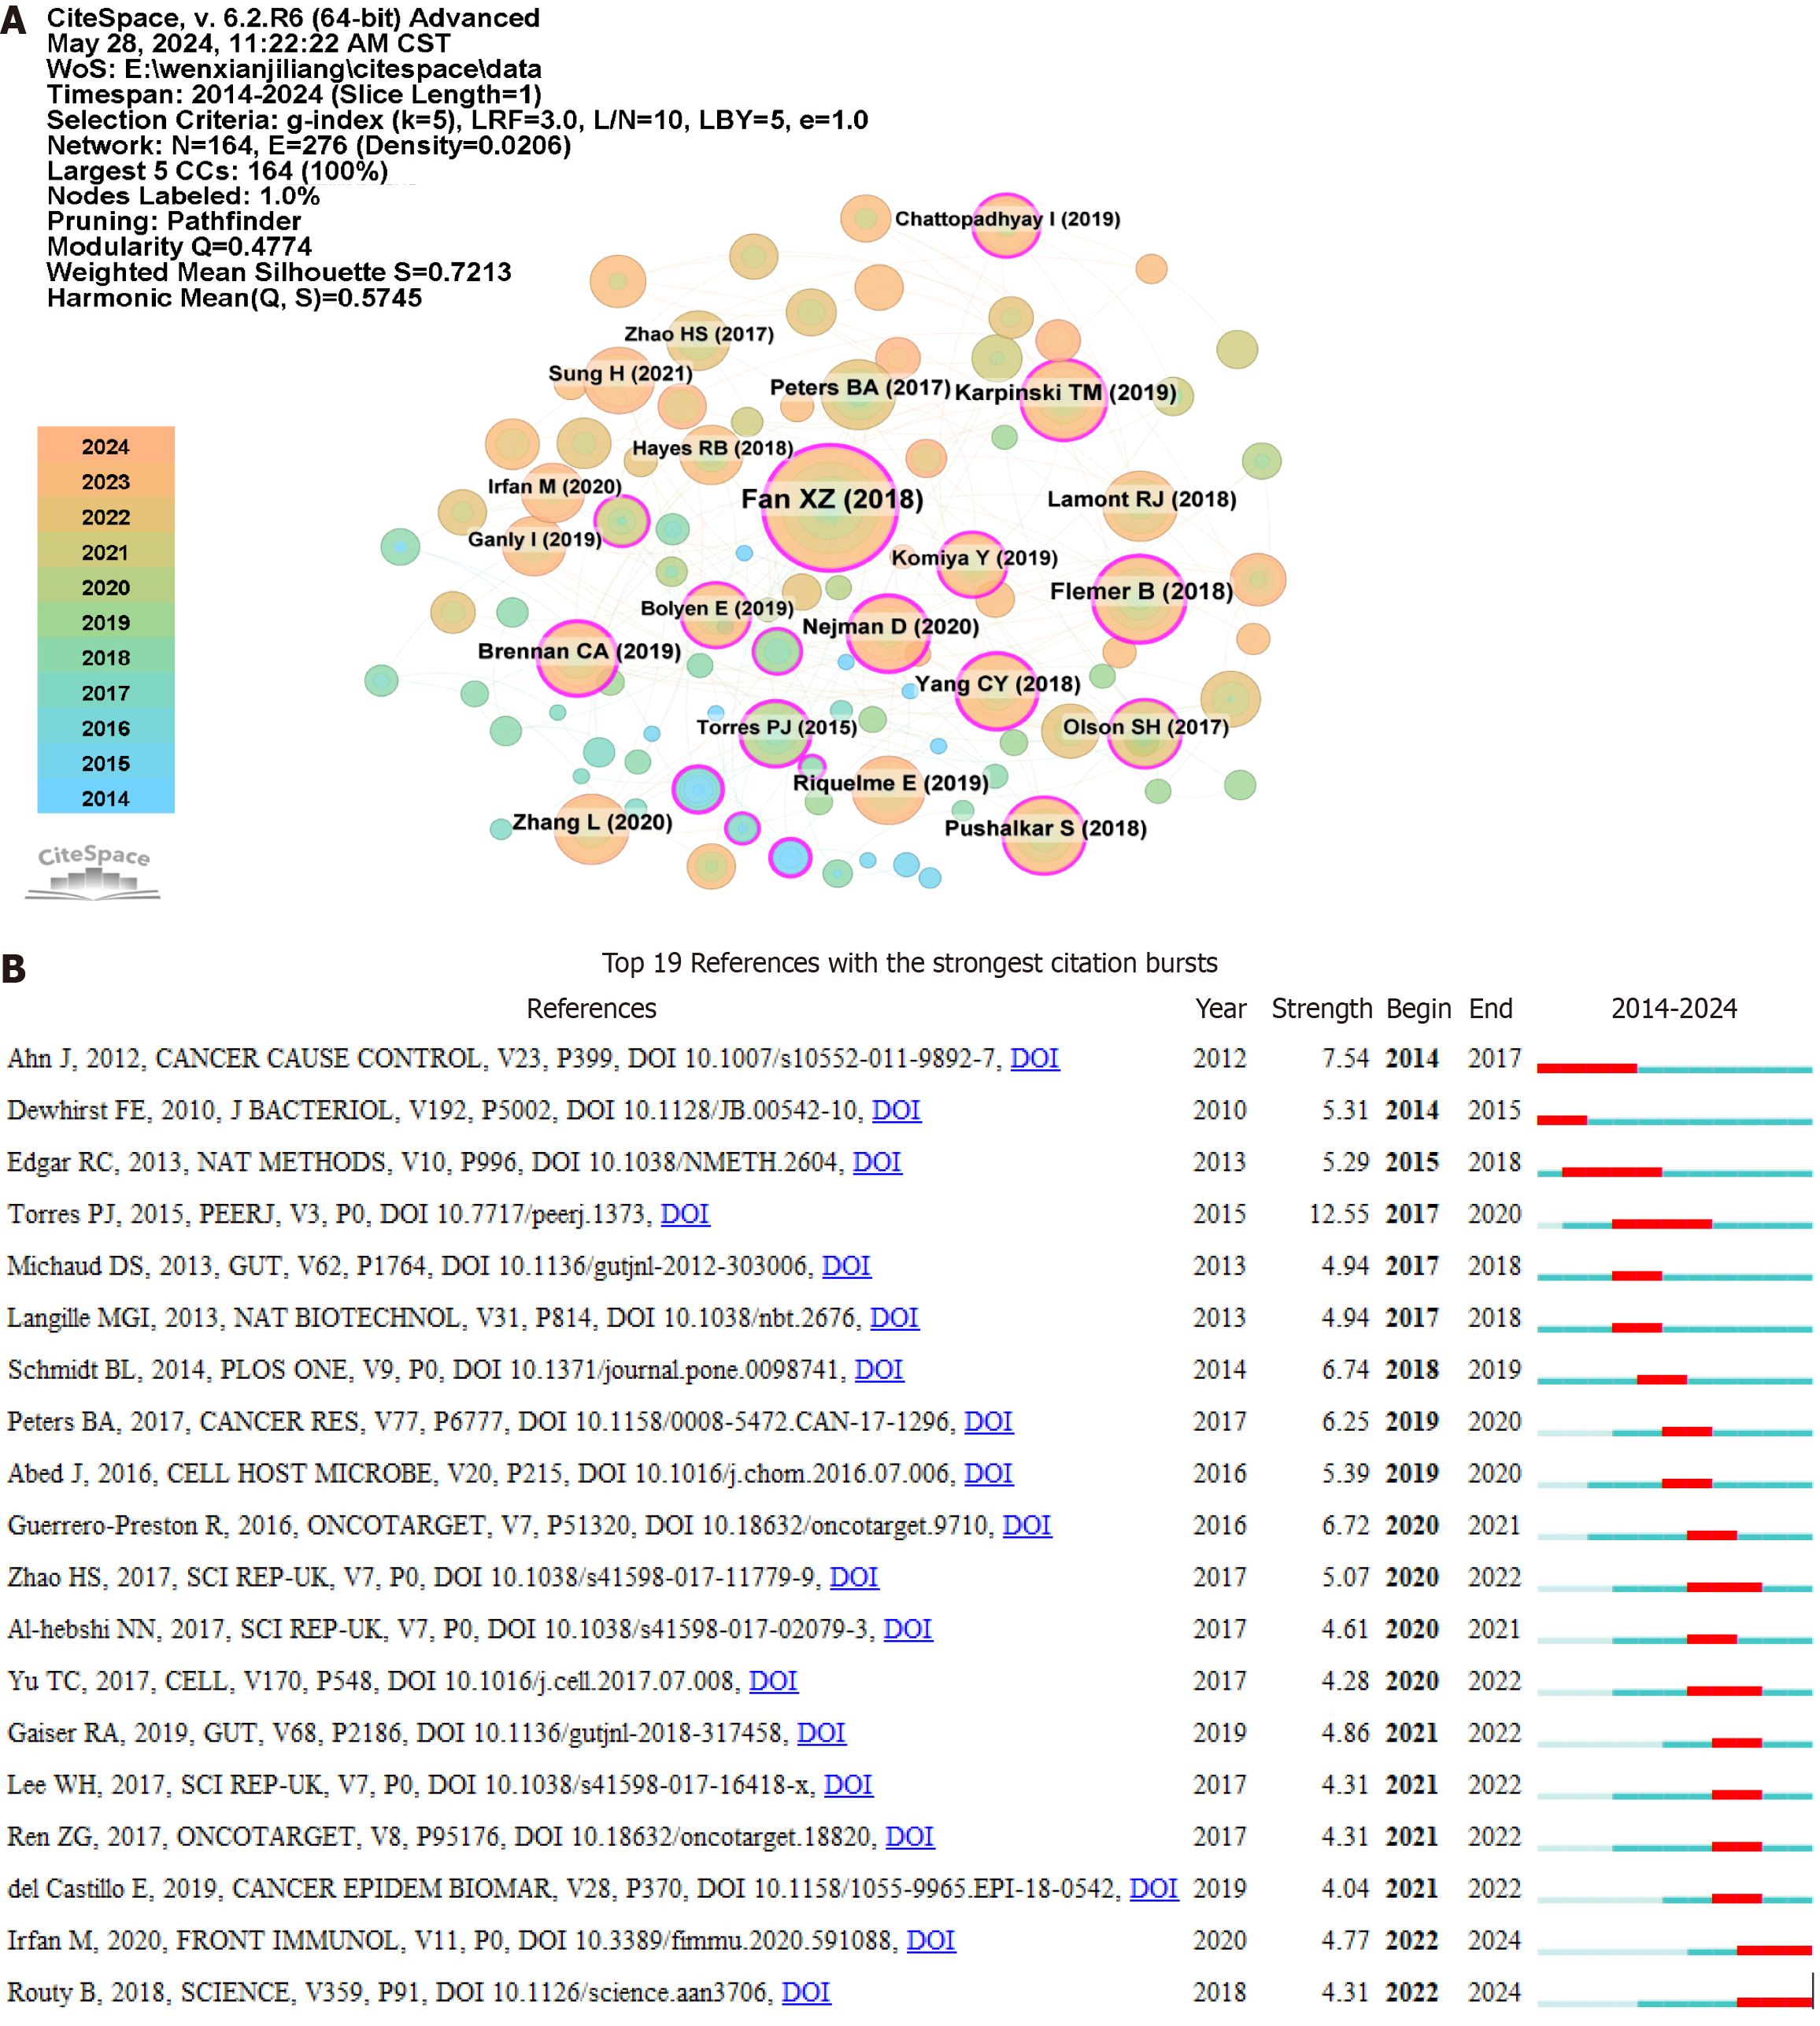
Figure 9 Analysis of co-cited references.
A: CiteSpace visualization of co-cited references; B: Top 19 references with the strongest citation bursts.
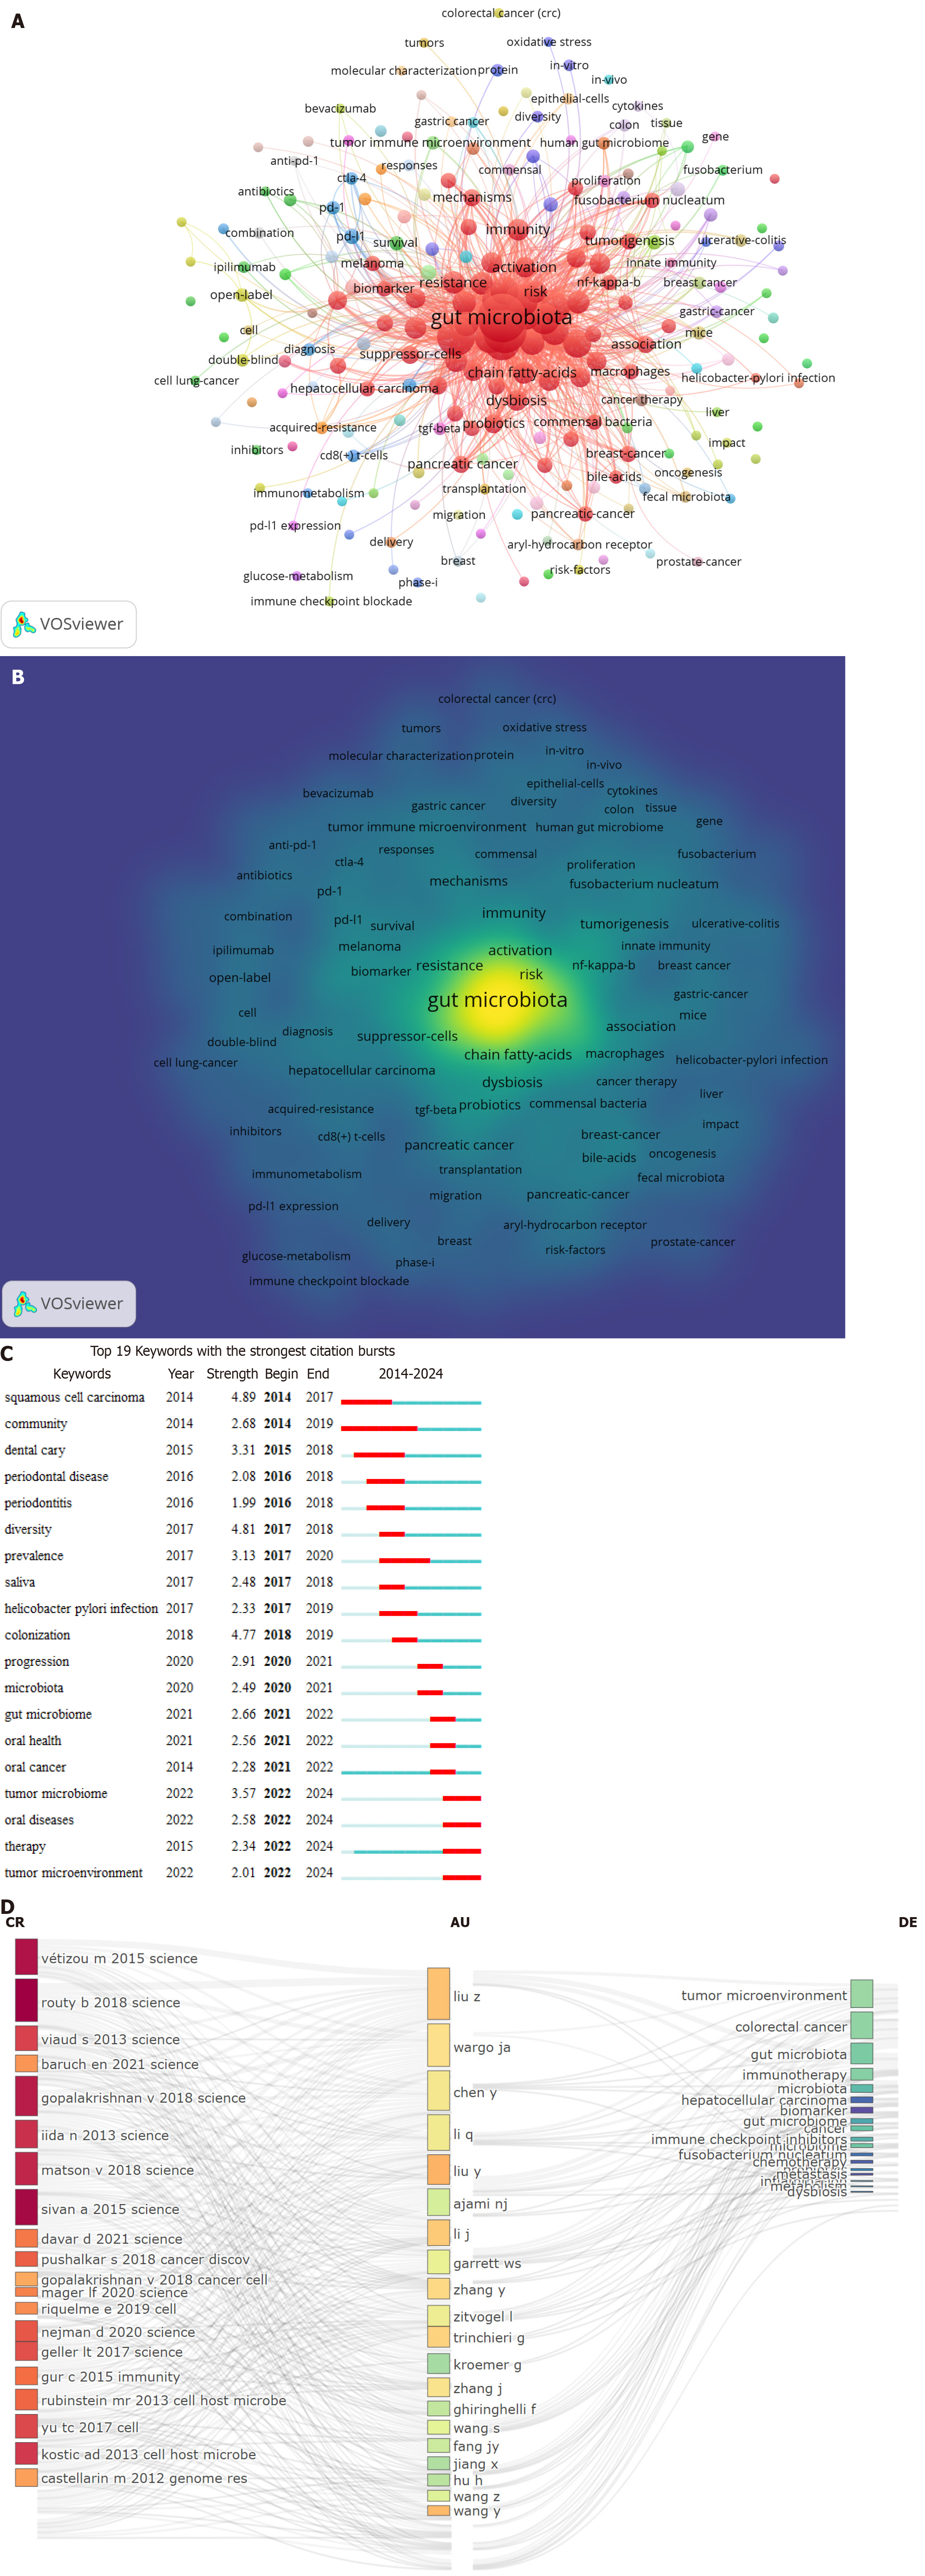
Figure 10 Analysis of keywords.
A: Co-occurrence of keywords; B: Density map of keywords co-occurrence; C: Top 19 keywords with the citation burstiness; D: Three-fields plot. CR: Cited references; AU: Authors; DE: Keywords.
- Citation: Hu ZJ, Zhu HR, Jin YJ, Liu P, Yu XW, Zhang YR. Correlation between gut microbiota and tumor immune microenvironment: A bibliometric and visualized study. World J Clin Oncol 2025; 16(2): 101611
- URL: https://www.wjgnet.com/2218-4333/full/v16/i2/101611.htm
- DOI: https://dx.doi.org/10.5306/wjco.v16.i2.101611


