Copyright
©The Author(s) 2024.
World J Clin Oncol. Sep 24, 2024; 15(9): 1198-1206
Published online Sep 24, 2024. doi: 10.5306/wjco.v15.i9.1198
Published online Sep 24, 2024. doi: 10.5306/wjco.v15.i9.1198
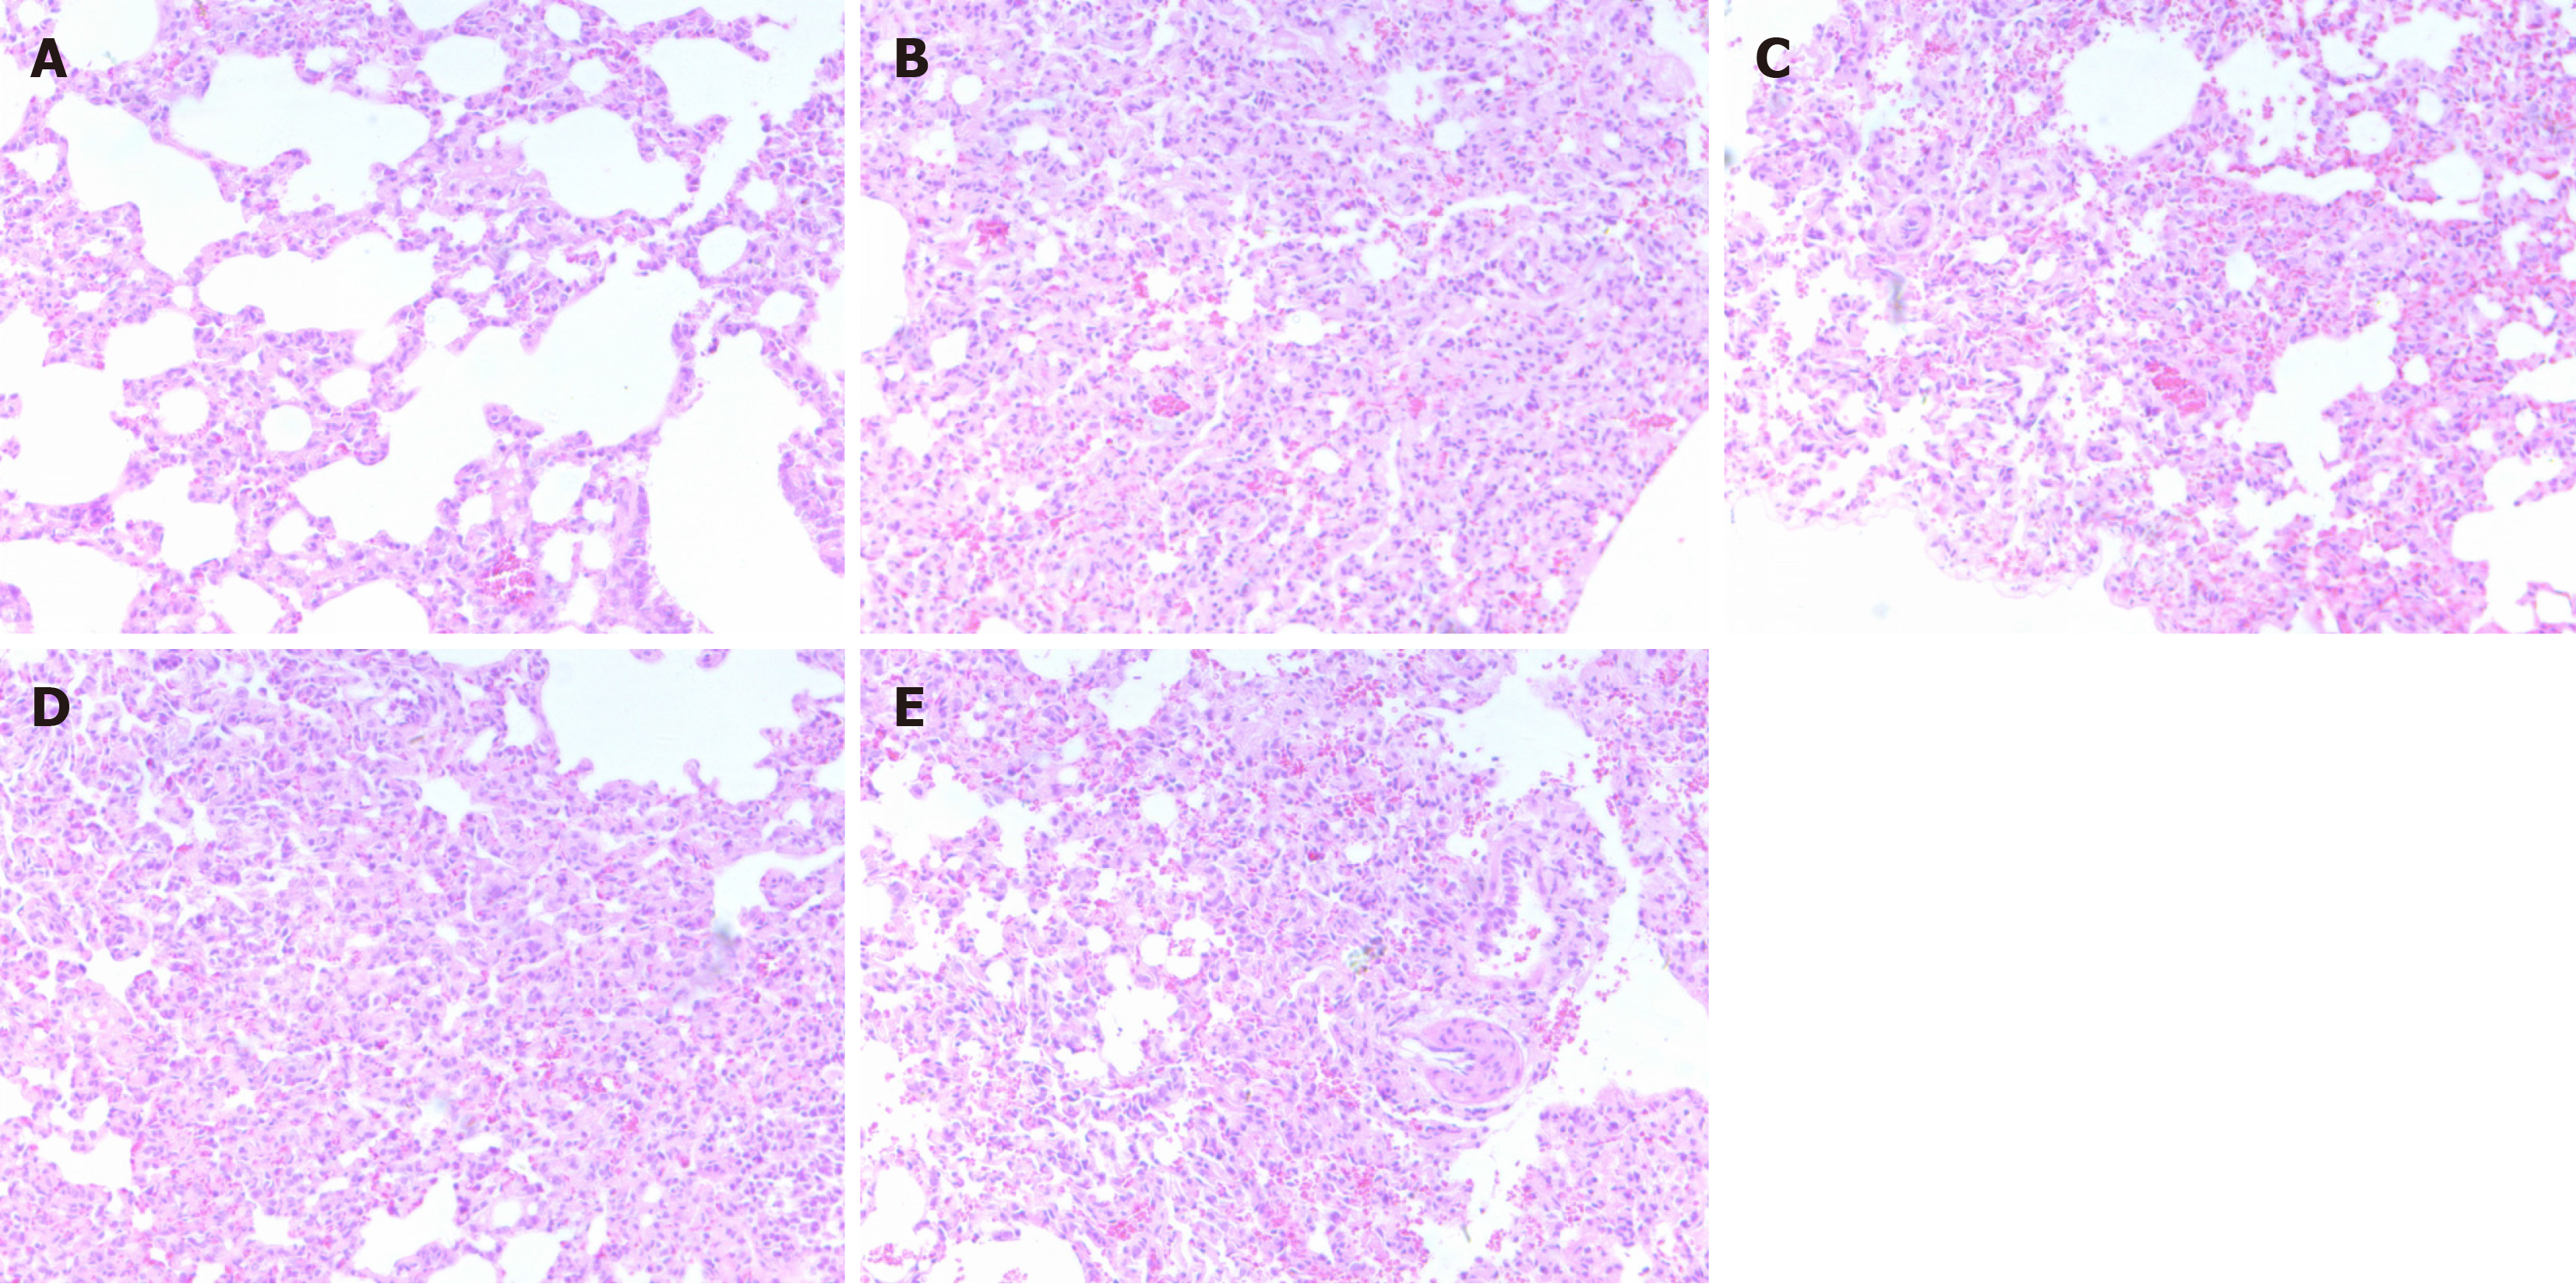
Figure 1 Histopathologic changes in the lungs of mice from different groups.
A: Blank control group; B: Model control group; C: Tao Hong Si Wu Tang (THSW) group; D: IL-6 group; E: THSW + IL-6 group.
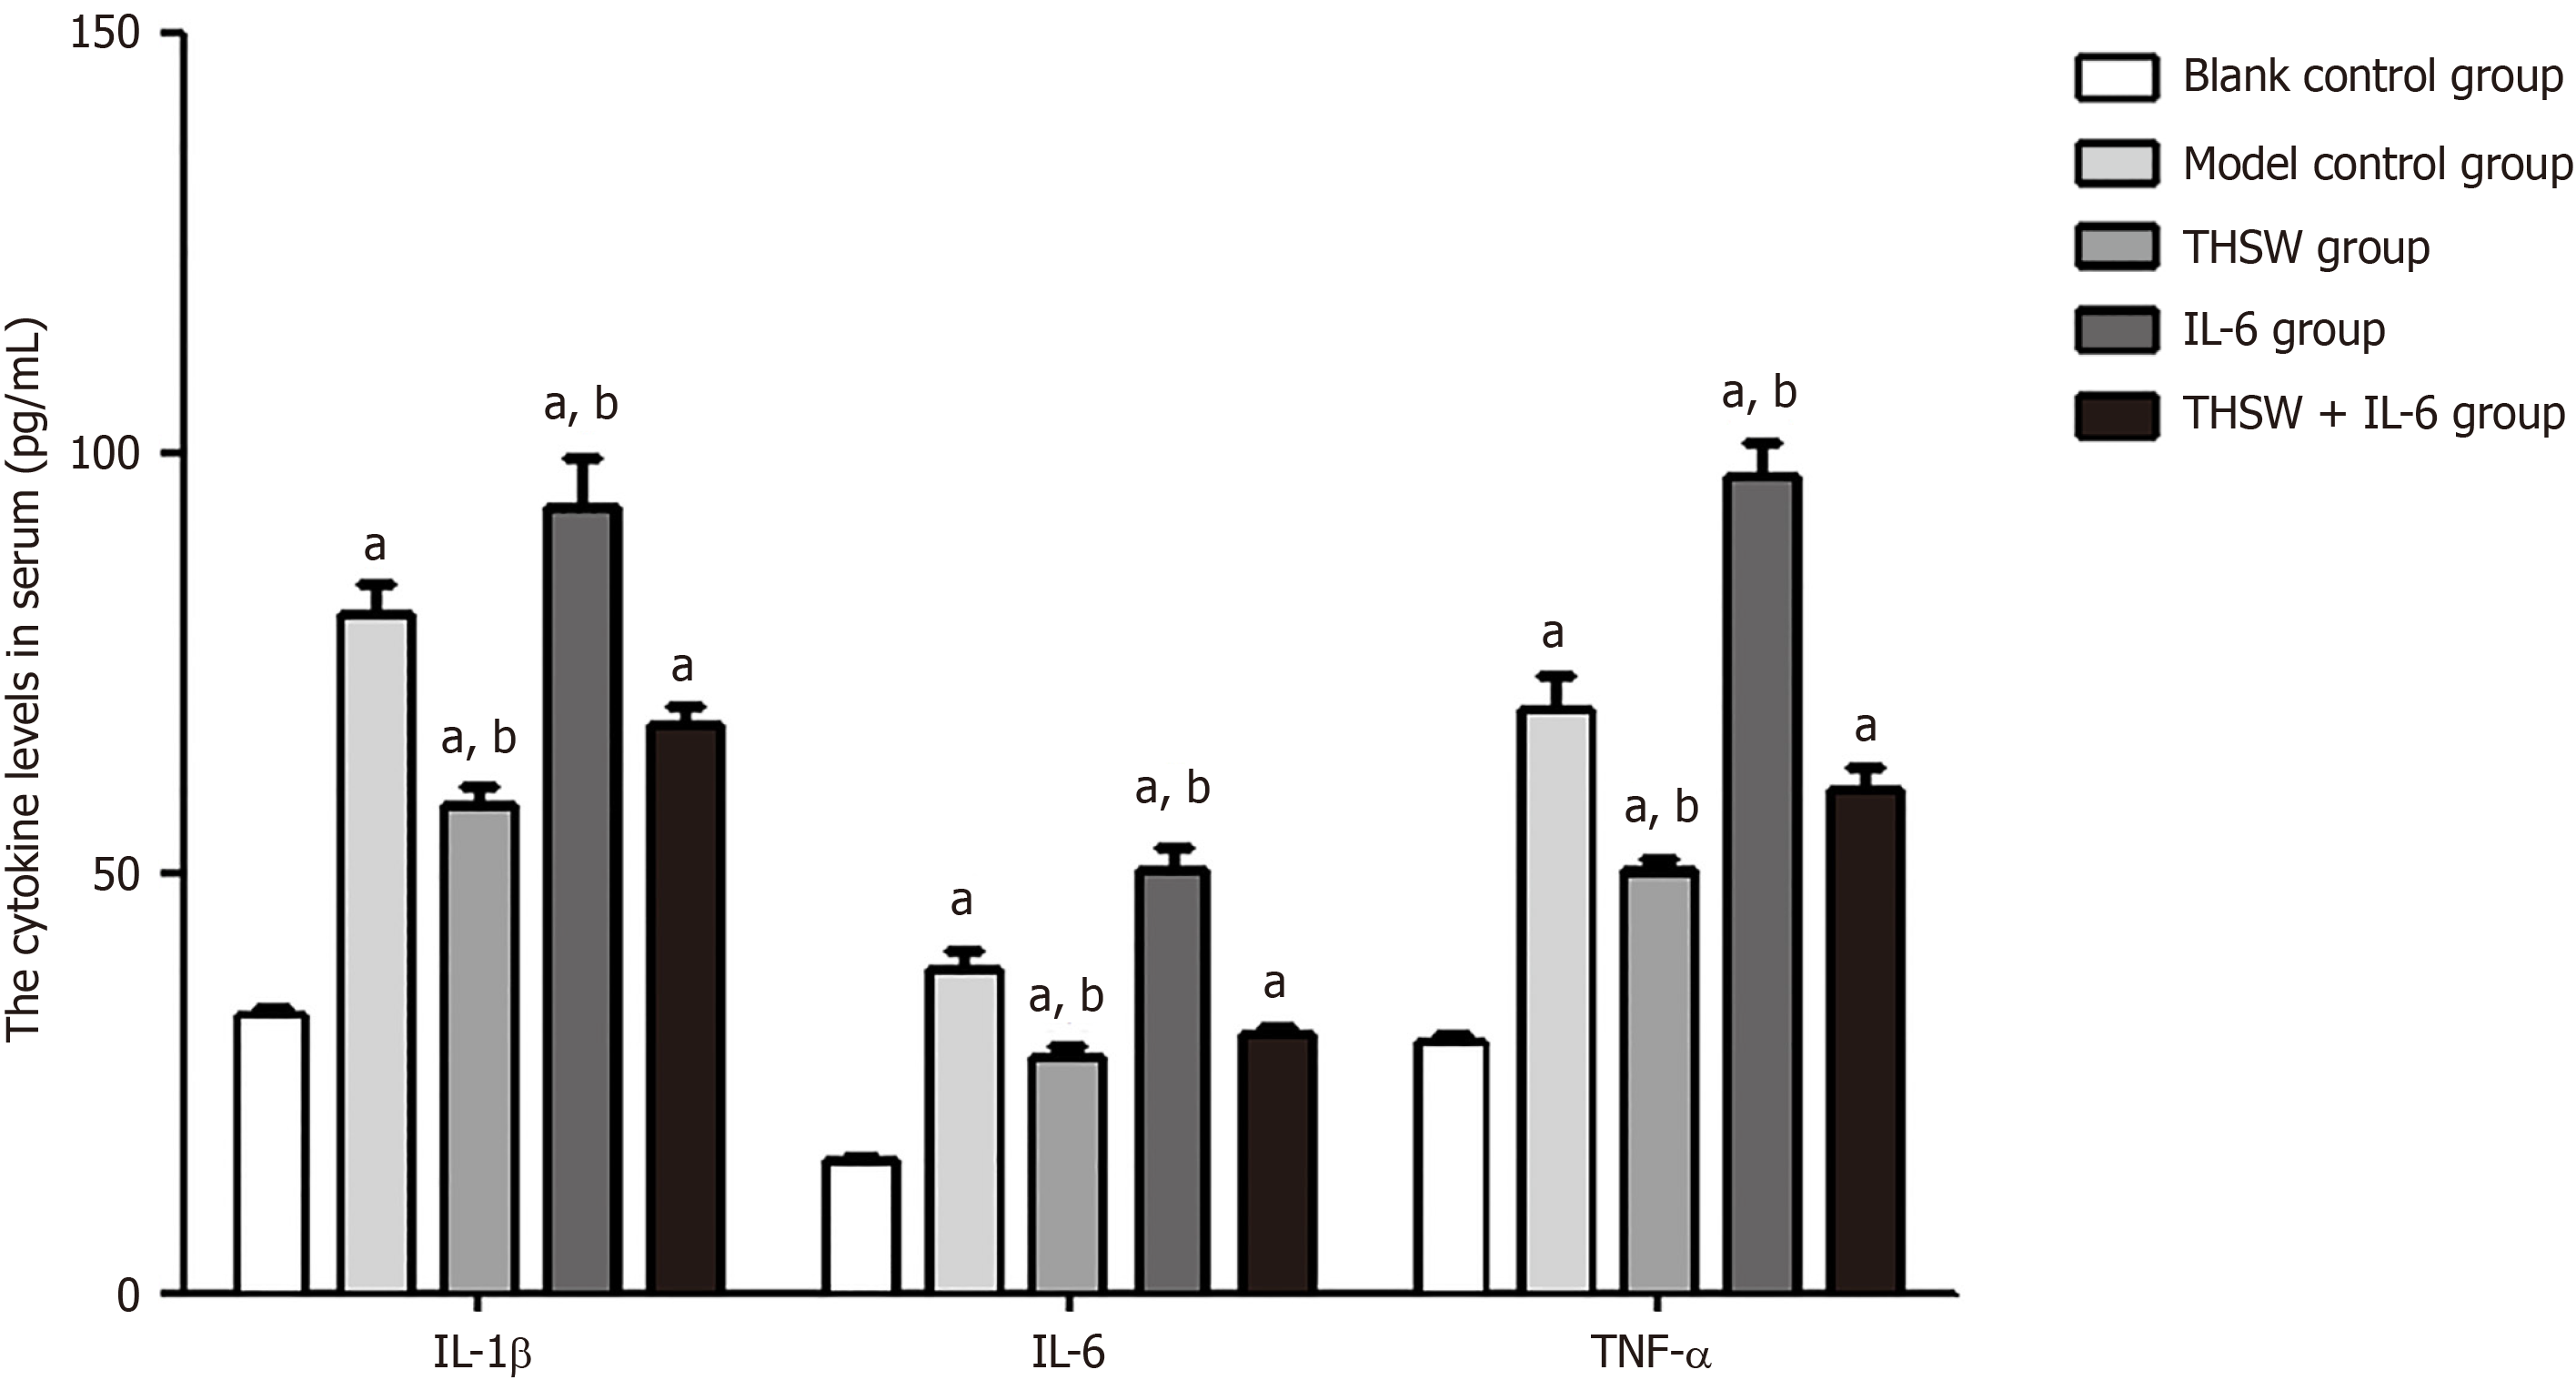
Figure 2 Bar graphs of serum IL-1β, IL-6, and TNF-α levels in mice from different groups.
aP < 0.01, compared with the blank control group; bP < 0.01, compared with the model control group. THSW: Tao Hong Si Wu Tang.
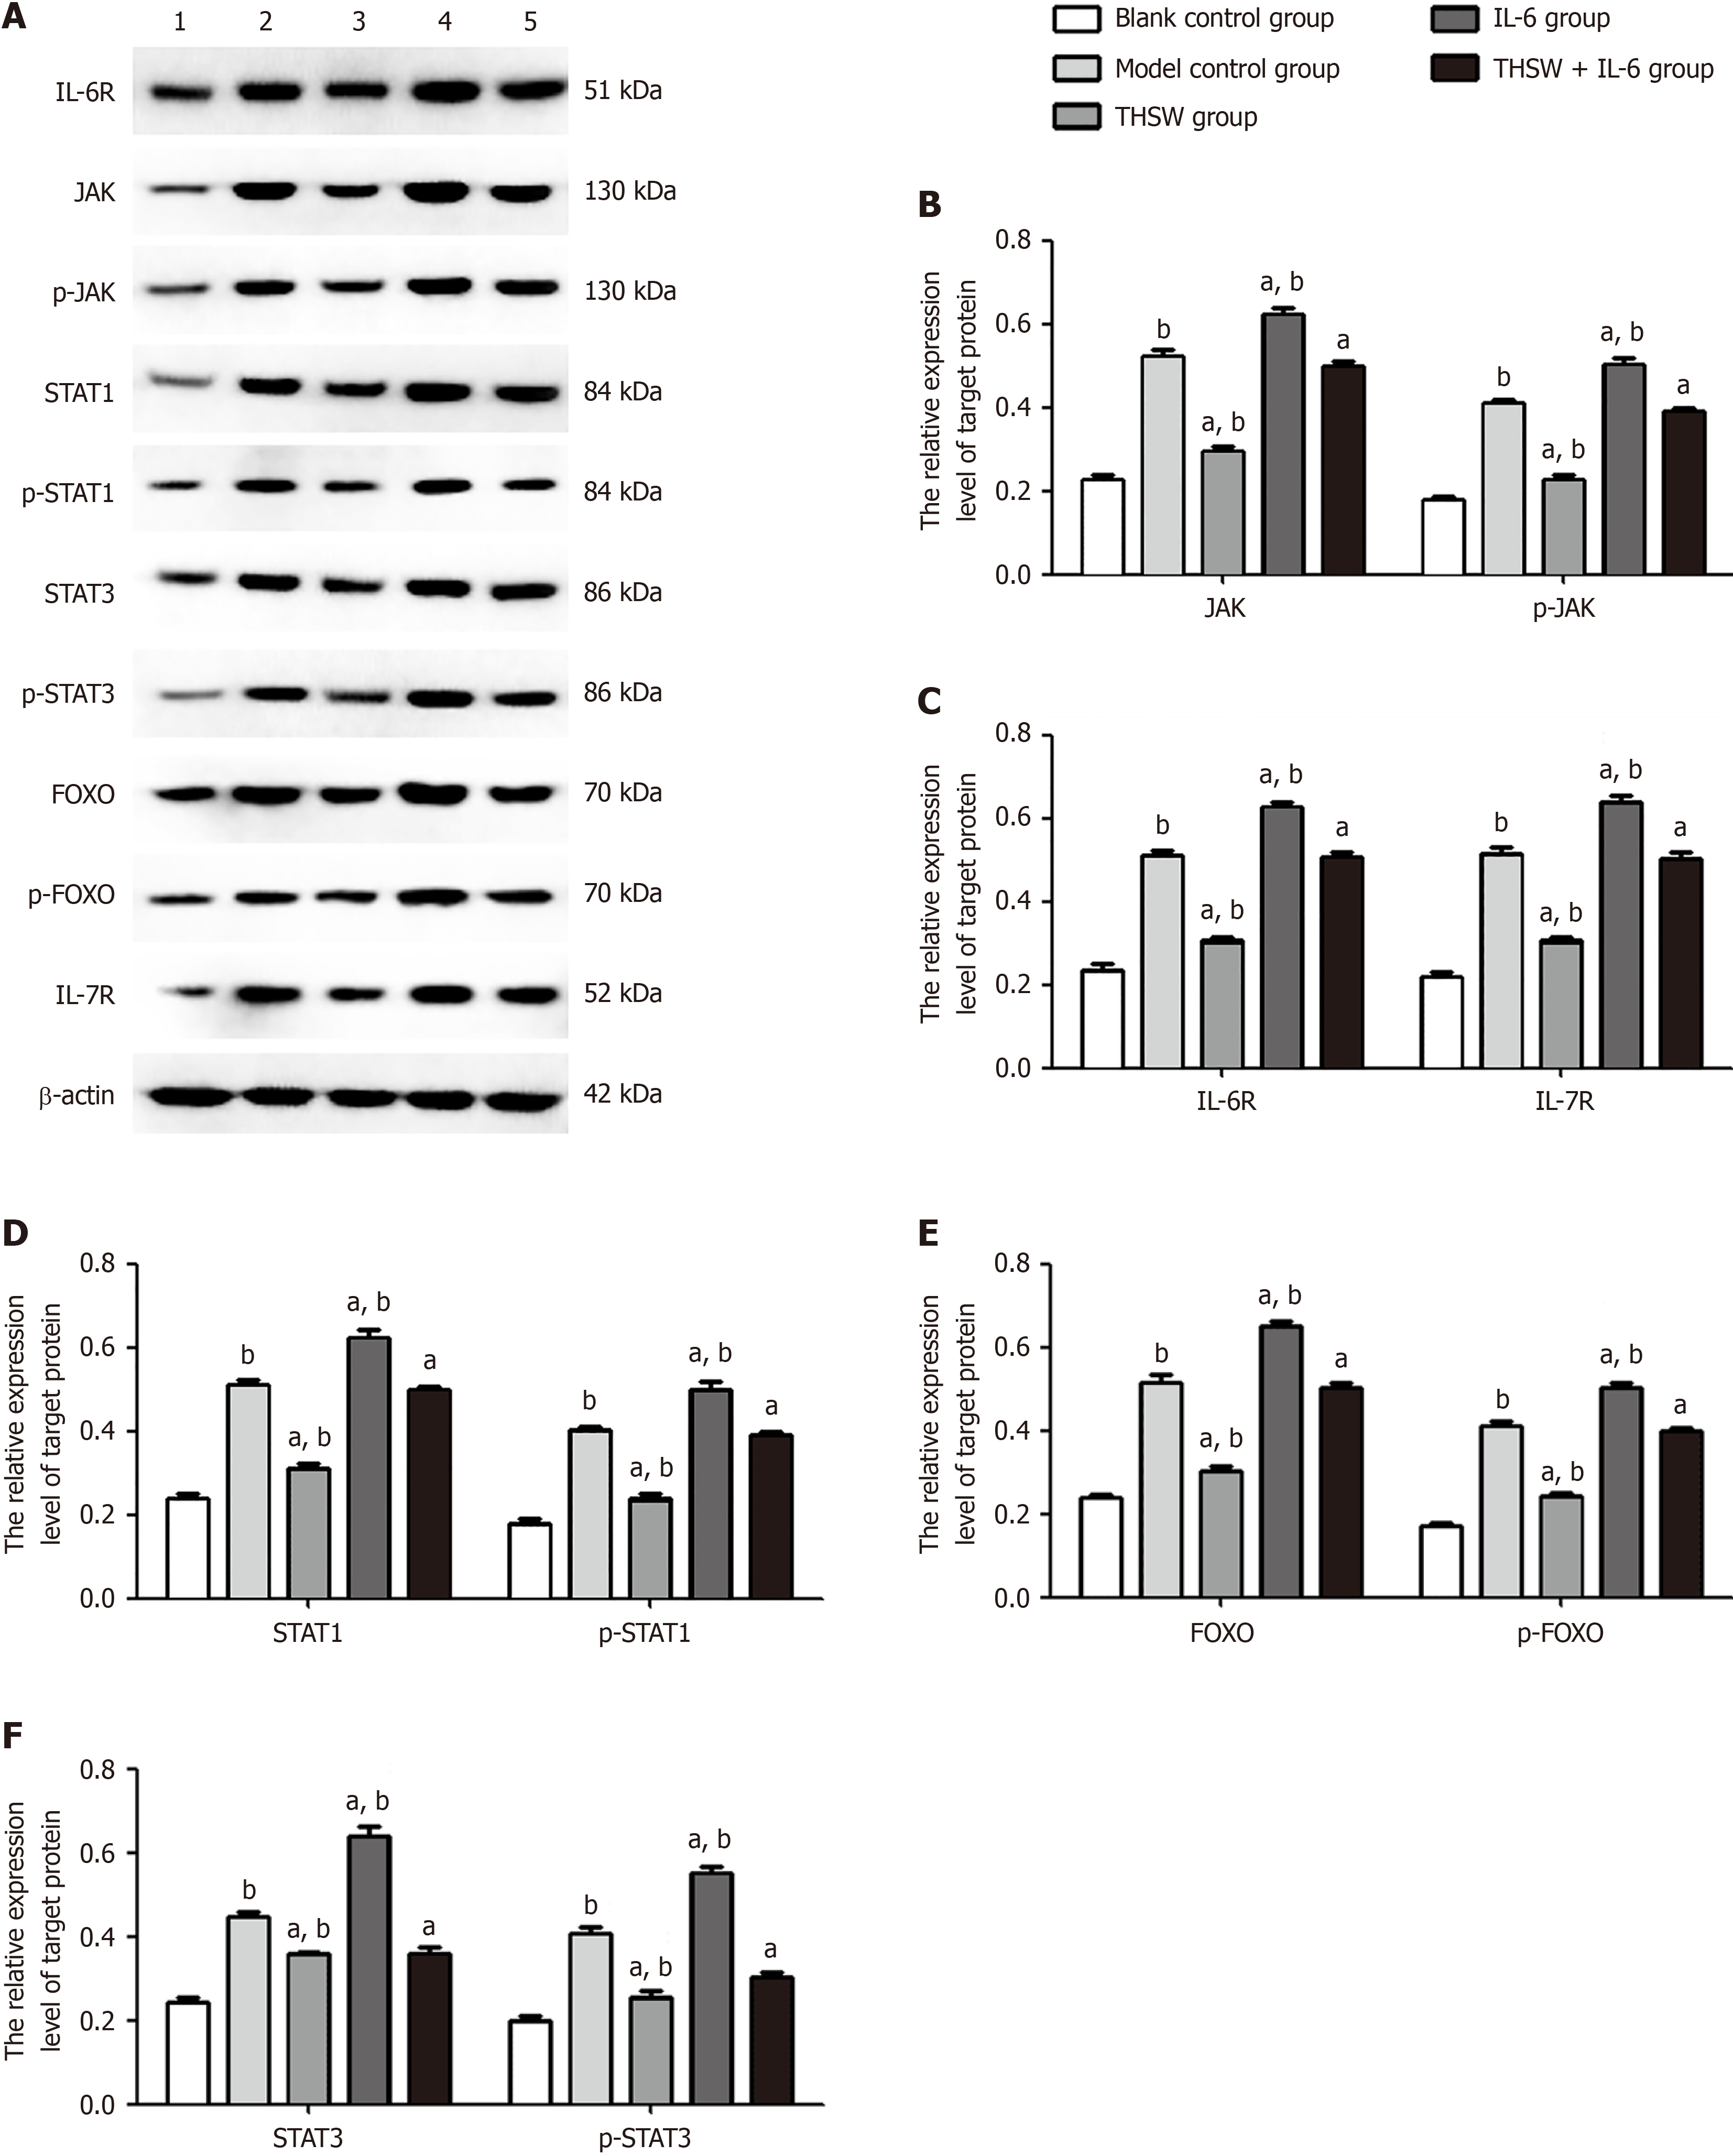
Figure 3 Expression levels of IL-6R, JAK, p-JAK, STAT1/3, p-STAT1/3, FOXO, p-FOXO, and IL-7R in the lung tissues of mice from different groups.
A: 1, blank control group; 2, model control group; 3, Tao Hong Si Wu Tang (THSW) group; 4, Interleukin (IL)-6 group; 5, THSW + IL-6 group; B: JAK and p-JAK; C: IL-6R and IL-7R; D: STAT1 and p-STAT1; E: FOXO and p-FOXO; F: STAT3 and p-STAT3. aP < 0.01, compared with the blank control group; bP < 0.01, compared with the model control group. THSW: Tao Hong Si Wu Tang.
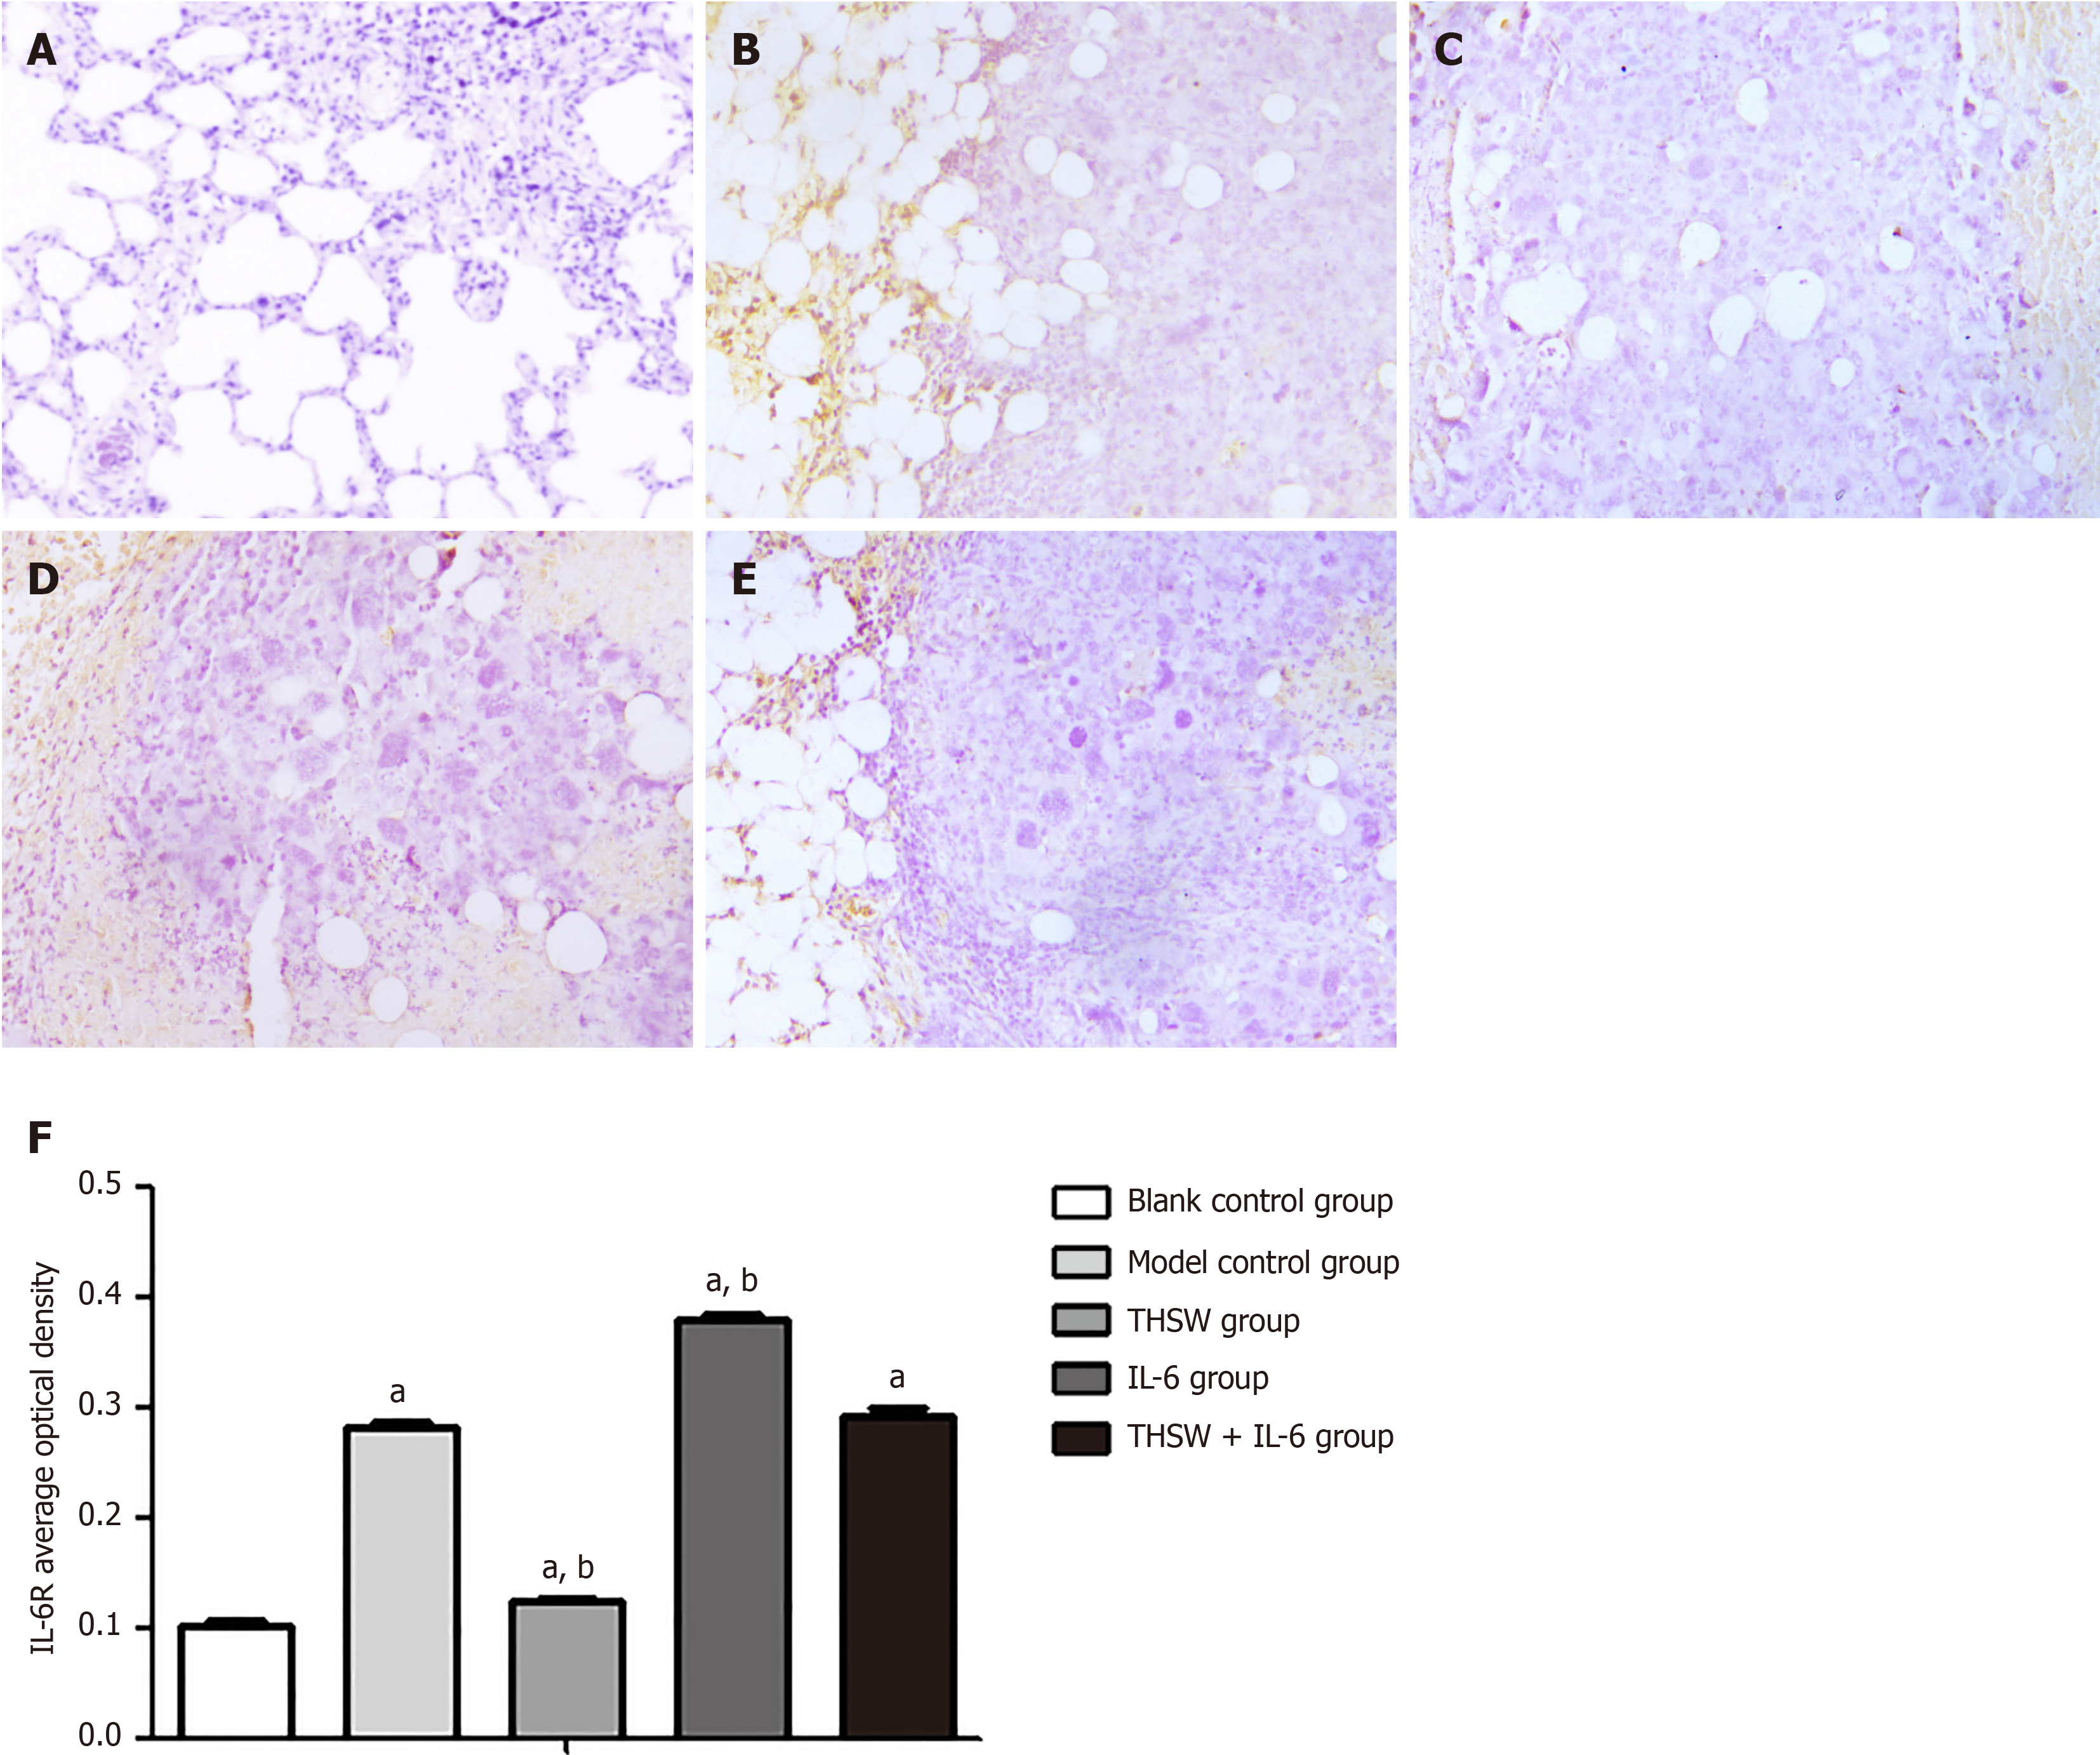
Figure 4 Expression of IL-6 in the lung tissue of mice from different groups.
A: Blank control group; B: Model control group; C: Tao Hong Si Wu Tang (THSW) group; D: IL-6 group; E: THSW + IL-6 group; F: IL-6R average optical density. aP < 0.01, compared with the blank control group; bP < 0.01, compared with the model control group. THSW: Tao Hong Si Wu Tang.
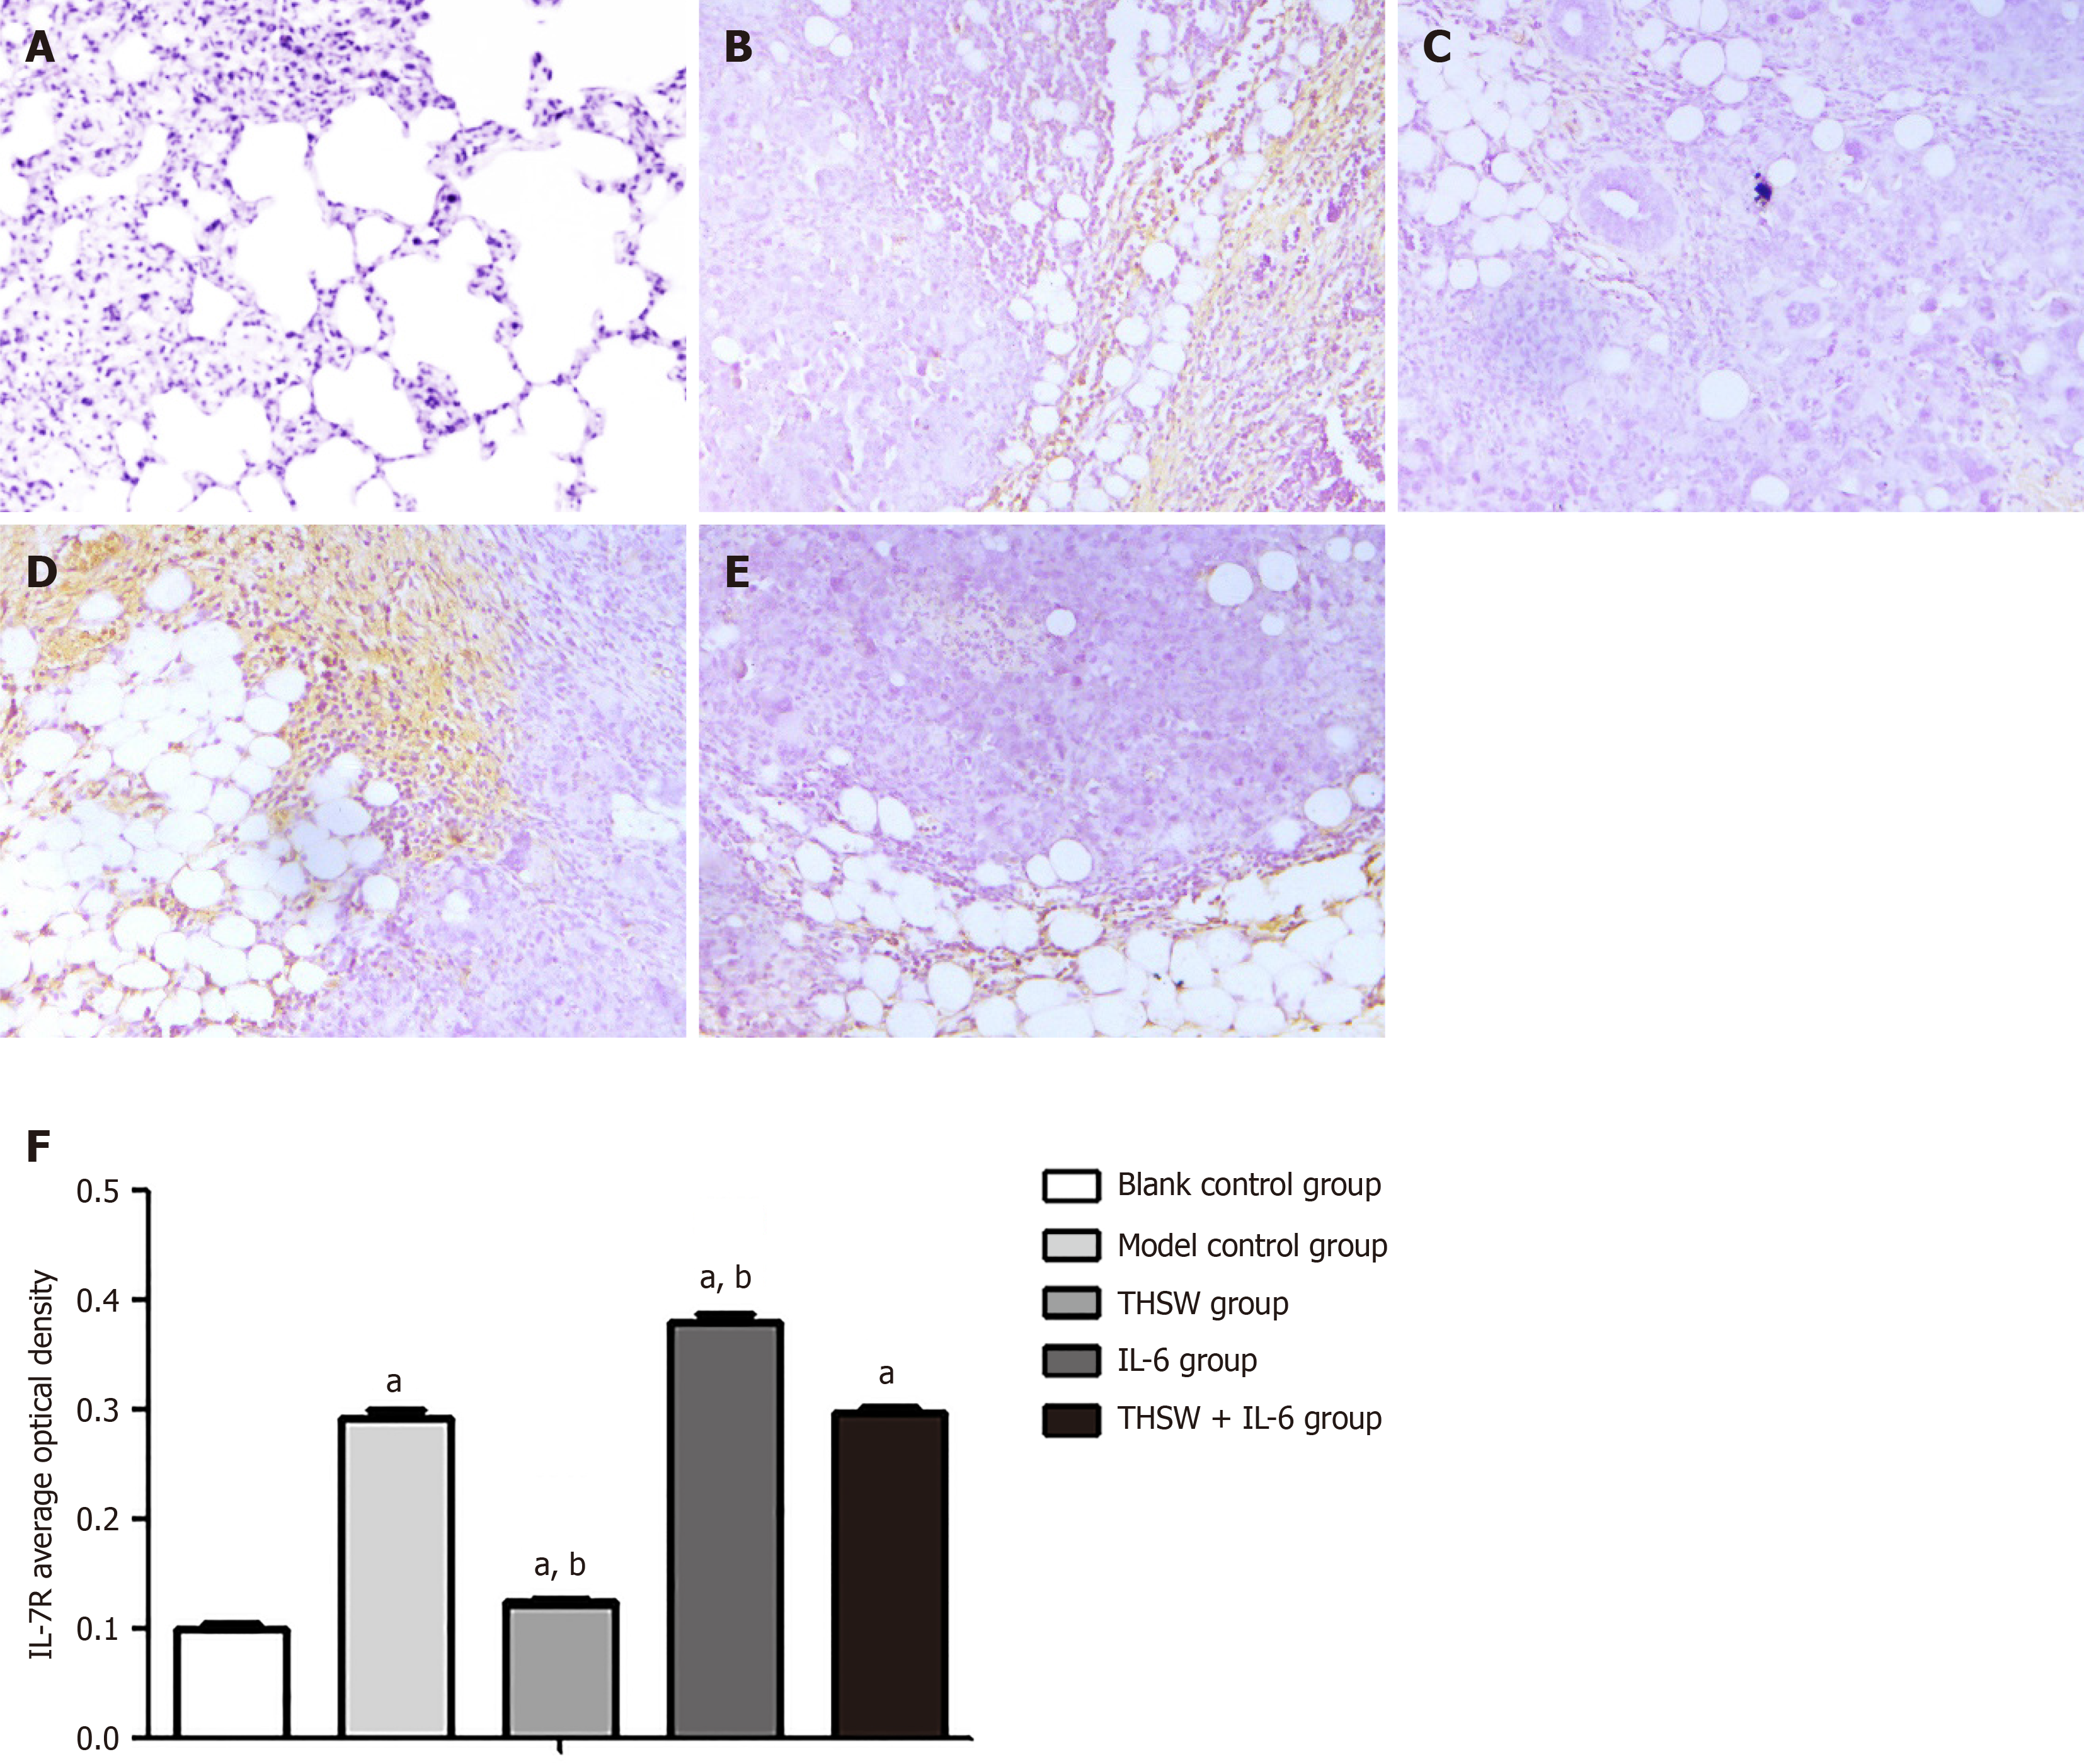
Figure 5 Expression of IL-7R in the lung tissues of mice from different groups.
A: Blank control group; B: Model control group; C: Tao Hong Si Wu Tang (THSW) group; D: IL-6 group; E: THSW + IL-6 group; F: IL-7R average optical density. aP < 0.01, compared with the blank control group; bP < 0.01, compared with the model control group. THSW: Tao Hong Si Wu Tang.
- Citation: Wang GL, Xu YL, Zhao KM, Sui AF, Wang LN, Deng H, Wang G. Anti-inflammatory effects of Tao Hong Si Wu Tang in mice with lung cancer and chronic obstructive pulmonary disease. World J Clin Oncol 2024; 15(9): 1198-1206
- URL: https://www.wjgnet.com/2218-4333/full/v15/i9/1198.htm
- DOI: https://dx.doi.org/10.5306/wjco.v15.i9.1198


