Copyright
©The Author(s) 2024.
World J Clin Oncol. Sep 24, 2024; 15(9): 1177-1187
Published online Sep 24, 2024. doi: 10.5306/wjco.v15.i9.1177
Published online Sep 24, 2024. doi: 10.5306/wjco.v15.i9.1177
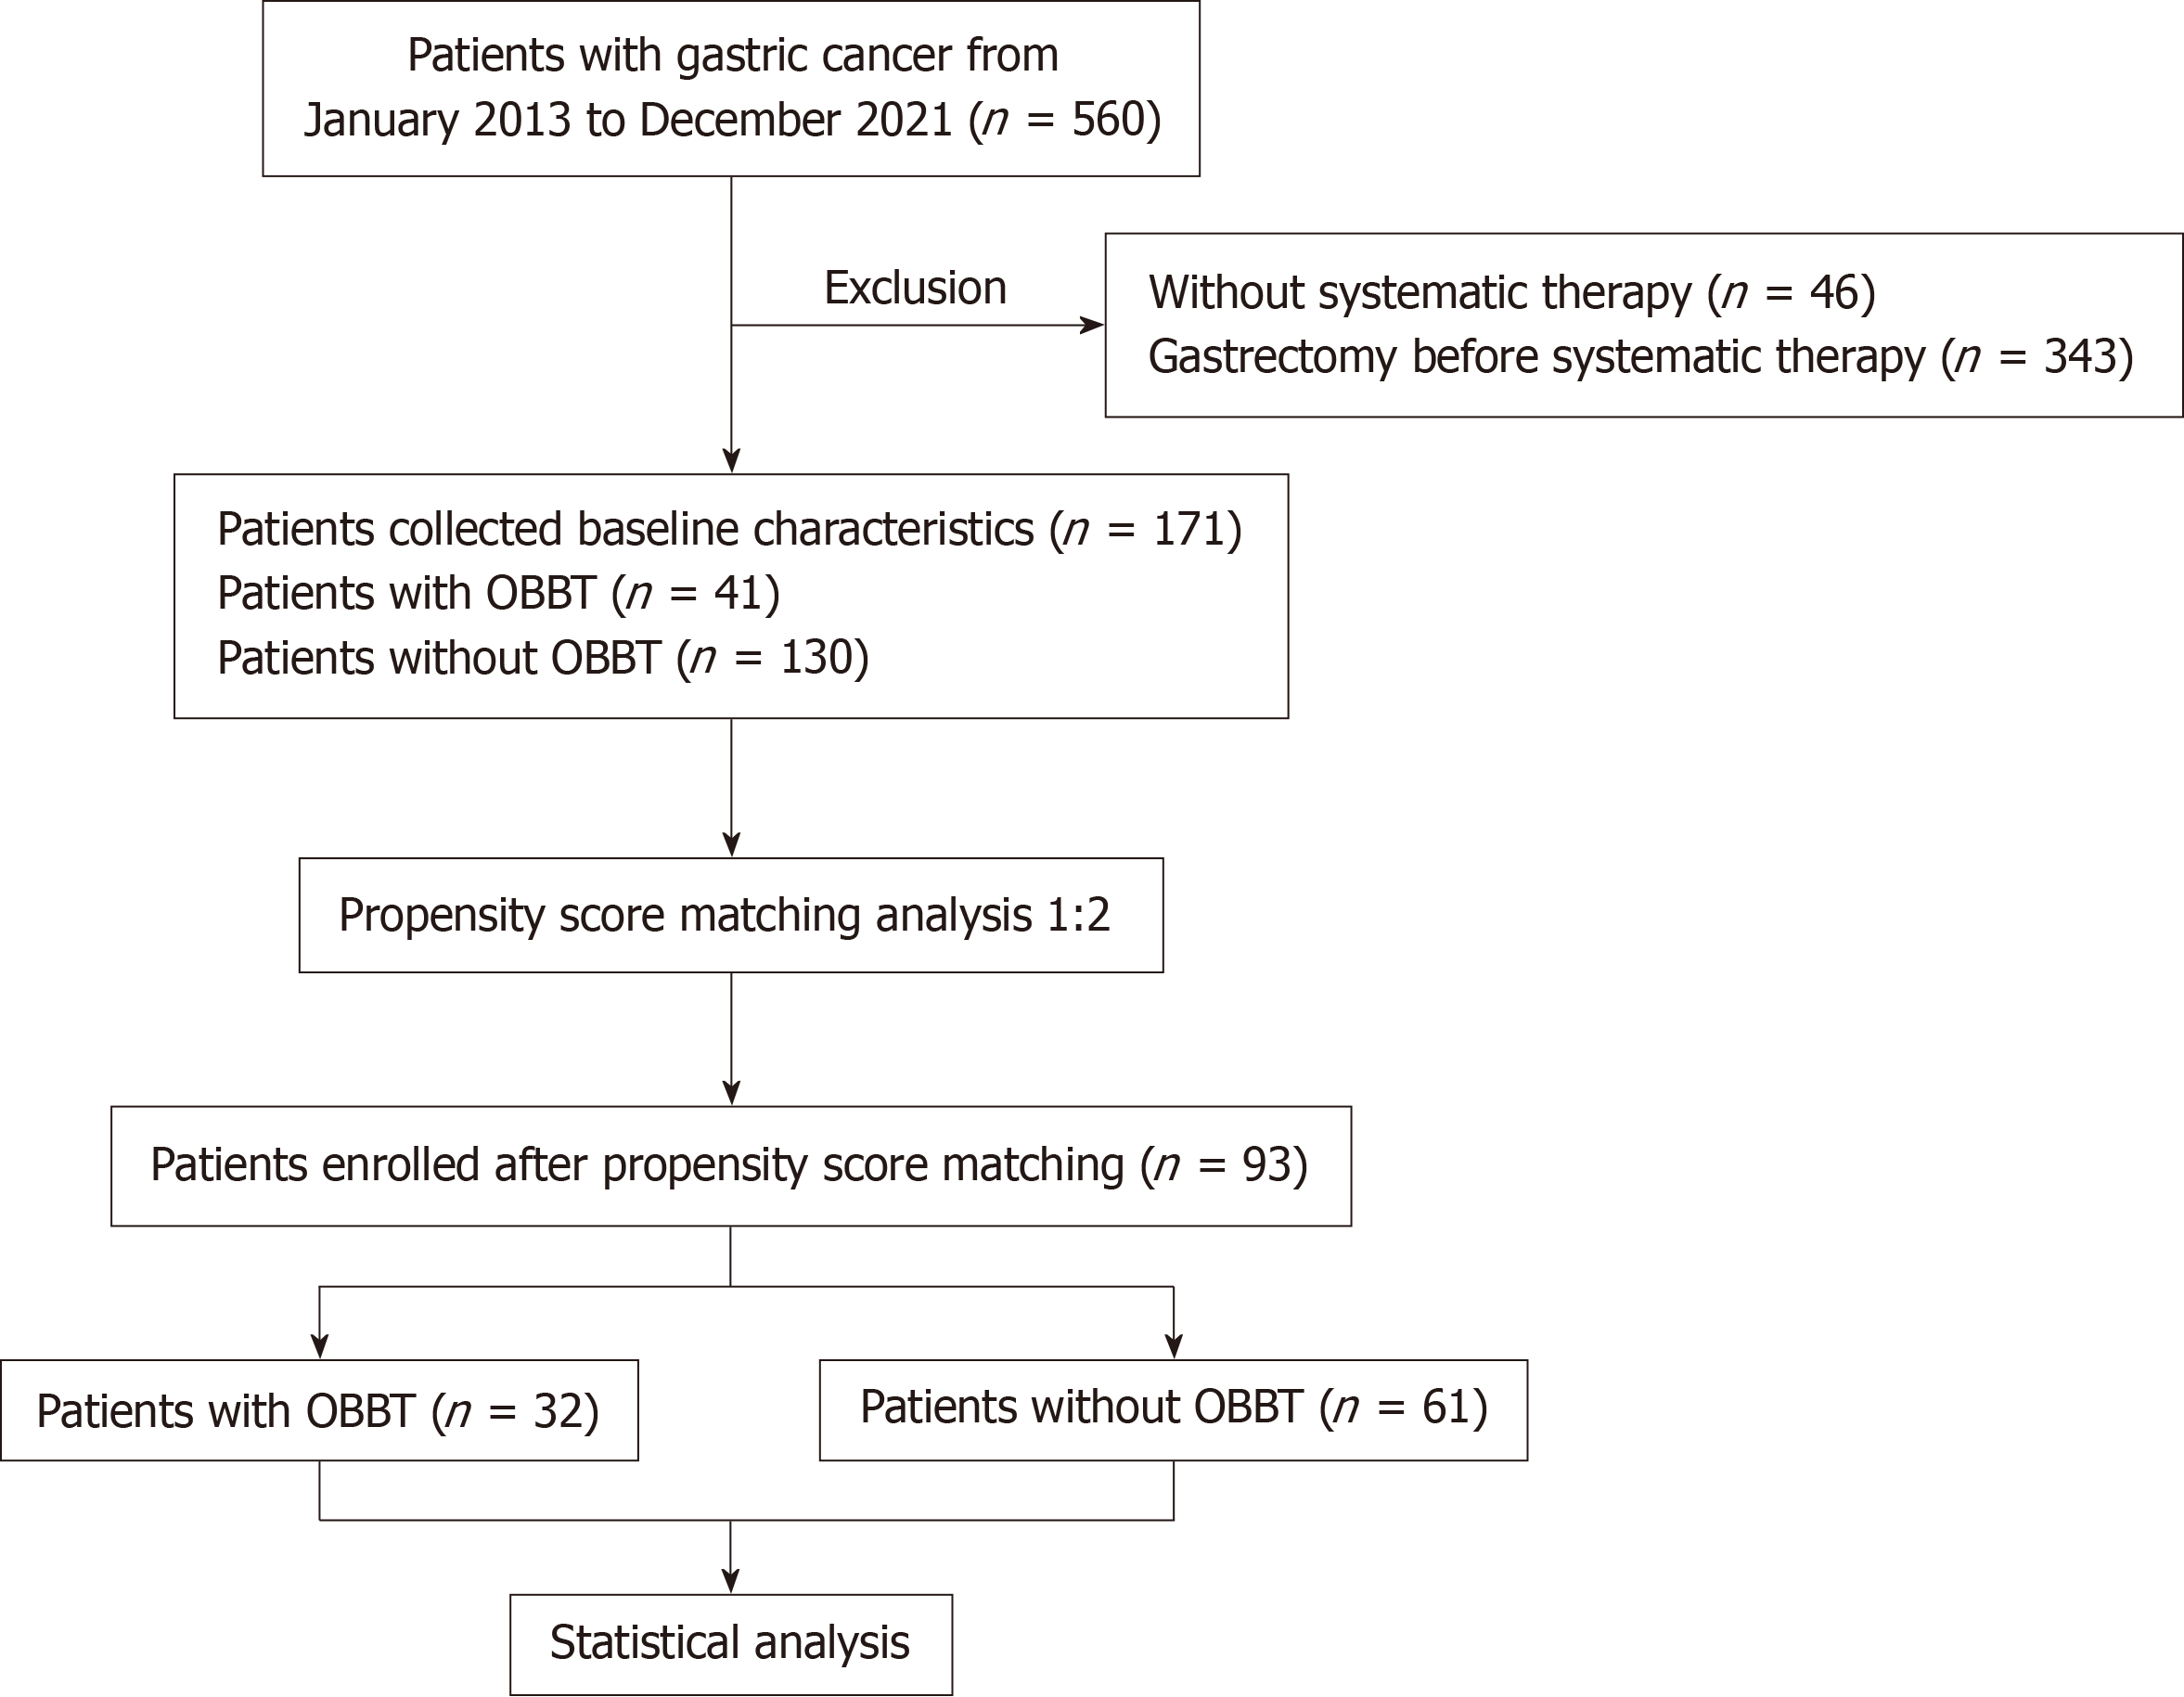
Figure 1 Flow diagram of selection of eligible patients.
OBBT: Overt bleeding before treatment.
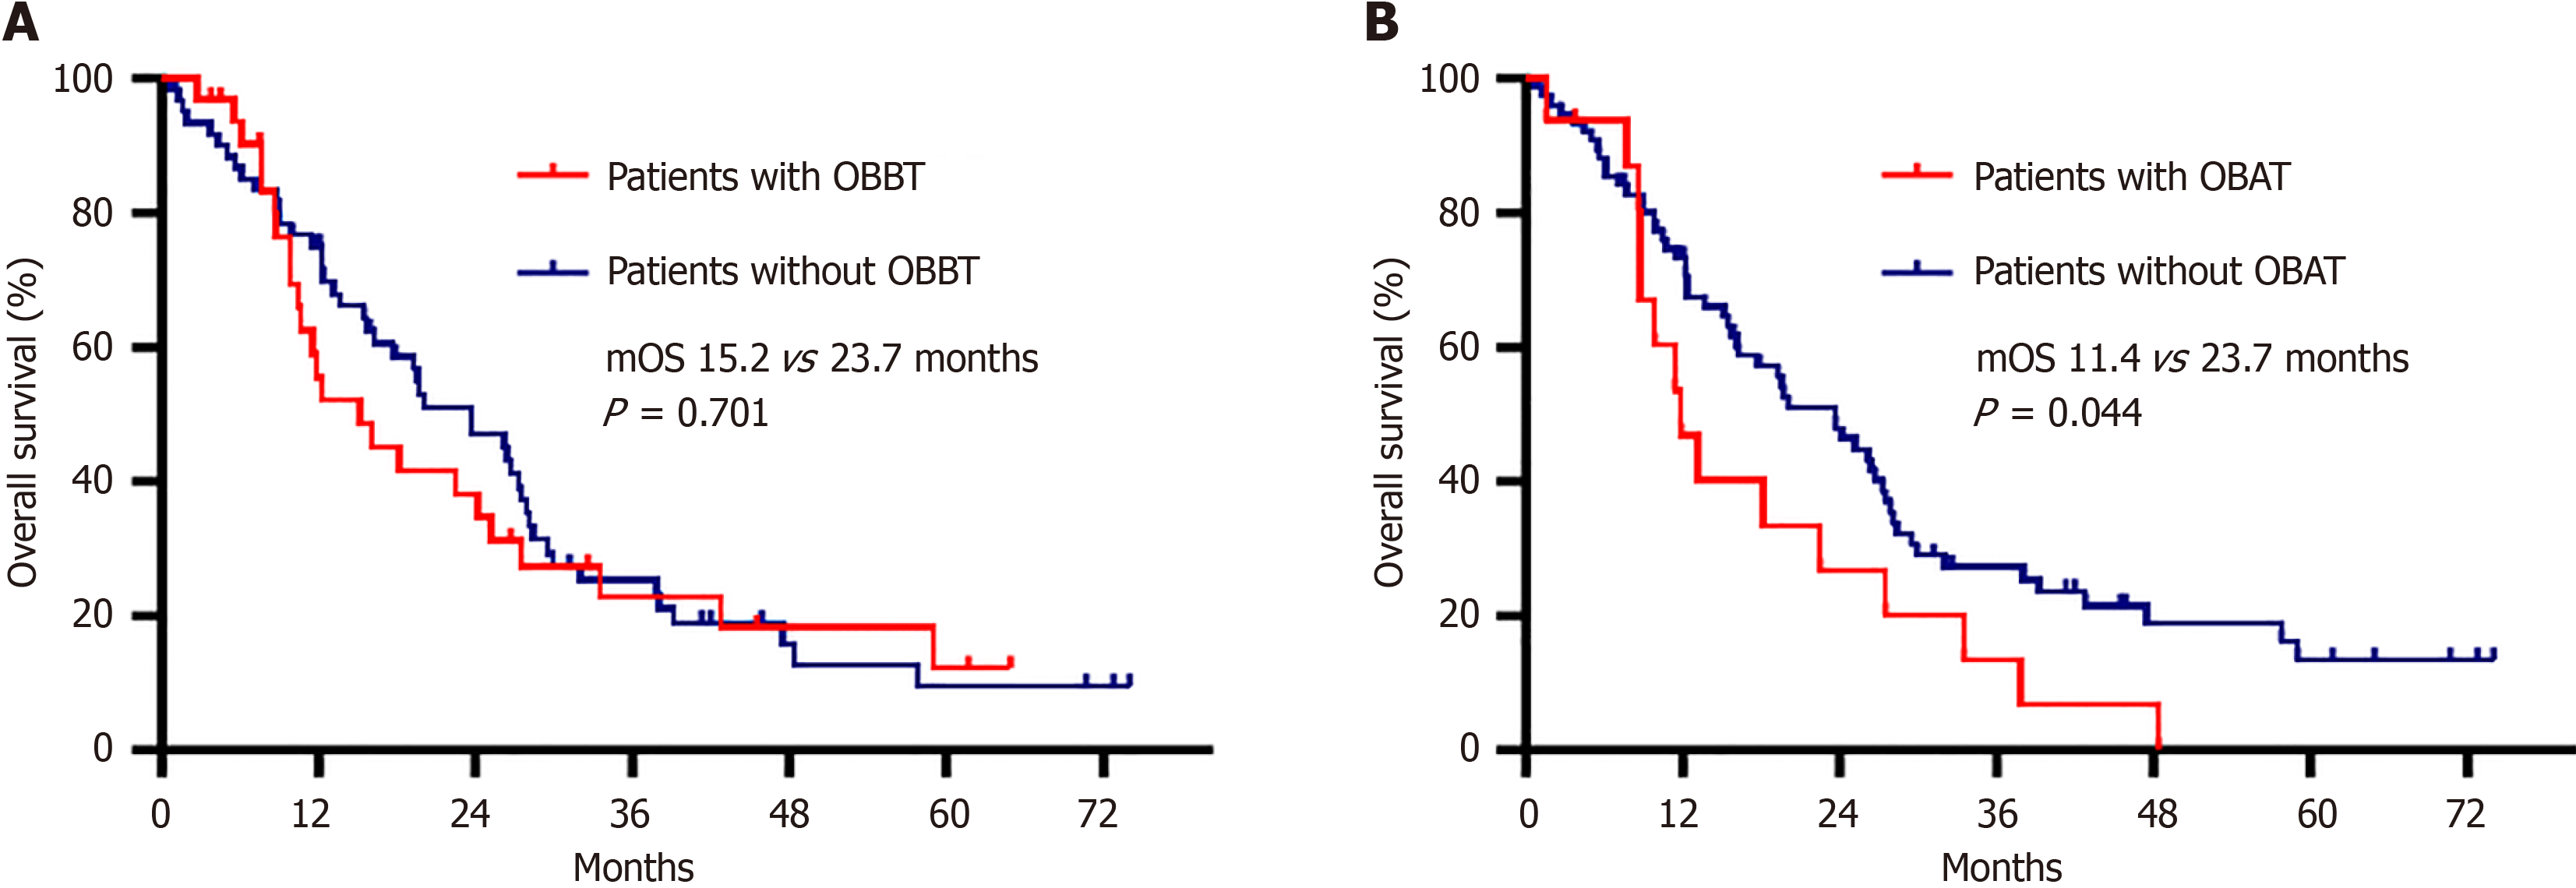
Figure 2 Kaplan Meier curves of overall survival.
A: Overall survival (OS) of gastric cancer (GC)/gastroesophageal junction cancer (GEJC) patients according to overt bleeding before treatment; B: OS of GC/GEJC patients according to overt bleeding after treatment. OBBT: Overt bleeding before treatment; OBAT: Overt bleeding after treatment; mOS: Median overall survival.
- Citation: Yao YH, Zhang H, Xiao Y, Liu ZT, Shi YY, Yu JY, Li Q, Cao BS. Systematic treatment in gastric cancer patients with overt bleeding: A propensity score matching analysis. World J Clin Oncol 2024; 15(9): 1177-1187
- URL: https://www.wjgnet.com/2218-4333/full/v15/i9/1177.htm
- DOI: https://dx.doi.org/10.5306/wjco.v15.i9.1177


