Copyright
©The Author(s) 2024.
World J Clin Oncol. Aug 24, 2024; 15(8): 1102-1109
Published online Aug 24, 2024. doi: 10.5306/wjco.v15.i8.1102
Published online Aug 24, 2024. doi: 10.5306/wjco.v15.i8.1102
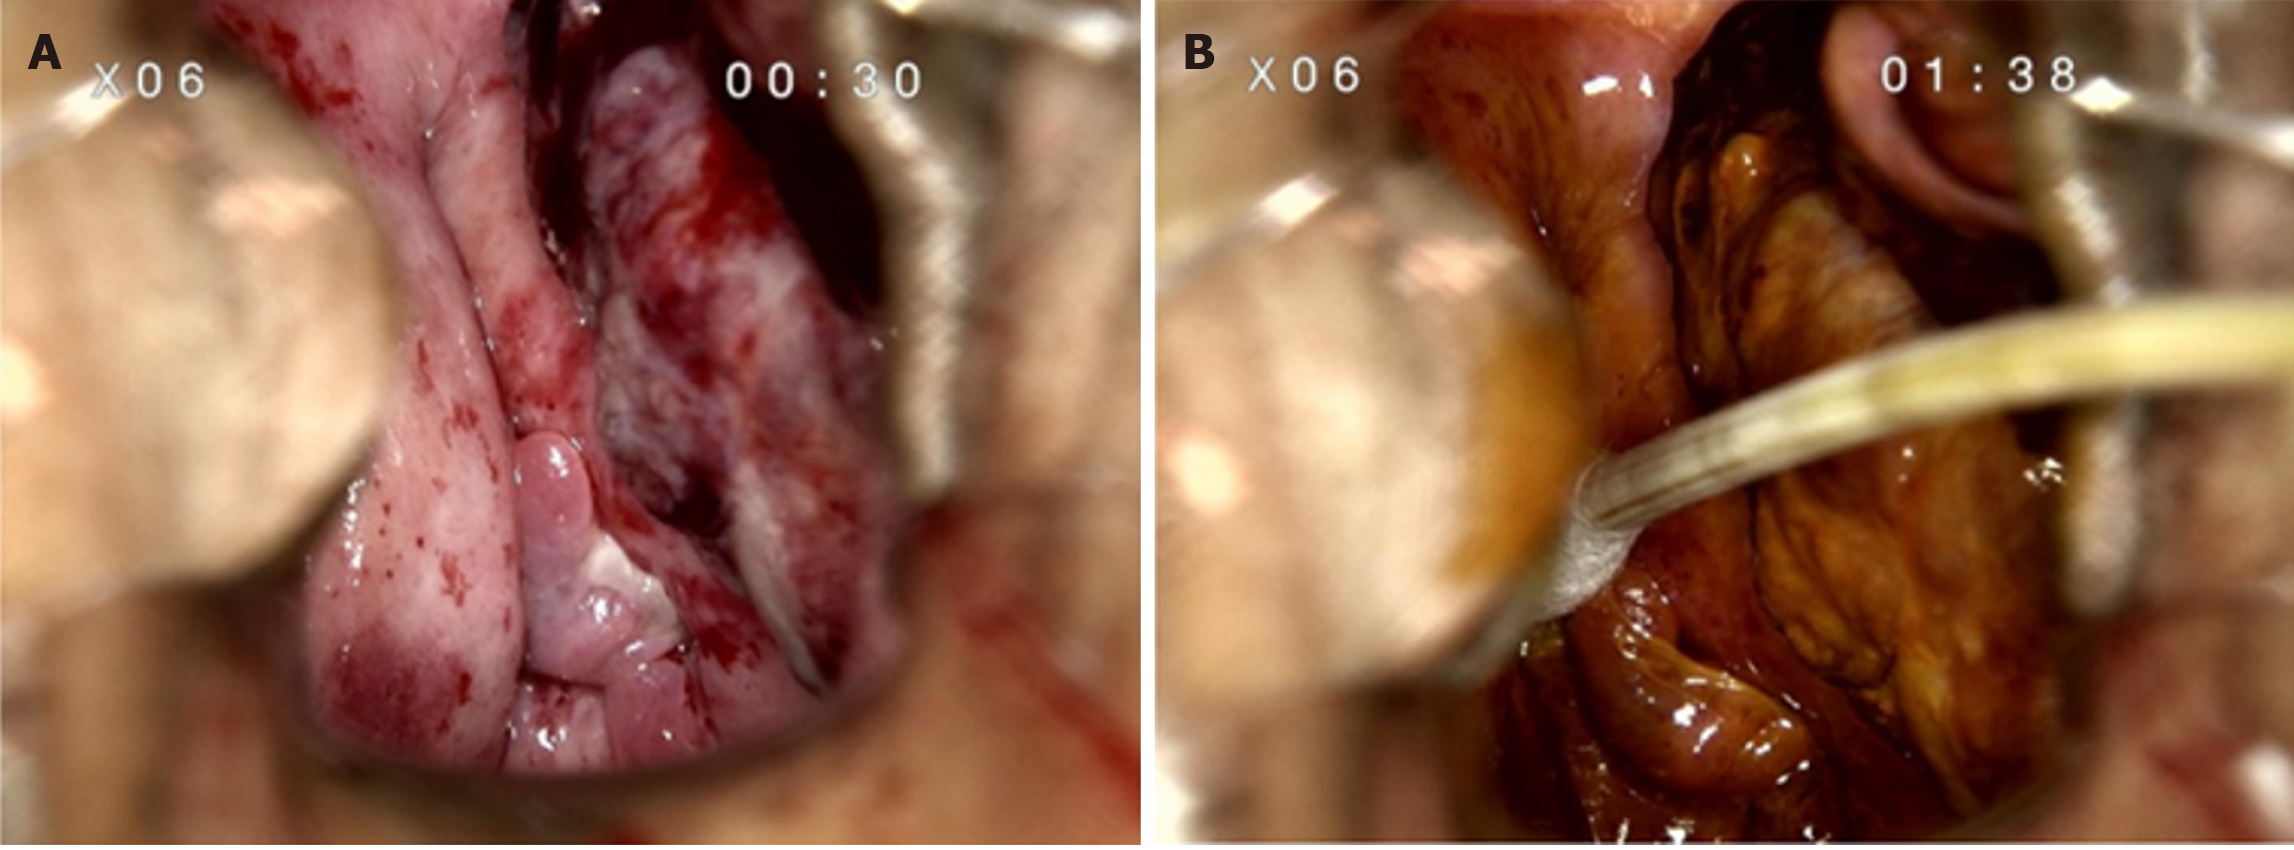
Figure 1 Colposcopy images.
A: A mass in the left anterior vaginal wall involving the left fornix to the vaginal opening, measuring 4 cm × 5.0 cm; B: Iodine negative areas.
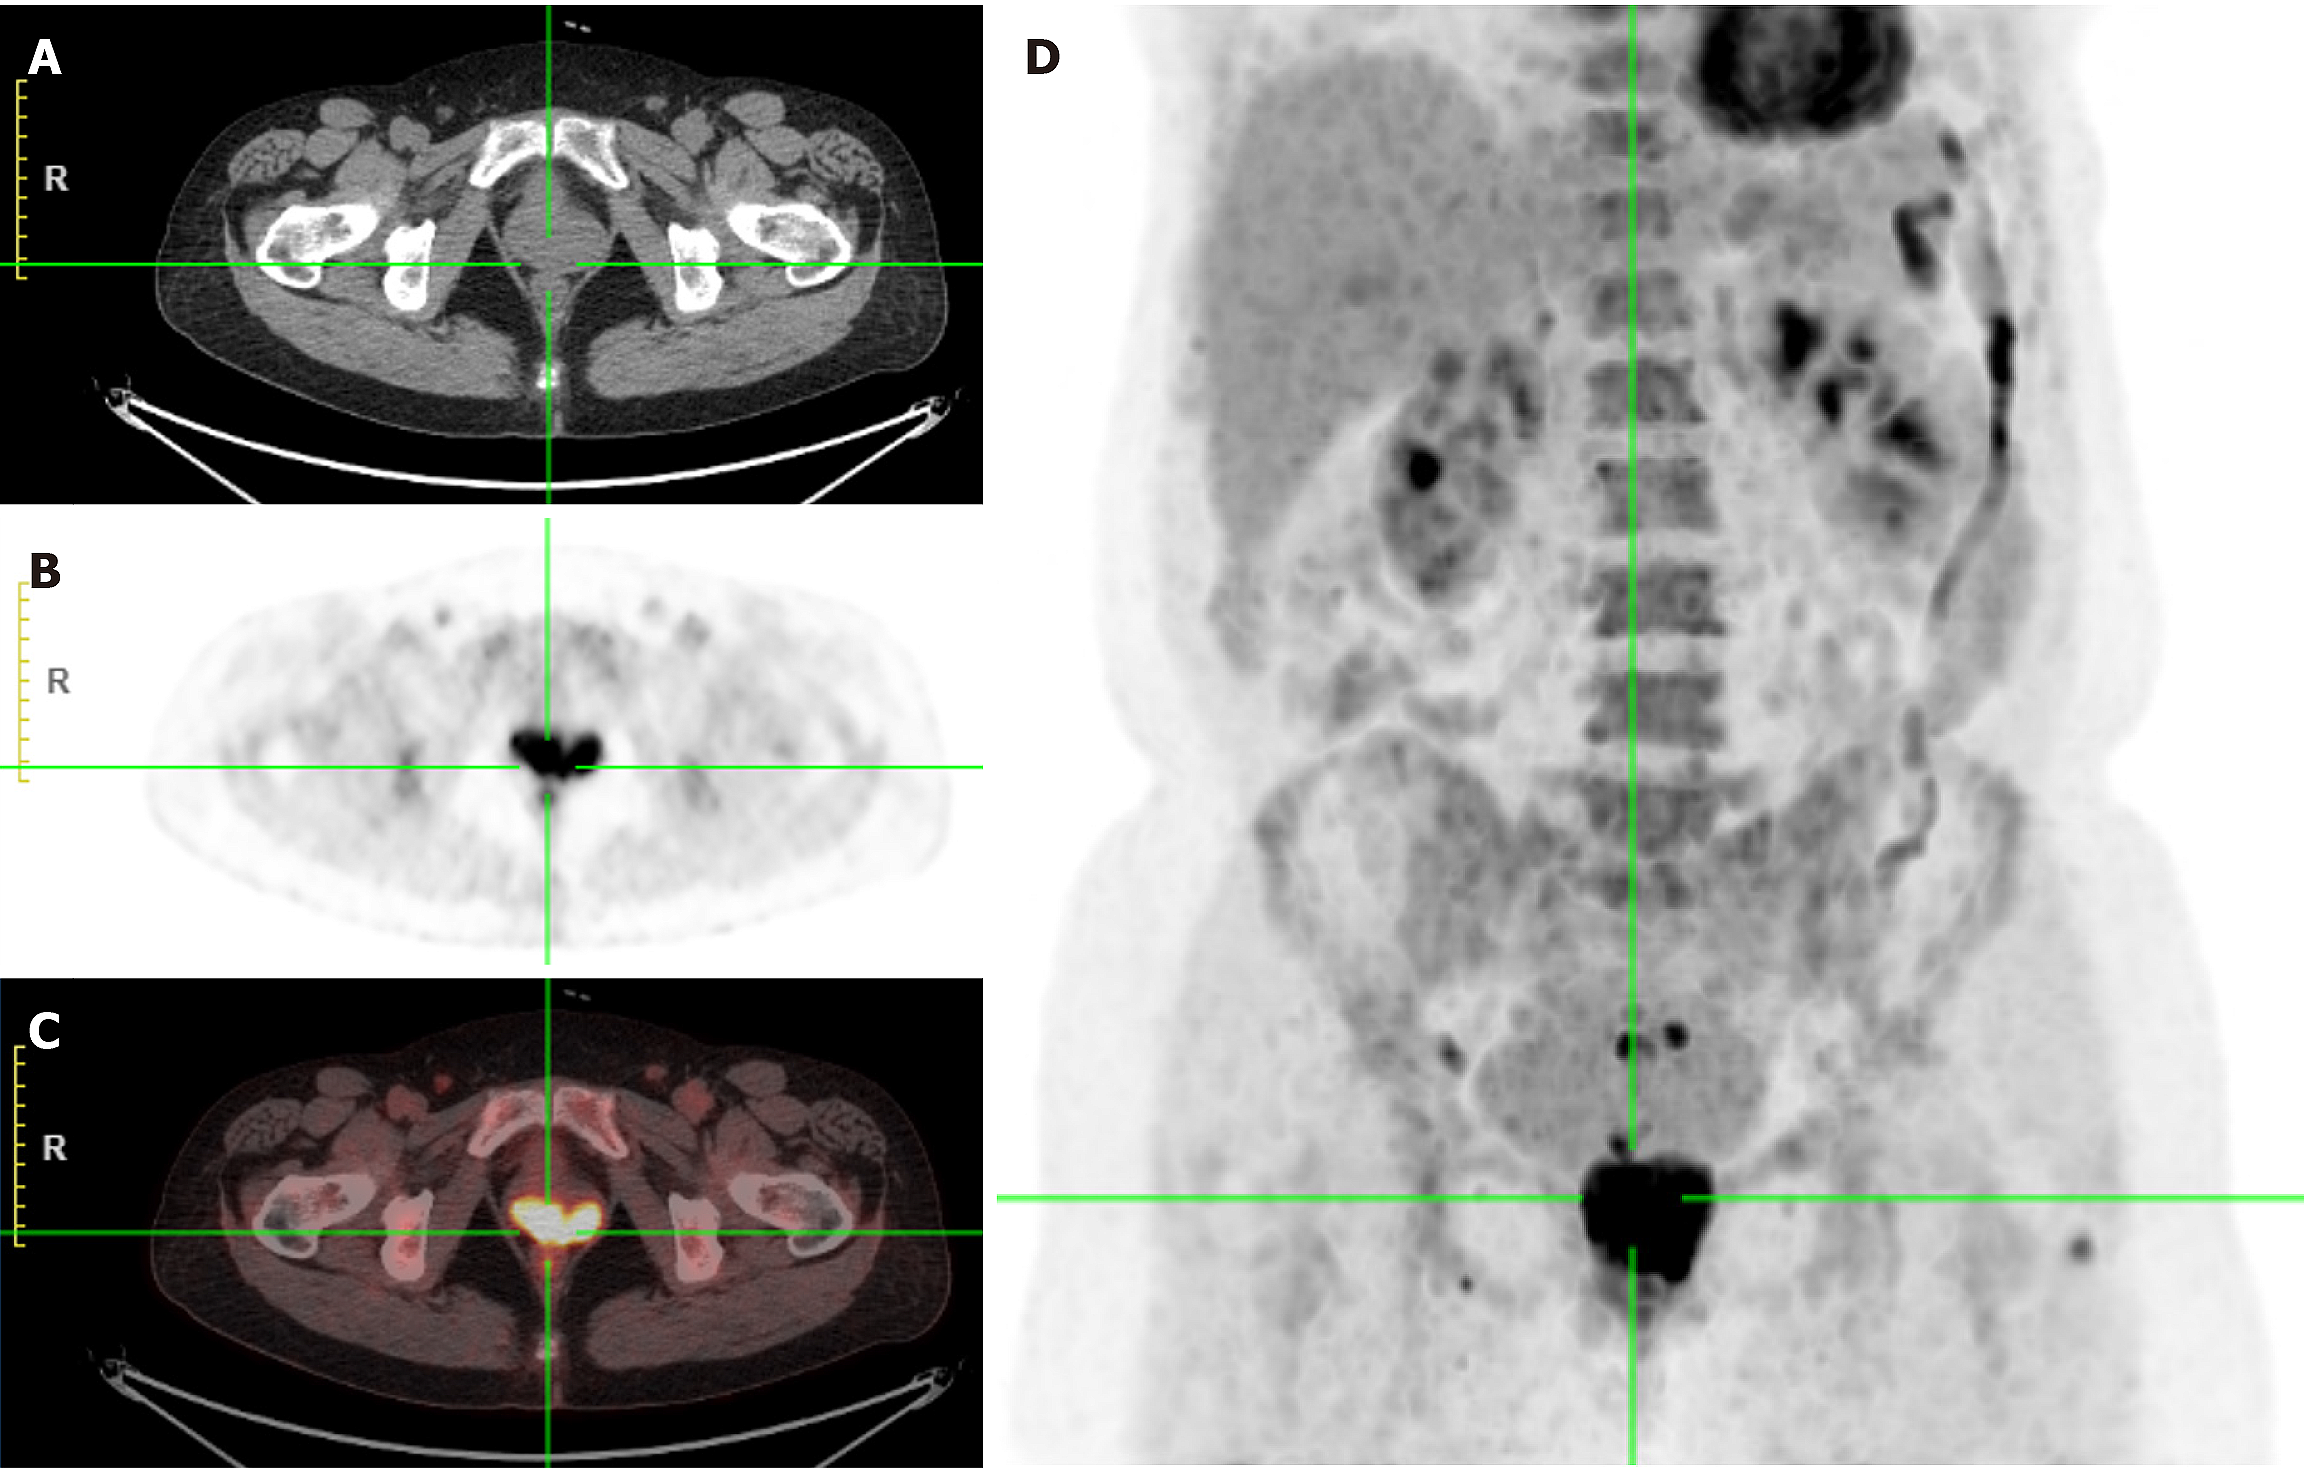
Figure 2 Positron emission tomography/computed tomography shows vaginal soft tissue mass with increased fluorodeoxyglucose metabolism, the first consideration for malignancy.
A: Computed tomography (CT) scan; B: Positron emission tomography (PET) scan; C: Fused PET-CT image; D: PET scan (maximum intensity projections image).
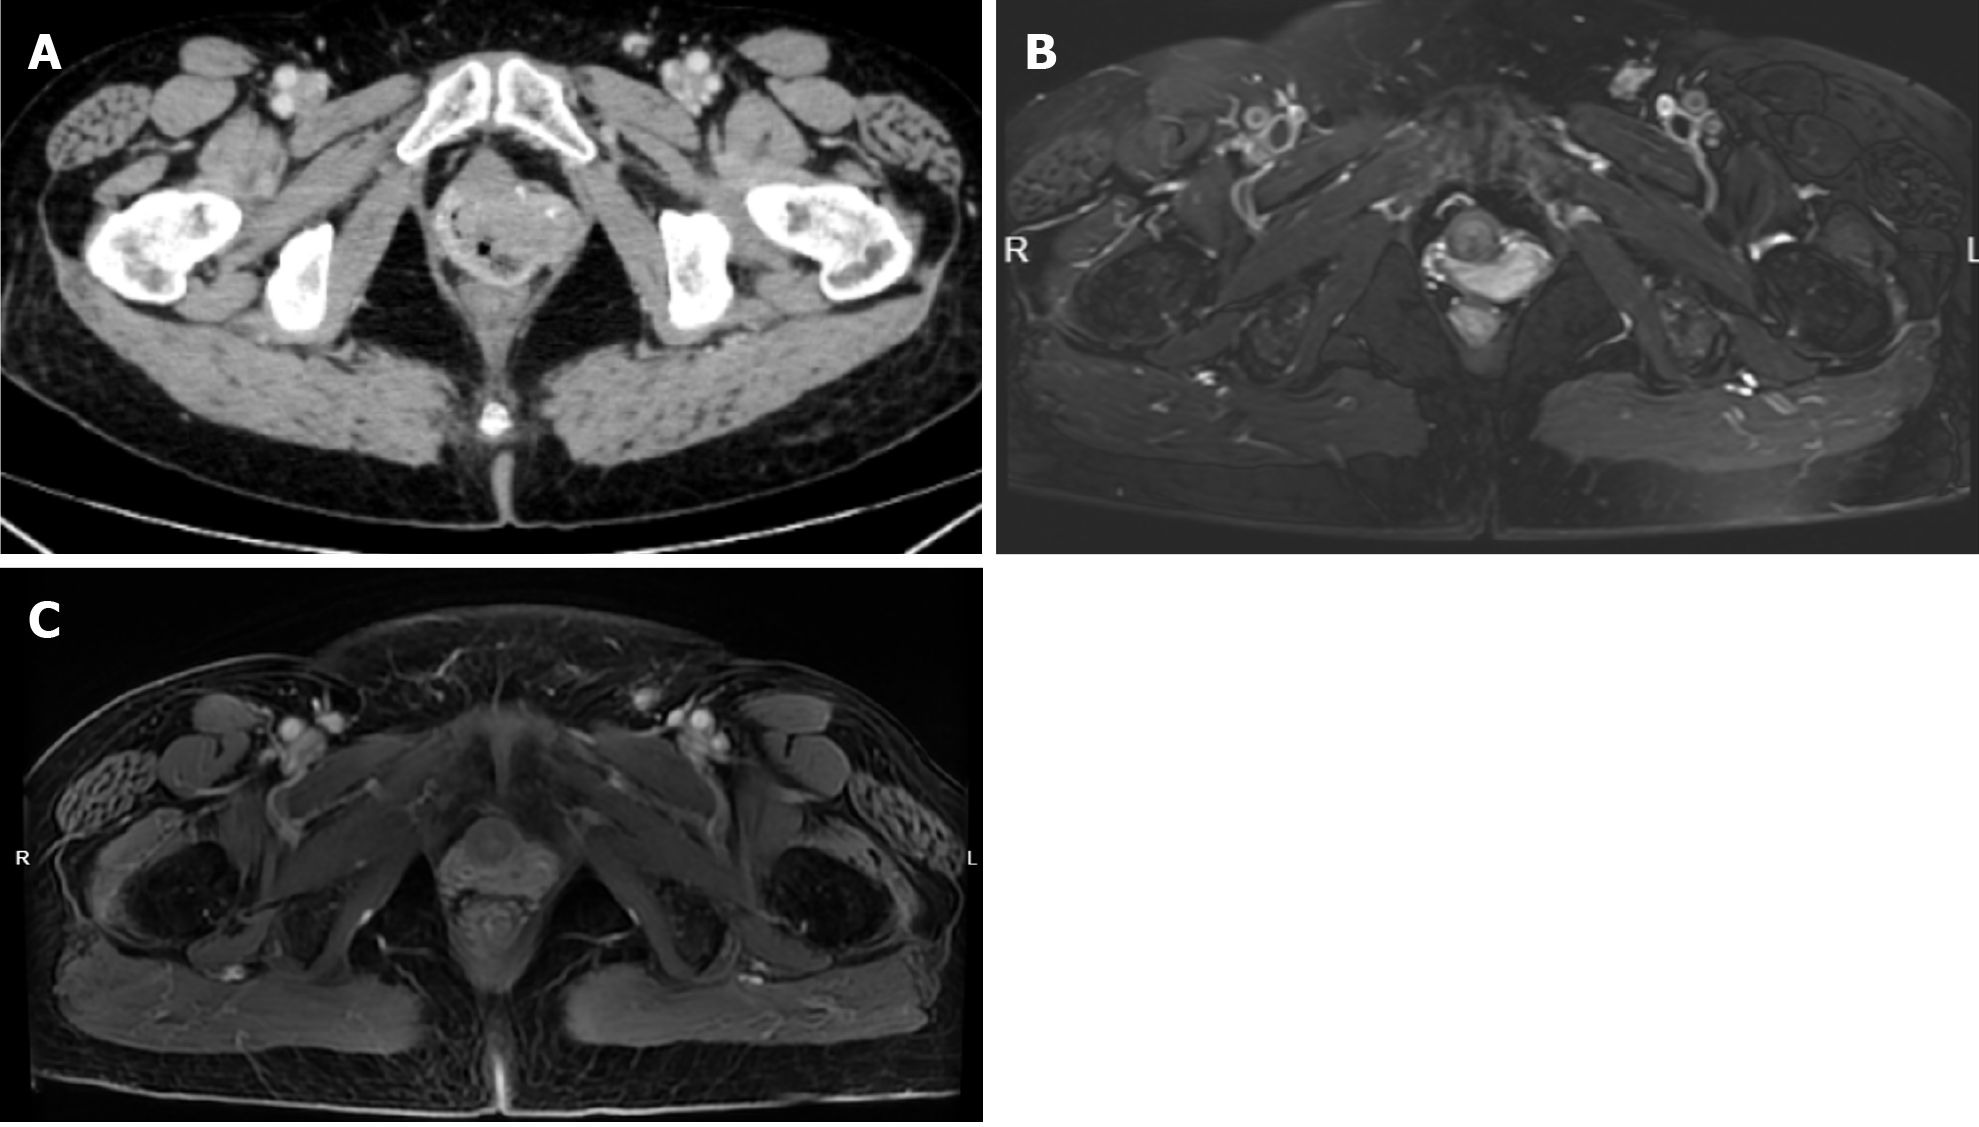
Figure 3 Morphological assessment.
A: Pelvic enhanced computed tomography before treatment shows occupation of the left and anterior vaginal walls, maximum cross-section range 40 mm × 30 mm; B: Enhanced magnetic resonance image after 3 cycles of chemotherapy shows thickening of the left anterior vaginal wall; C: Enhanced magnetic resonance image after external irradiation.
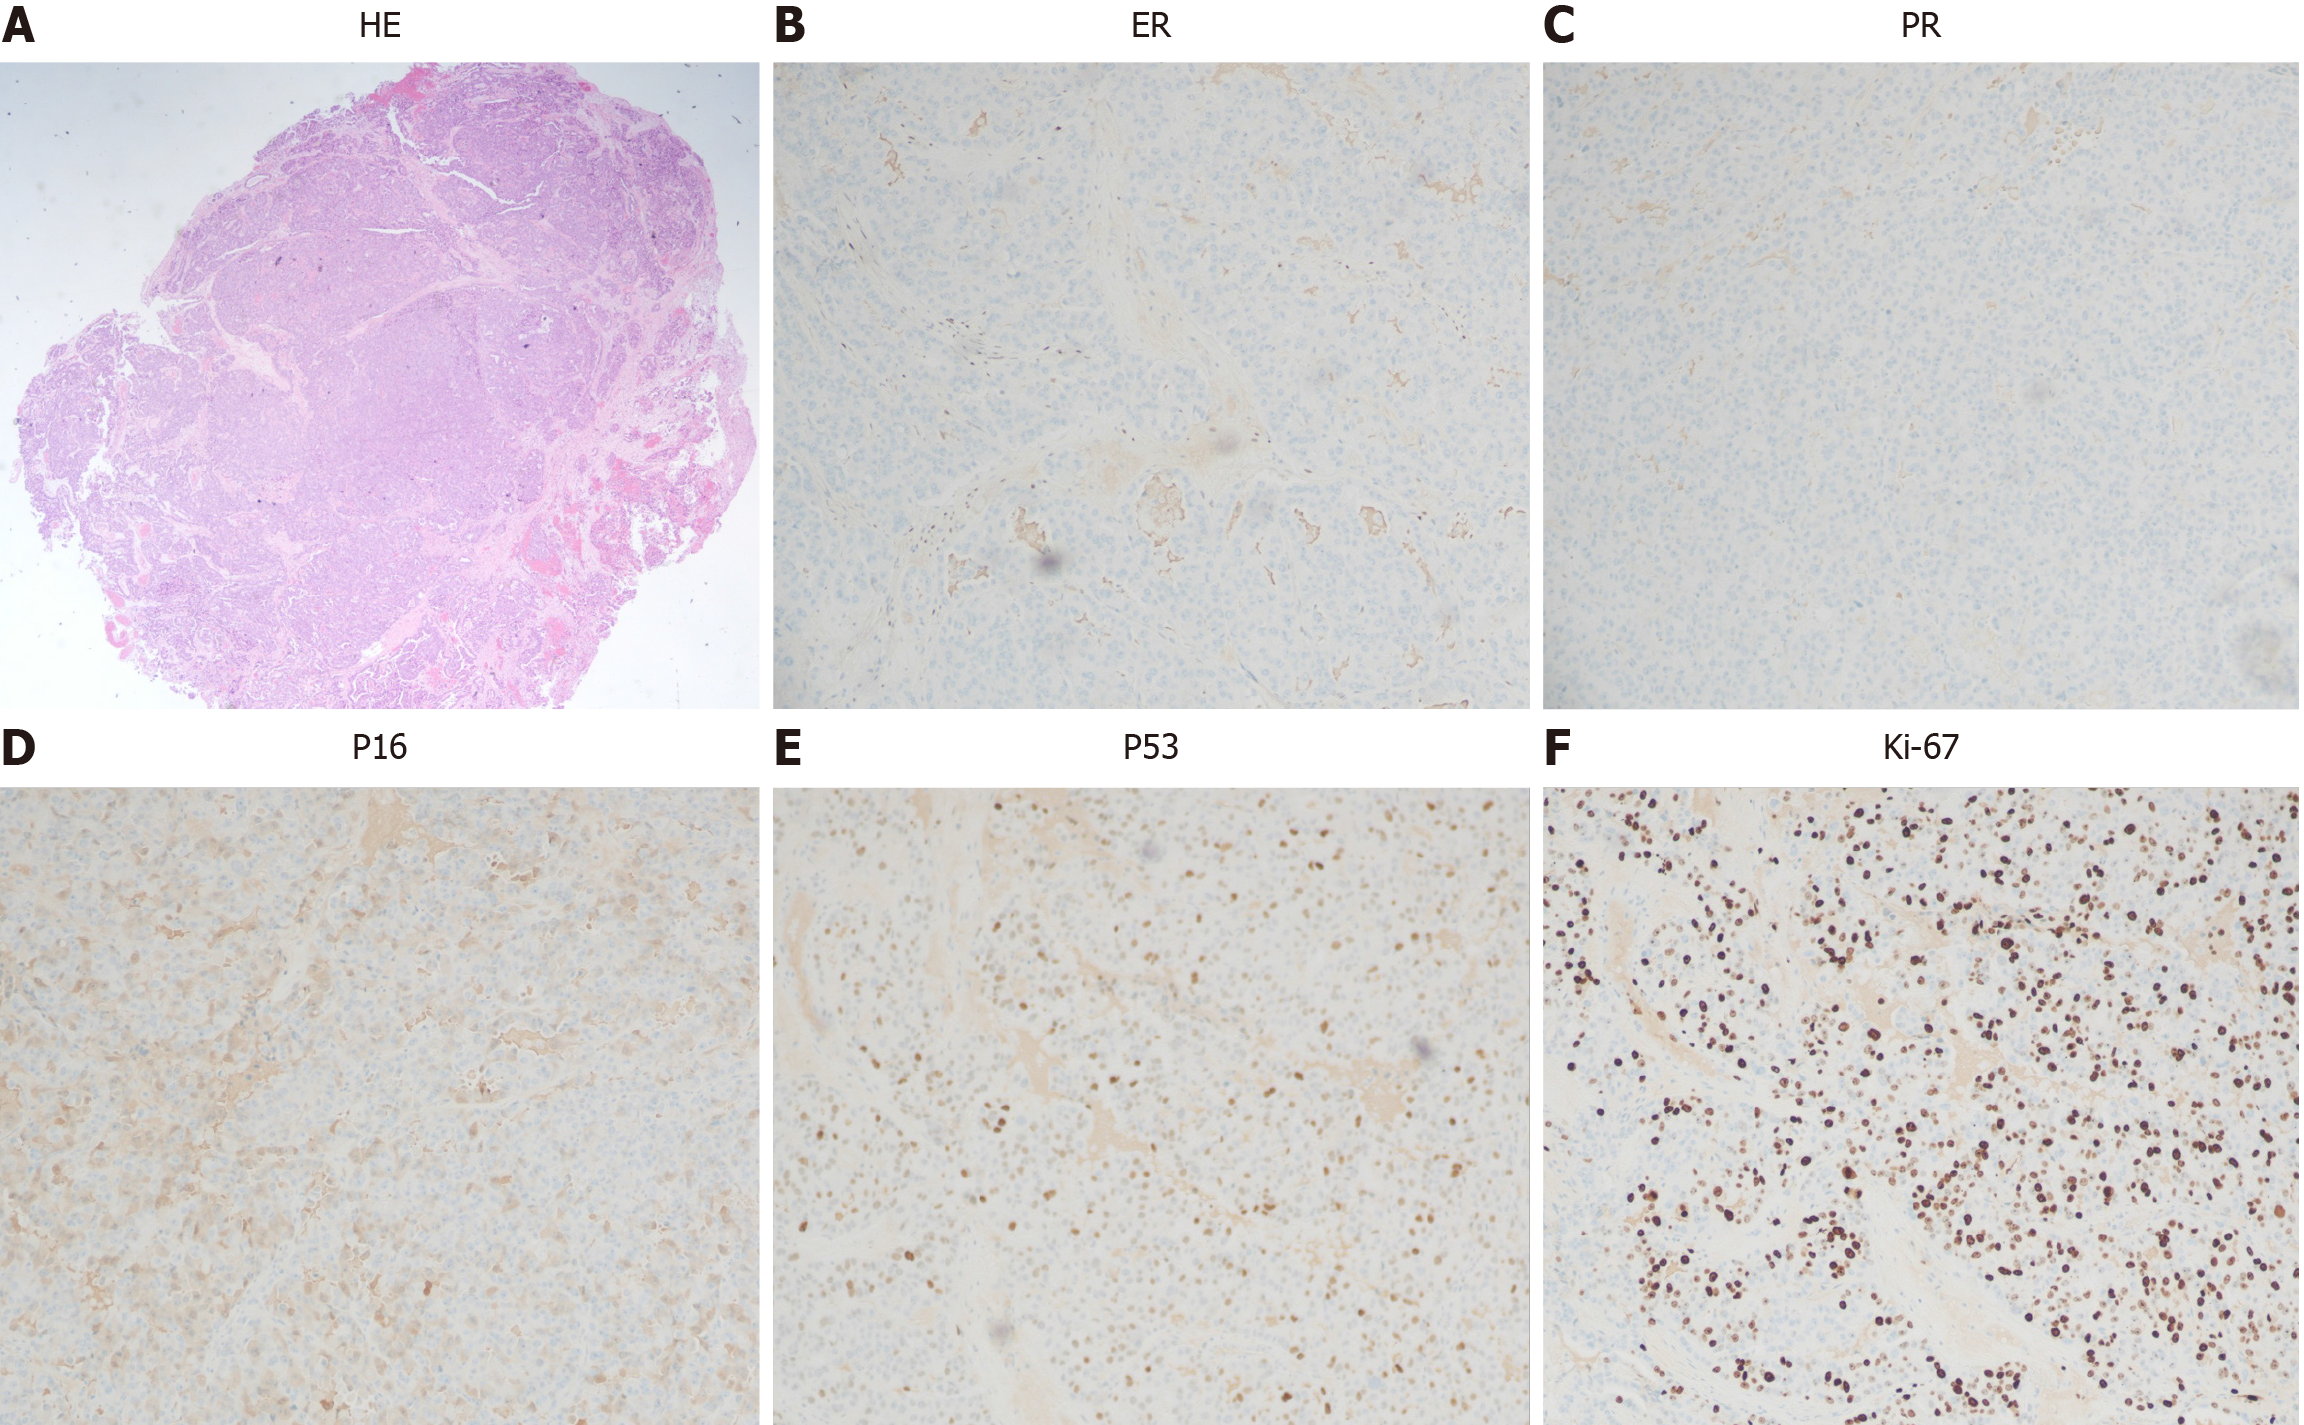
Figure 4 Histological and immunohistochemical examinations.
A: Hematoxylin eosin staining (20 × microscopy); B: Estrogen receptor (5% +, 100 × microscopy); C: Progesterone receptor (−, 100 × microscopy); D: P16 (some weak +, 100 × microscopy); E: P53 (patchy +) (100 × microscopy); F: Ki-67 (70% +, 100 × microscopy).
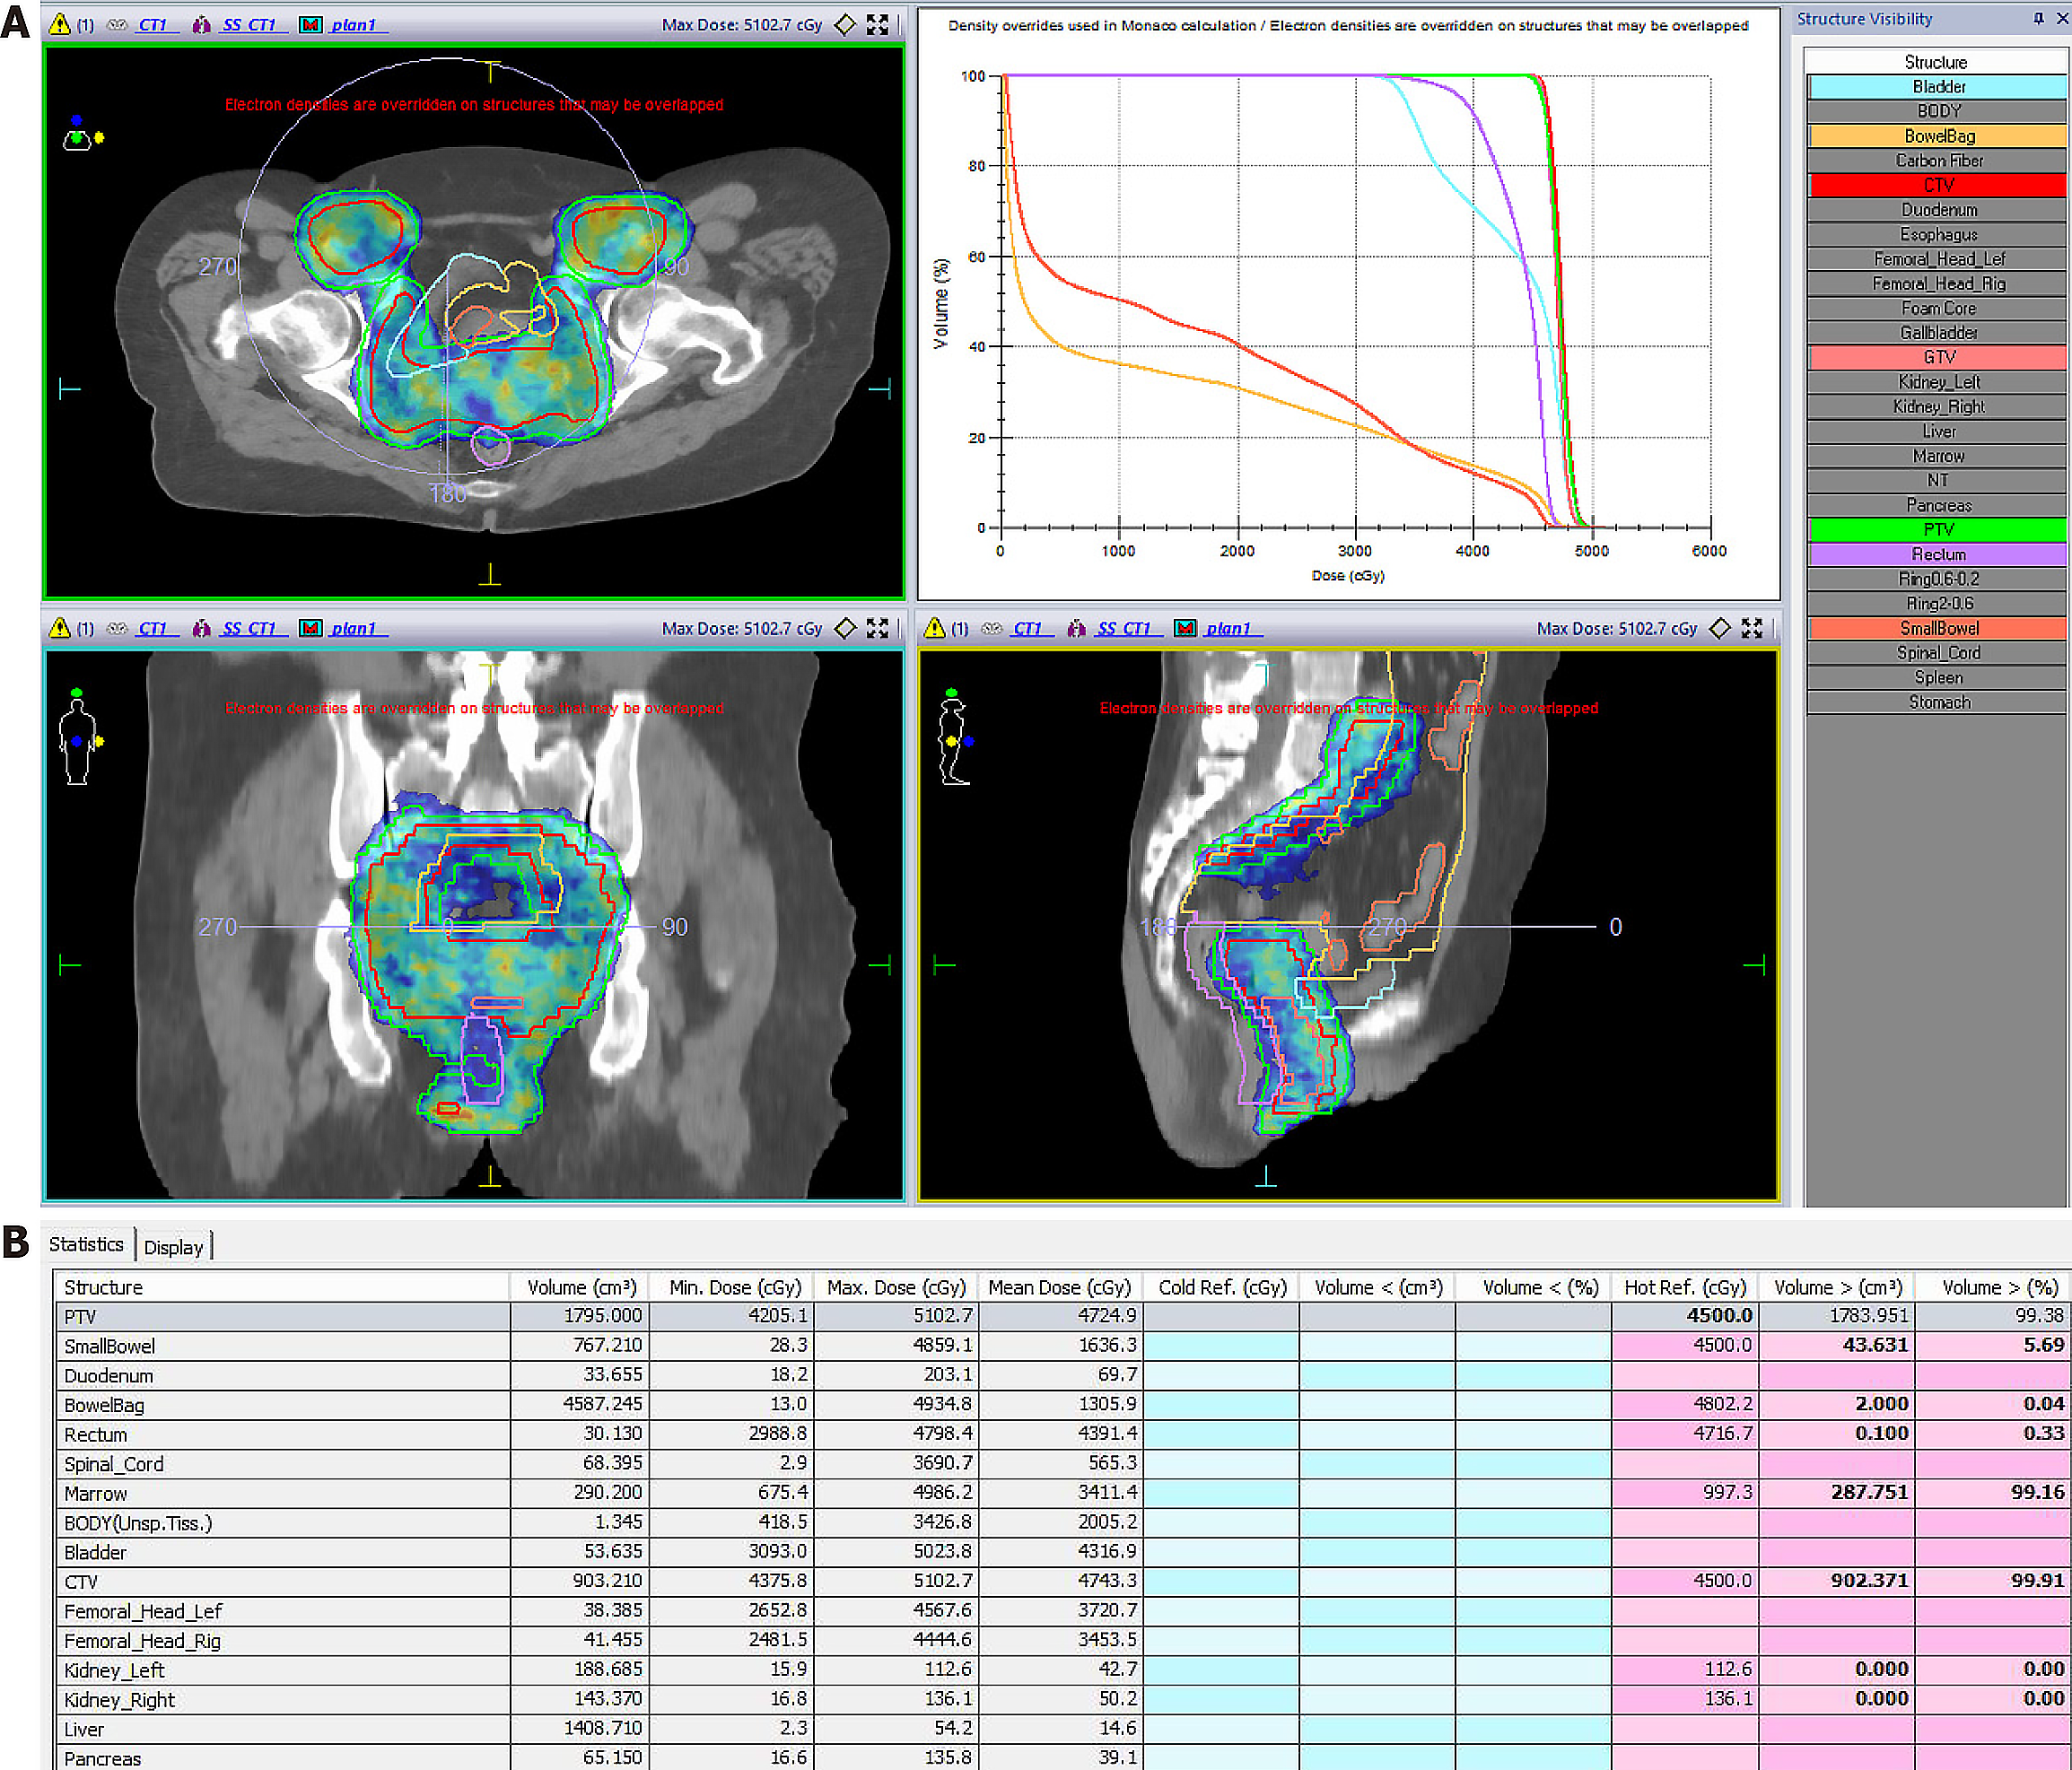
Figure 5 Treatment planning for external irradiation, with dose to target area and at-risk organs.
A: Target area; B: At-risk organs.
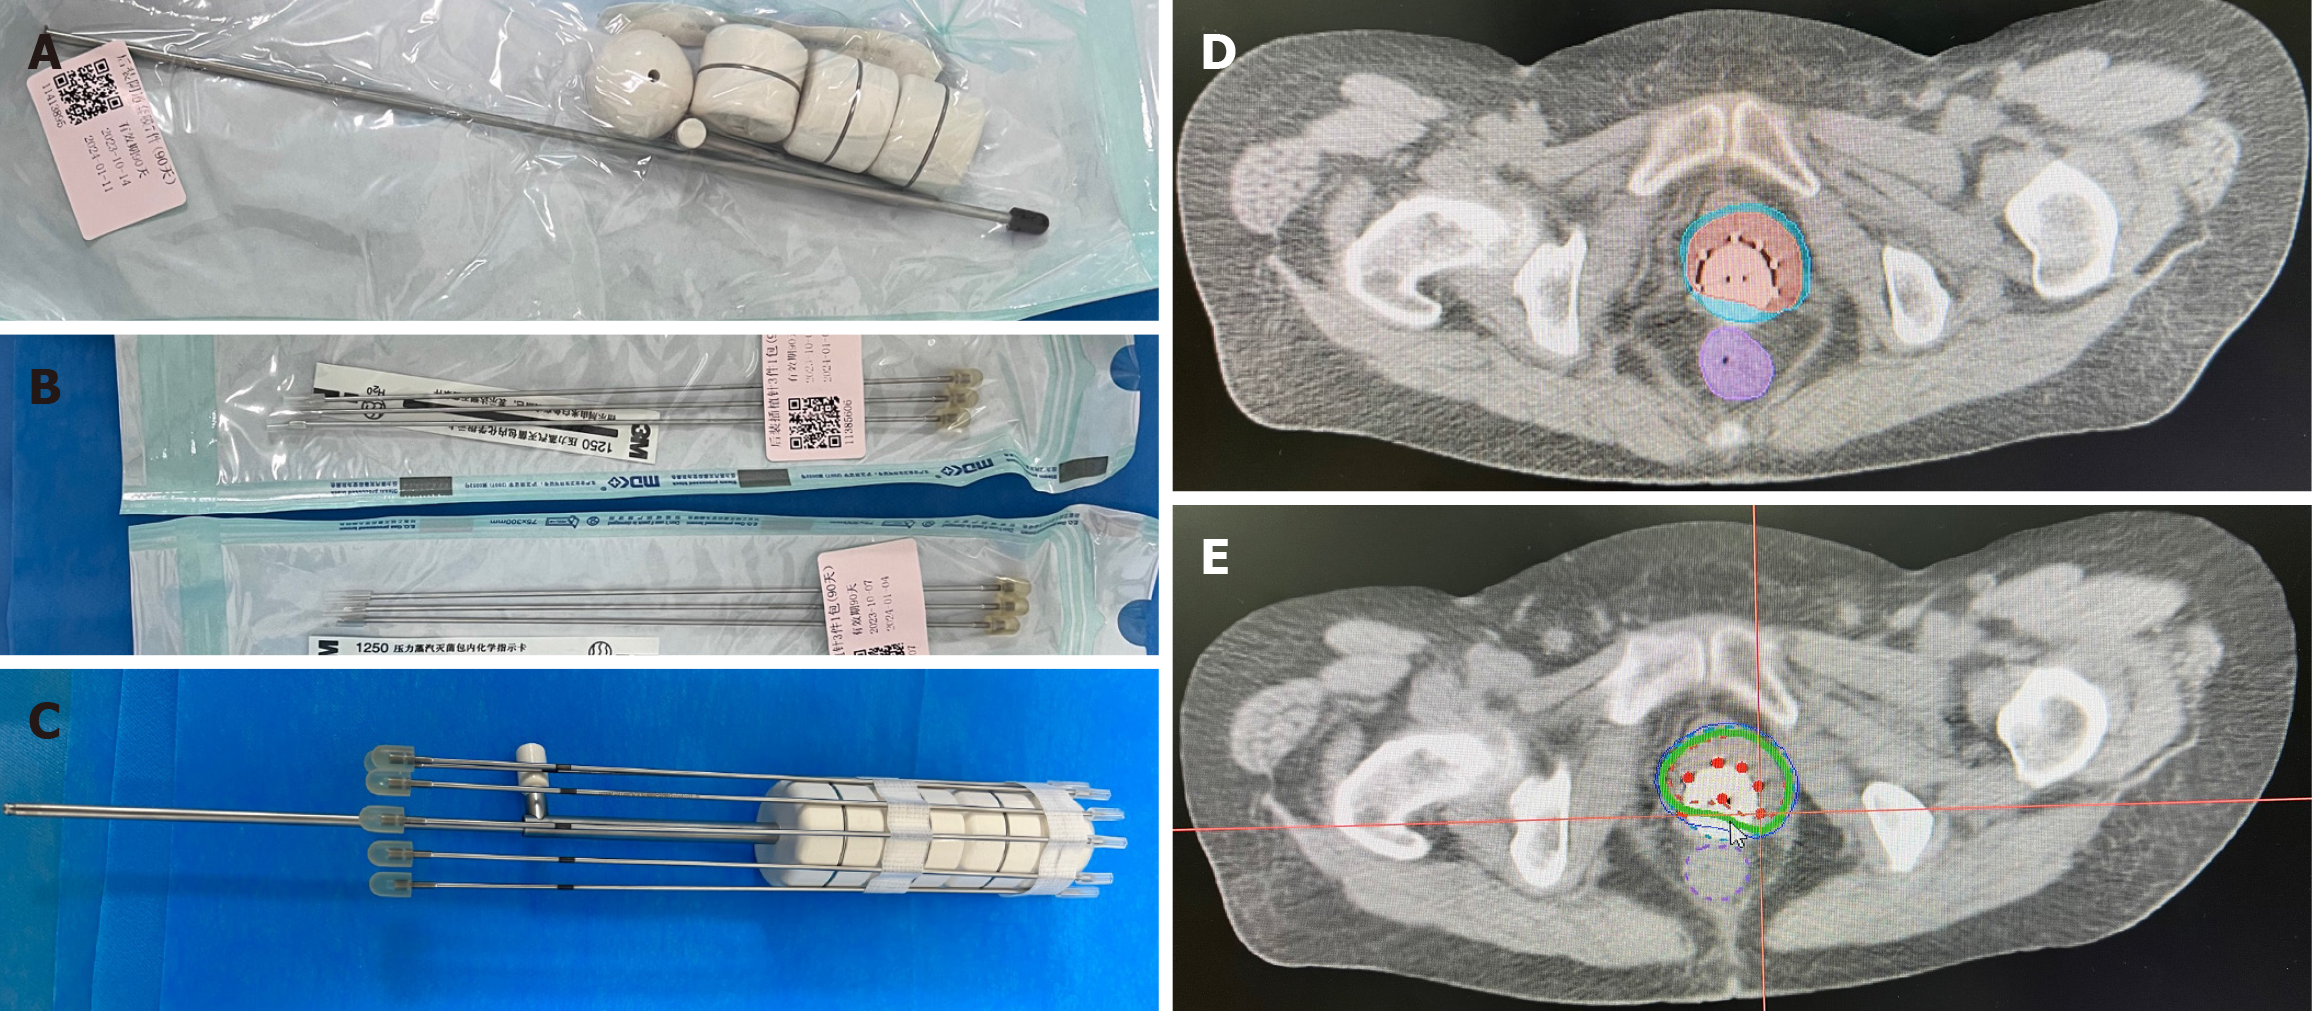
Figure 6 An individualized after-loading brachytherapy applicator.
A: Commercially available cylindrical vaginal applicator; B: Interstitial needles; C: Assembled applicator; D: Target areas on transected sites, with the sky-blue area representing high-risk clinical target volume; E: Dose distribution plot at transect level, with green line showing 6 gray dose perimeter.
- Citation: Saijilafu, Gu YJ, Huang AW, Xu CF, Qian LW. Individualized vaginal applicator for stage IIb primary vaginal adenocarcinoma: A case report. World J Clin Oncol 2024; 15(8): 1102-1109
- URL: https://www.wjgnet.com/2218-4333/full/v15/i8/1102.htm
- DOI: https://dx.doi.org/10.5306/wjco.v15.i8.1102


