Copyright
©The Author(s) 2024.
World J Clin Oncol. Aug 24, 2024; 15(8): 1021-1032
Published online Aug 24, 2024. doi: 10.5306/wjco.v15.i8.1021
Published online Aug 24, 2024. doi: 10.5306/wjco.v15.i8.1021
Figure 1 The violin plot showcased the distribution of preoperative nutritional and inflammatory markers between two groups: The early discharge cohort and the delayed discharge cohort, using a cut-off point of 15-day postoperative discharge.
A: Prognostic nutritional index; B: Systemic immune-inflammation index; C: Neutrophil to lymphocyte ratio; D: Platelet to lymphocyte ratio. All of them underwent natural logarithmic transformation. aP < 0.05; bP < 0.01; cP < 0.001. PNI: Prognostic nutritional index; SII: Systemic immune-inflammation index; NLR: Neutrophil to lymphocyte ratio; PLR: Platelet to lymphocyte ratio.
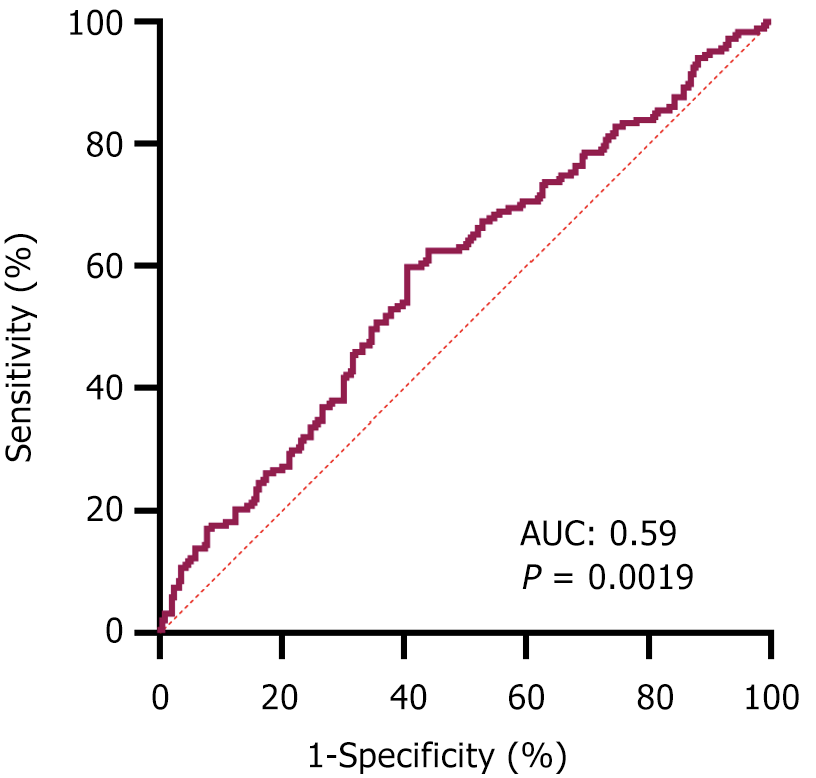
Figure 2 The receiver operating characteristic curve illustrated the association between systemic immuneinflammation index and the outcomes of postoperative recovery.
AUC: Area under the curve.
Figure 3 The Kaplan-Meier curves compared the survival of all patients with pancreatic cancer categorized into two groups based on their prognostic nutritional index: The prognostic nutritional index-low group and the prognostic nutritional index-high group.
A: Recurrence-free survival; B: Overall survival. PNI: Prognostic nutritional index.
- Citation: Lu JN, Zhou LS, Zhang S, Li JX, Xu CJ. Performance of nutritional and inflammatory markers in patients with pancreatic cancer. World J Clin Oncol 2024; 15(8): 1021-1032
- URL: https://www.wjgnet.com/2218-4333/full/v15/i8/1021.htm
- DOI: https://dx.doi.org/10.5306/wjco.v15.i8.1021


