Copyright
©The Author(s) 2024.
World J Clin Oncol. Jul 24, 2024; 15(7): 867-894
Published online Jul 24, 2024. doi: 10.5306/wjco.v15.i7.867
Published online Jul 24, 2024. doi: 10.5306/wjco.v15.i7.867
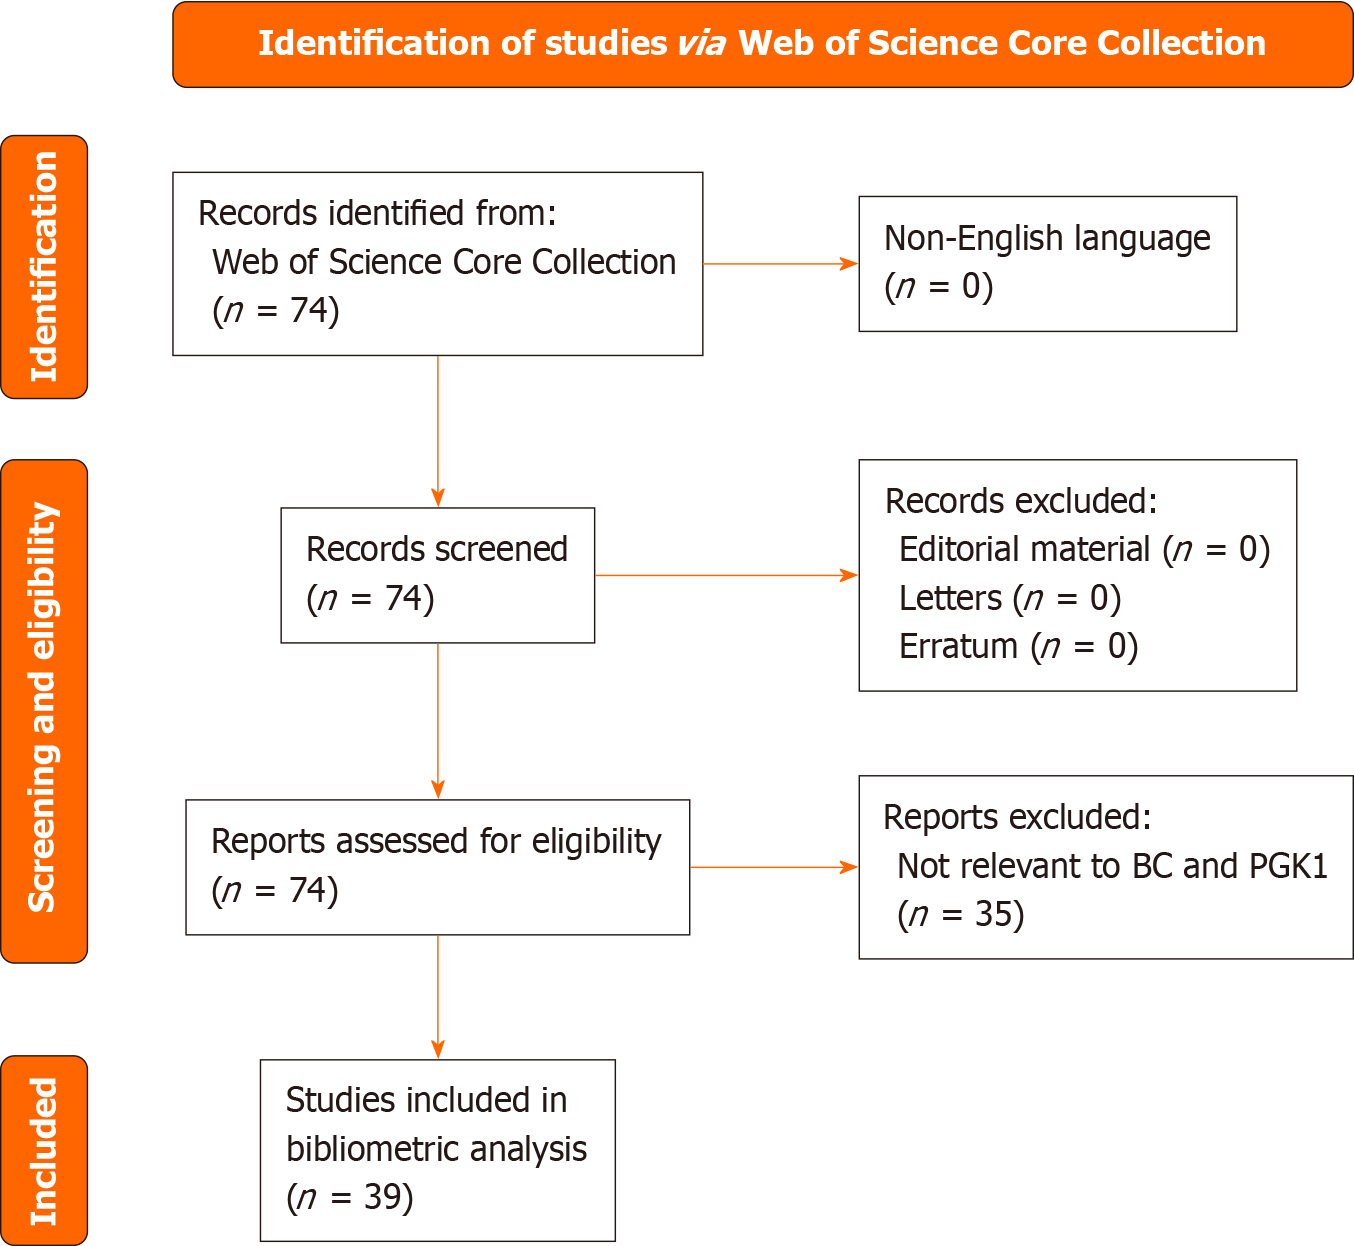
Figure 1 PRISMA flow diagram of the data screening procedure used in the current study.
BC: Breast cancer; PGK1: Phosphoglycerate kinase 1.
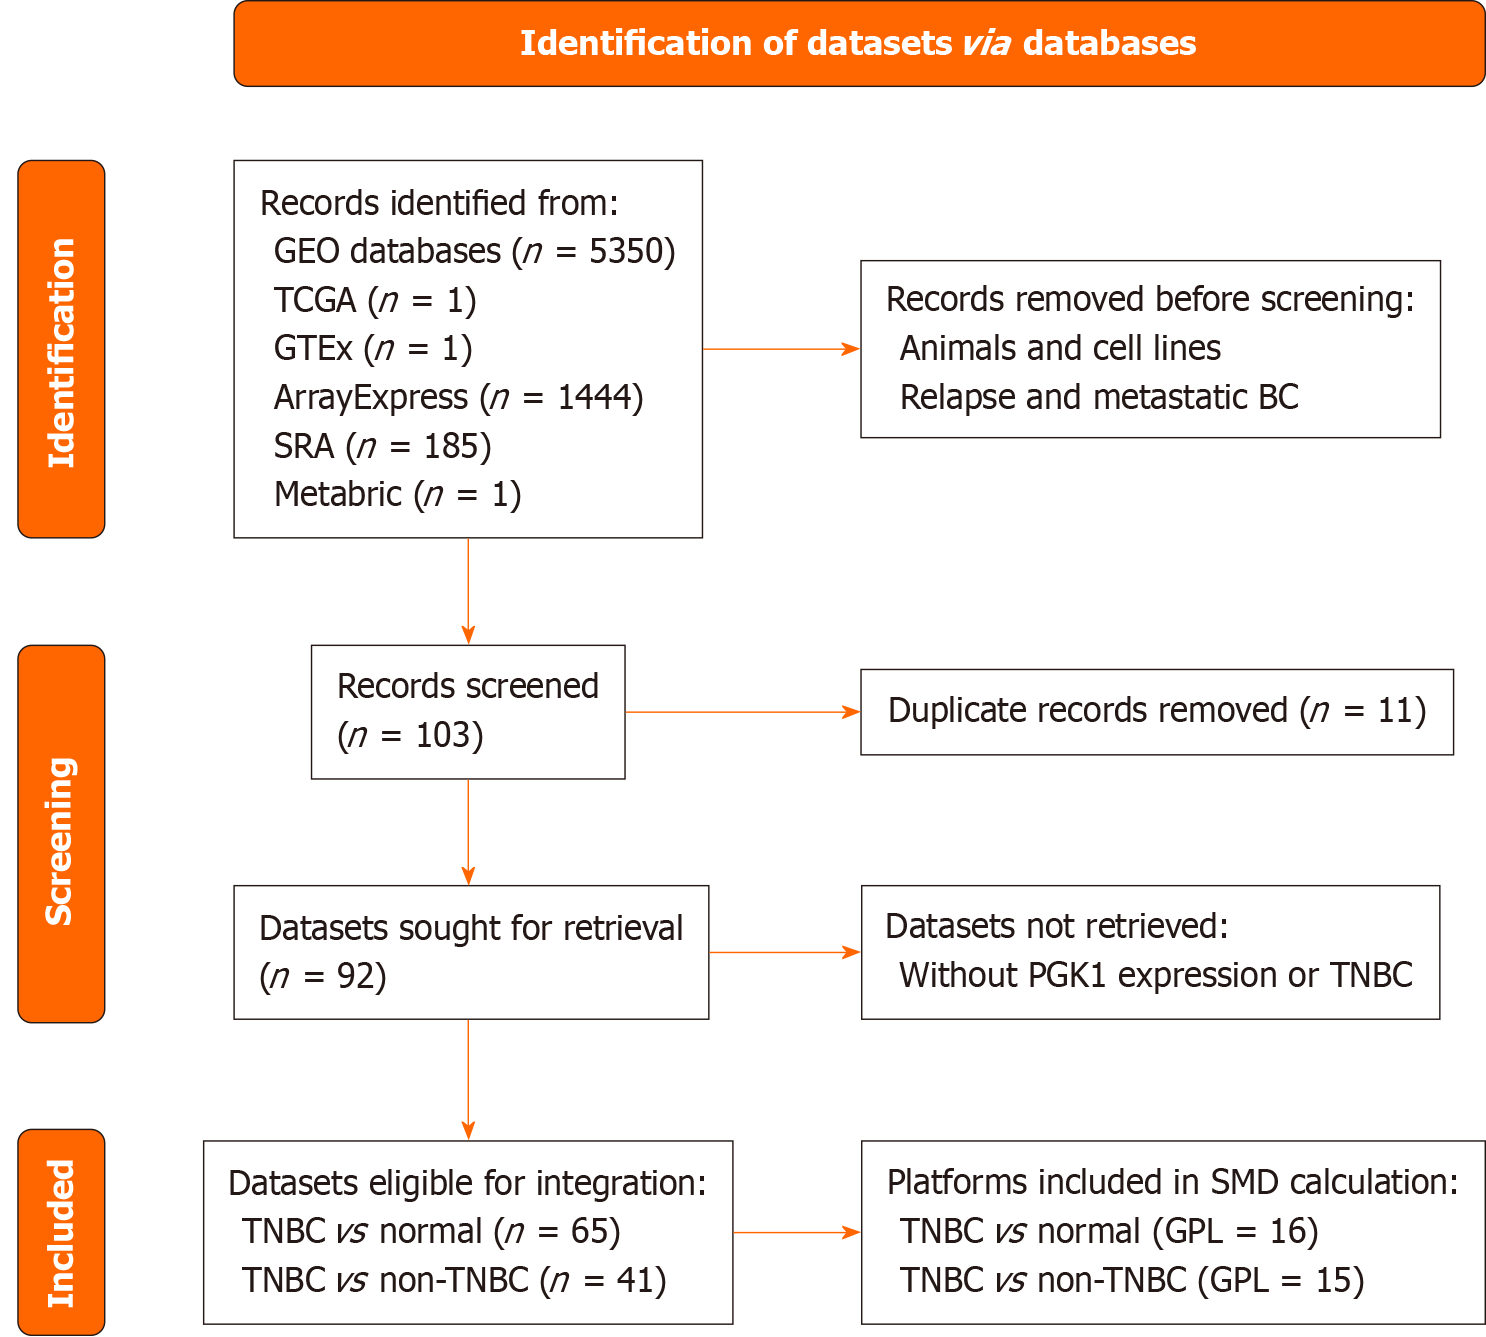
Figure 2 PRISMA flow diagram of the screening procedure used for triple-negative breast cancer data sets including phosphoglycerate kinase 1 expression.
BC: Breast cancer; PGK1: Phosphoglycerate kinase 1; TNBC: Triple-negative breast cancer; SMD: Standardized mean differences.
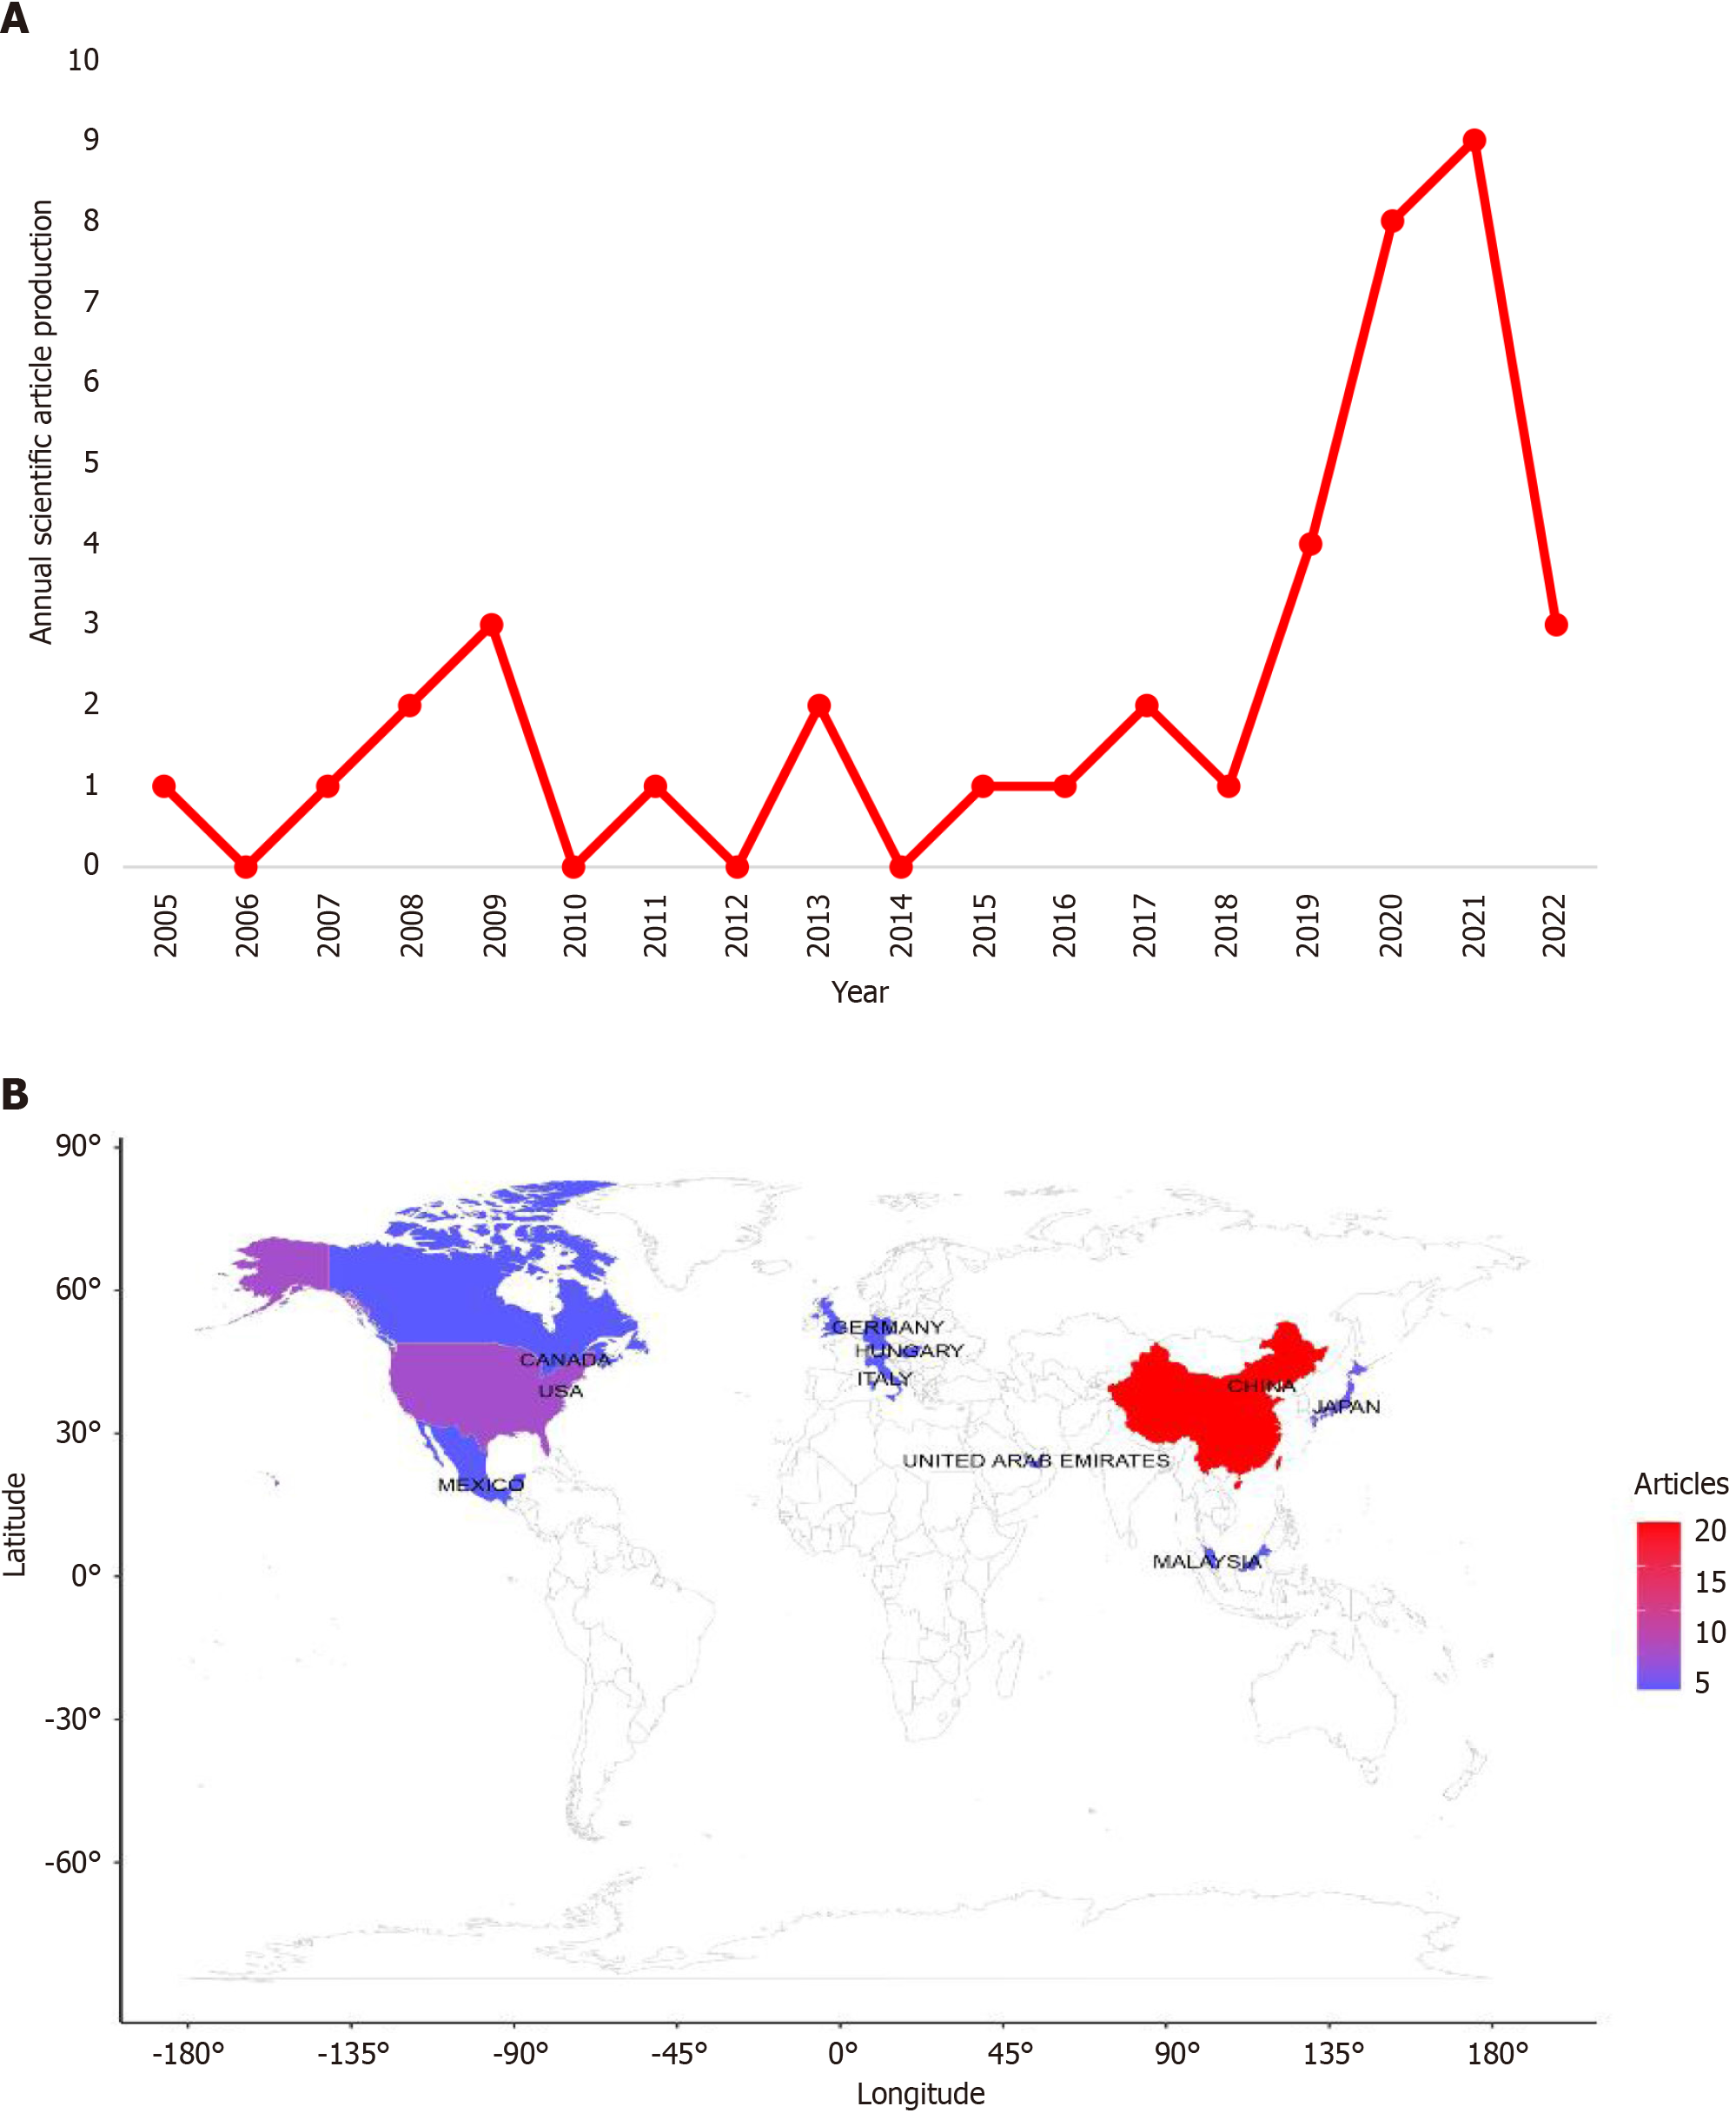
Figure 3 Global scientific research on phosphoglycerate kinase 1 and breast cancer.
A: Annual scientific production. Abscissa is the year, and ordinate is number of articles; B: Geographic distribution of corresponding authors. The more articles, the redder the area on the map. Horizontal and vertical coordinates represent longitude and latitude, respectively.
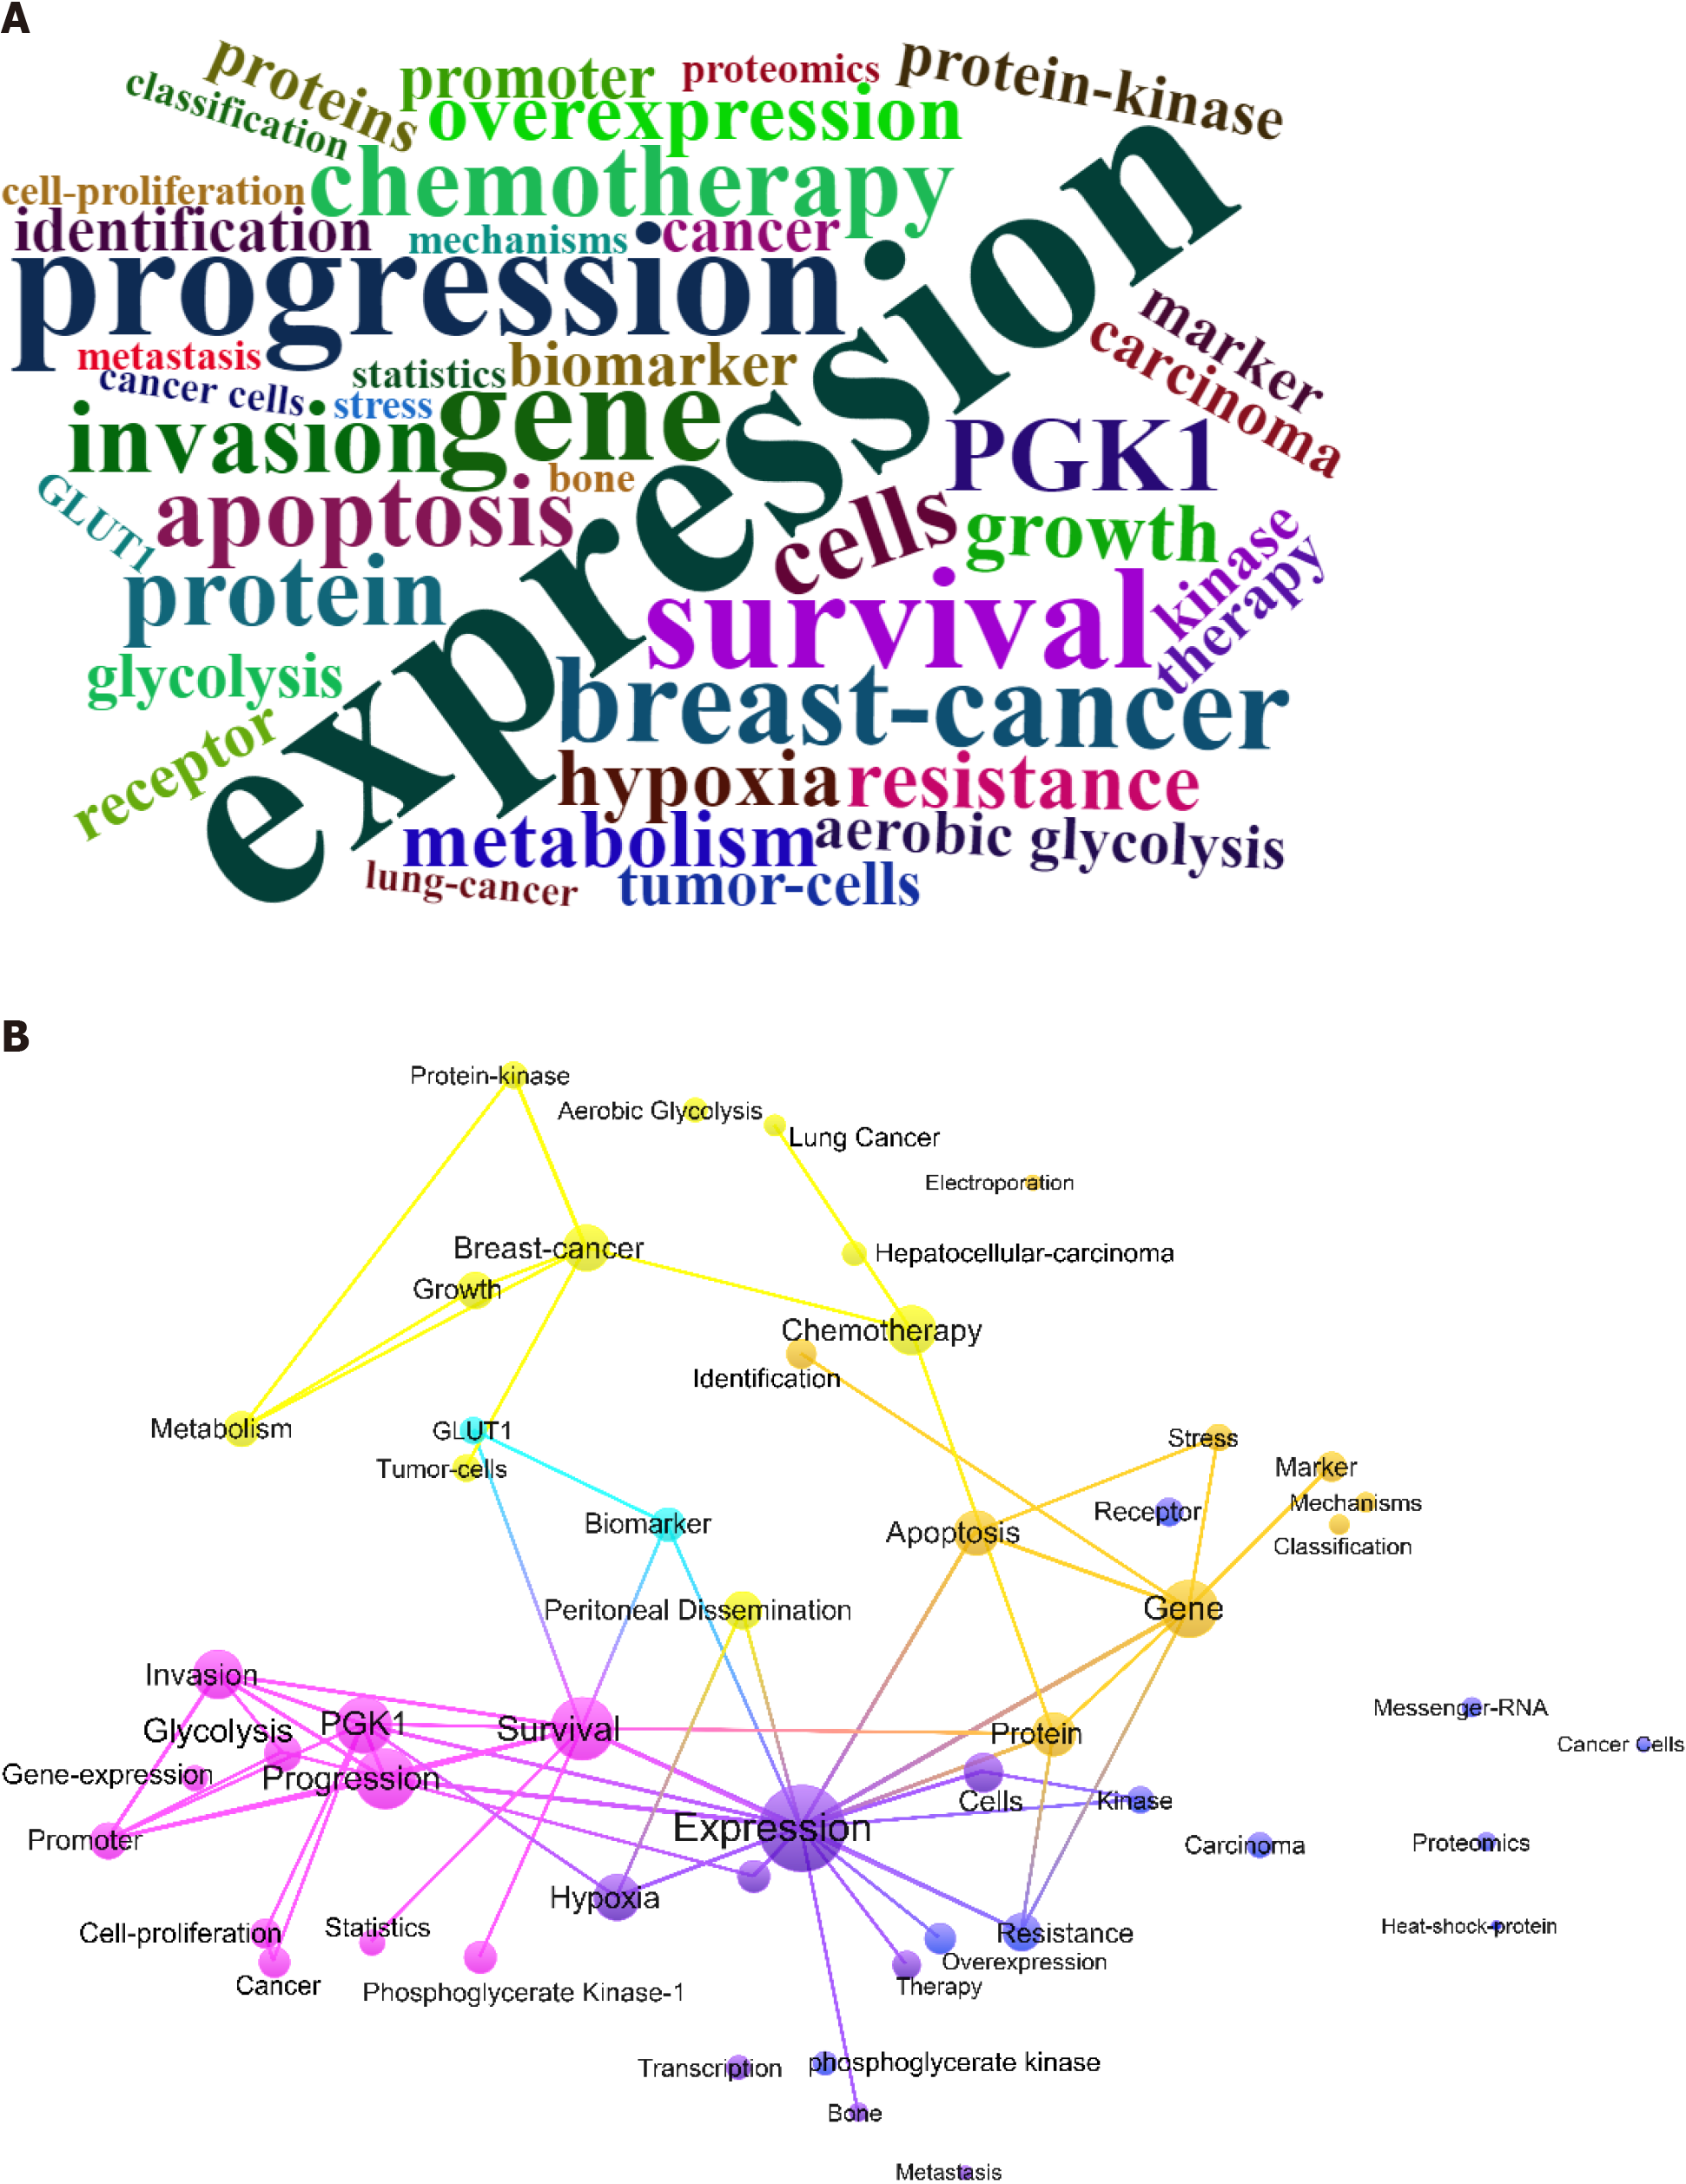
Figure 4 Key words.
A: Word cloud of key words. Word frequency was counted according to the Web of Science key words for each document. The word cloud plot is randomly colored. A larger font size indicates a higher frequency; B: Key word co-occurrence plot for breast cancer and phosphoglycerate kinase 1 research. Web of Science key words were clustered using VOSviewer algorithm. Different colors represent different clusters. Font size positively correlates with total co-occurrent numbers. Edges indicate co-occurrence relationships.
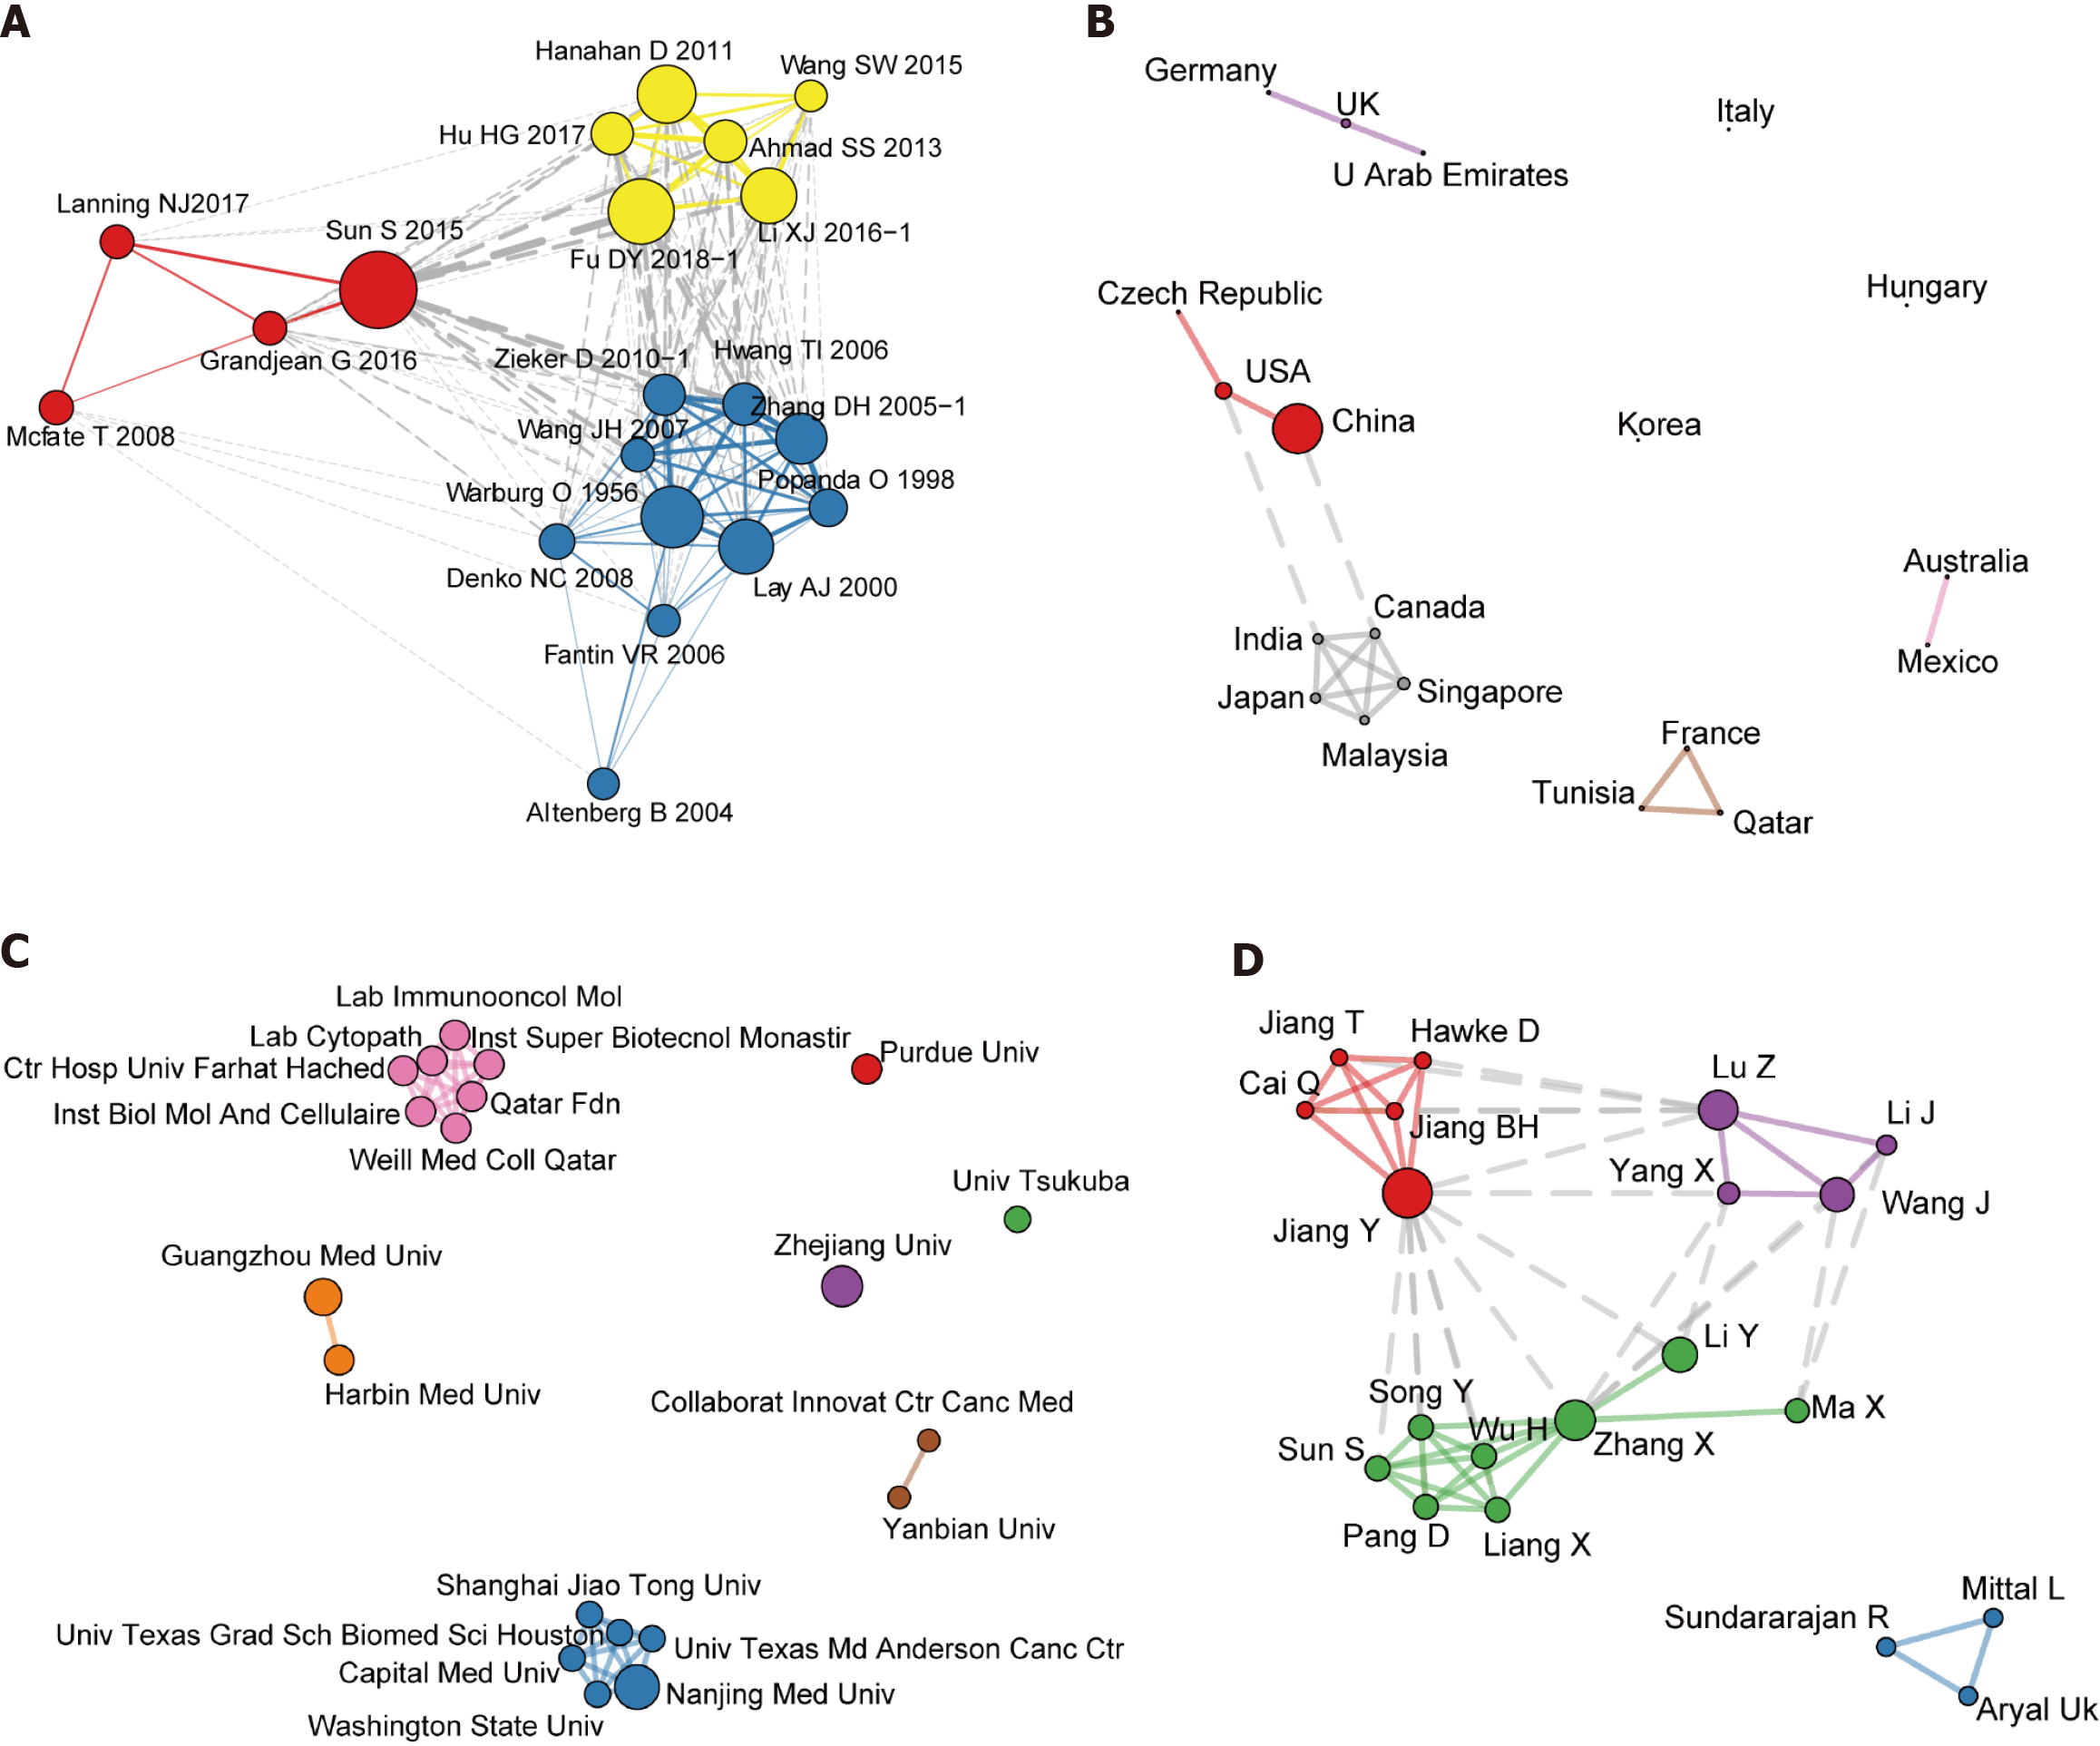
Figure 5 Cooperation network analysis for research on breast cancer and phosphoglycerate kinase 1.
A: Co-citation network; B: Collaborations among countries; C: University collaborations; D: Author collaborations. The co-cited documents and cooperating countries, universities, and authors were clustered using a “leading Eigen” algorithm. Different colors represent different clusters. Node size is positively correlated with the degree of connectivity of each node in the network. Edges indicate a co-citation or collaborative relationship.
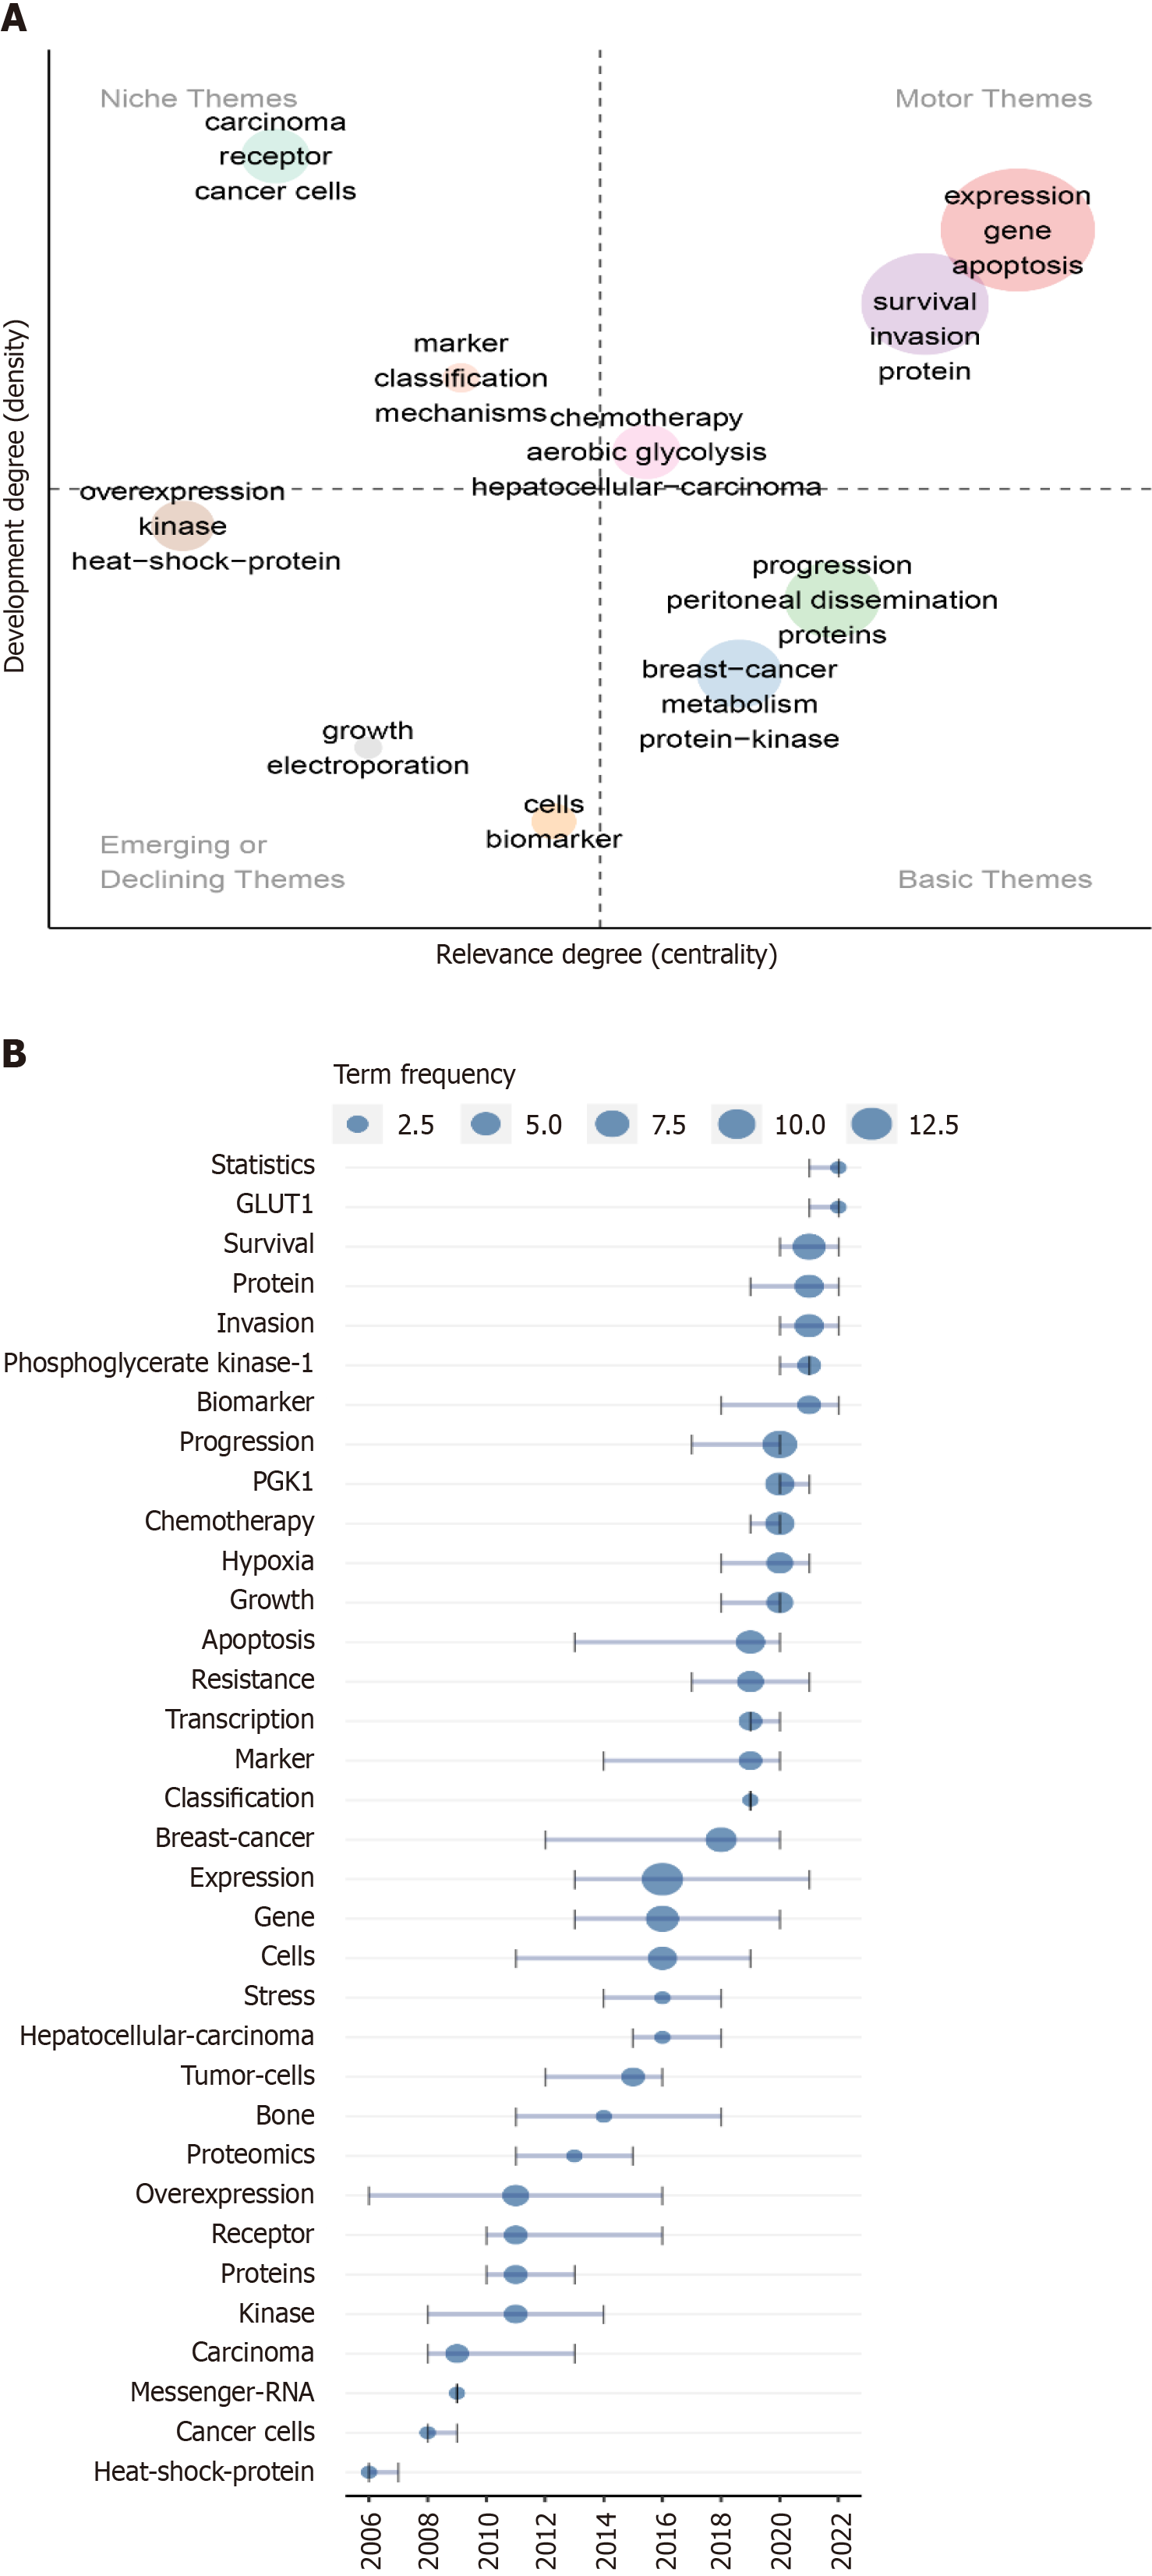
Figure 6 Thematic plot of research on breast cancer and phosphoglycerate kinase 1 and trends in topics related to breast cancer and phosphoglycerate kinase 1 research.
A: Using Web of Science key words, various research themes were detected via co-occurrence analysis and walktrap clustering analysis. Different colors represent different themes. Density represents the connection strength of basic knowledge units within a single topic. A larger topic density value indicates greater topic maturity. Centrality represents the strength of the connection between a topic and other topics. A higher centrality value of a topic suggests a strong interconnection with other topics, placing the topic at the heart of the research landscape. According to the density and centripetal degree values, the rectangular coordinate system was divided into four quadrants. The first quadrant contains core themes of high maturity; the second quadrant has isolated themes of high maturity, and the third quadrant contains new themes or themes that are about to disappear. The fourth quadrant encompasses basic themes of low maturity that may become research hotspots or future research trends; B: Topic trends were detected using co-word analysis. For each topic, the quartiles of publication year were calculated. The horizontal axis represents the first and third quantile years. Each node refers to the median publication year of each term. The larger the node, the more frequent the term.
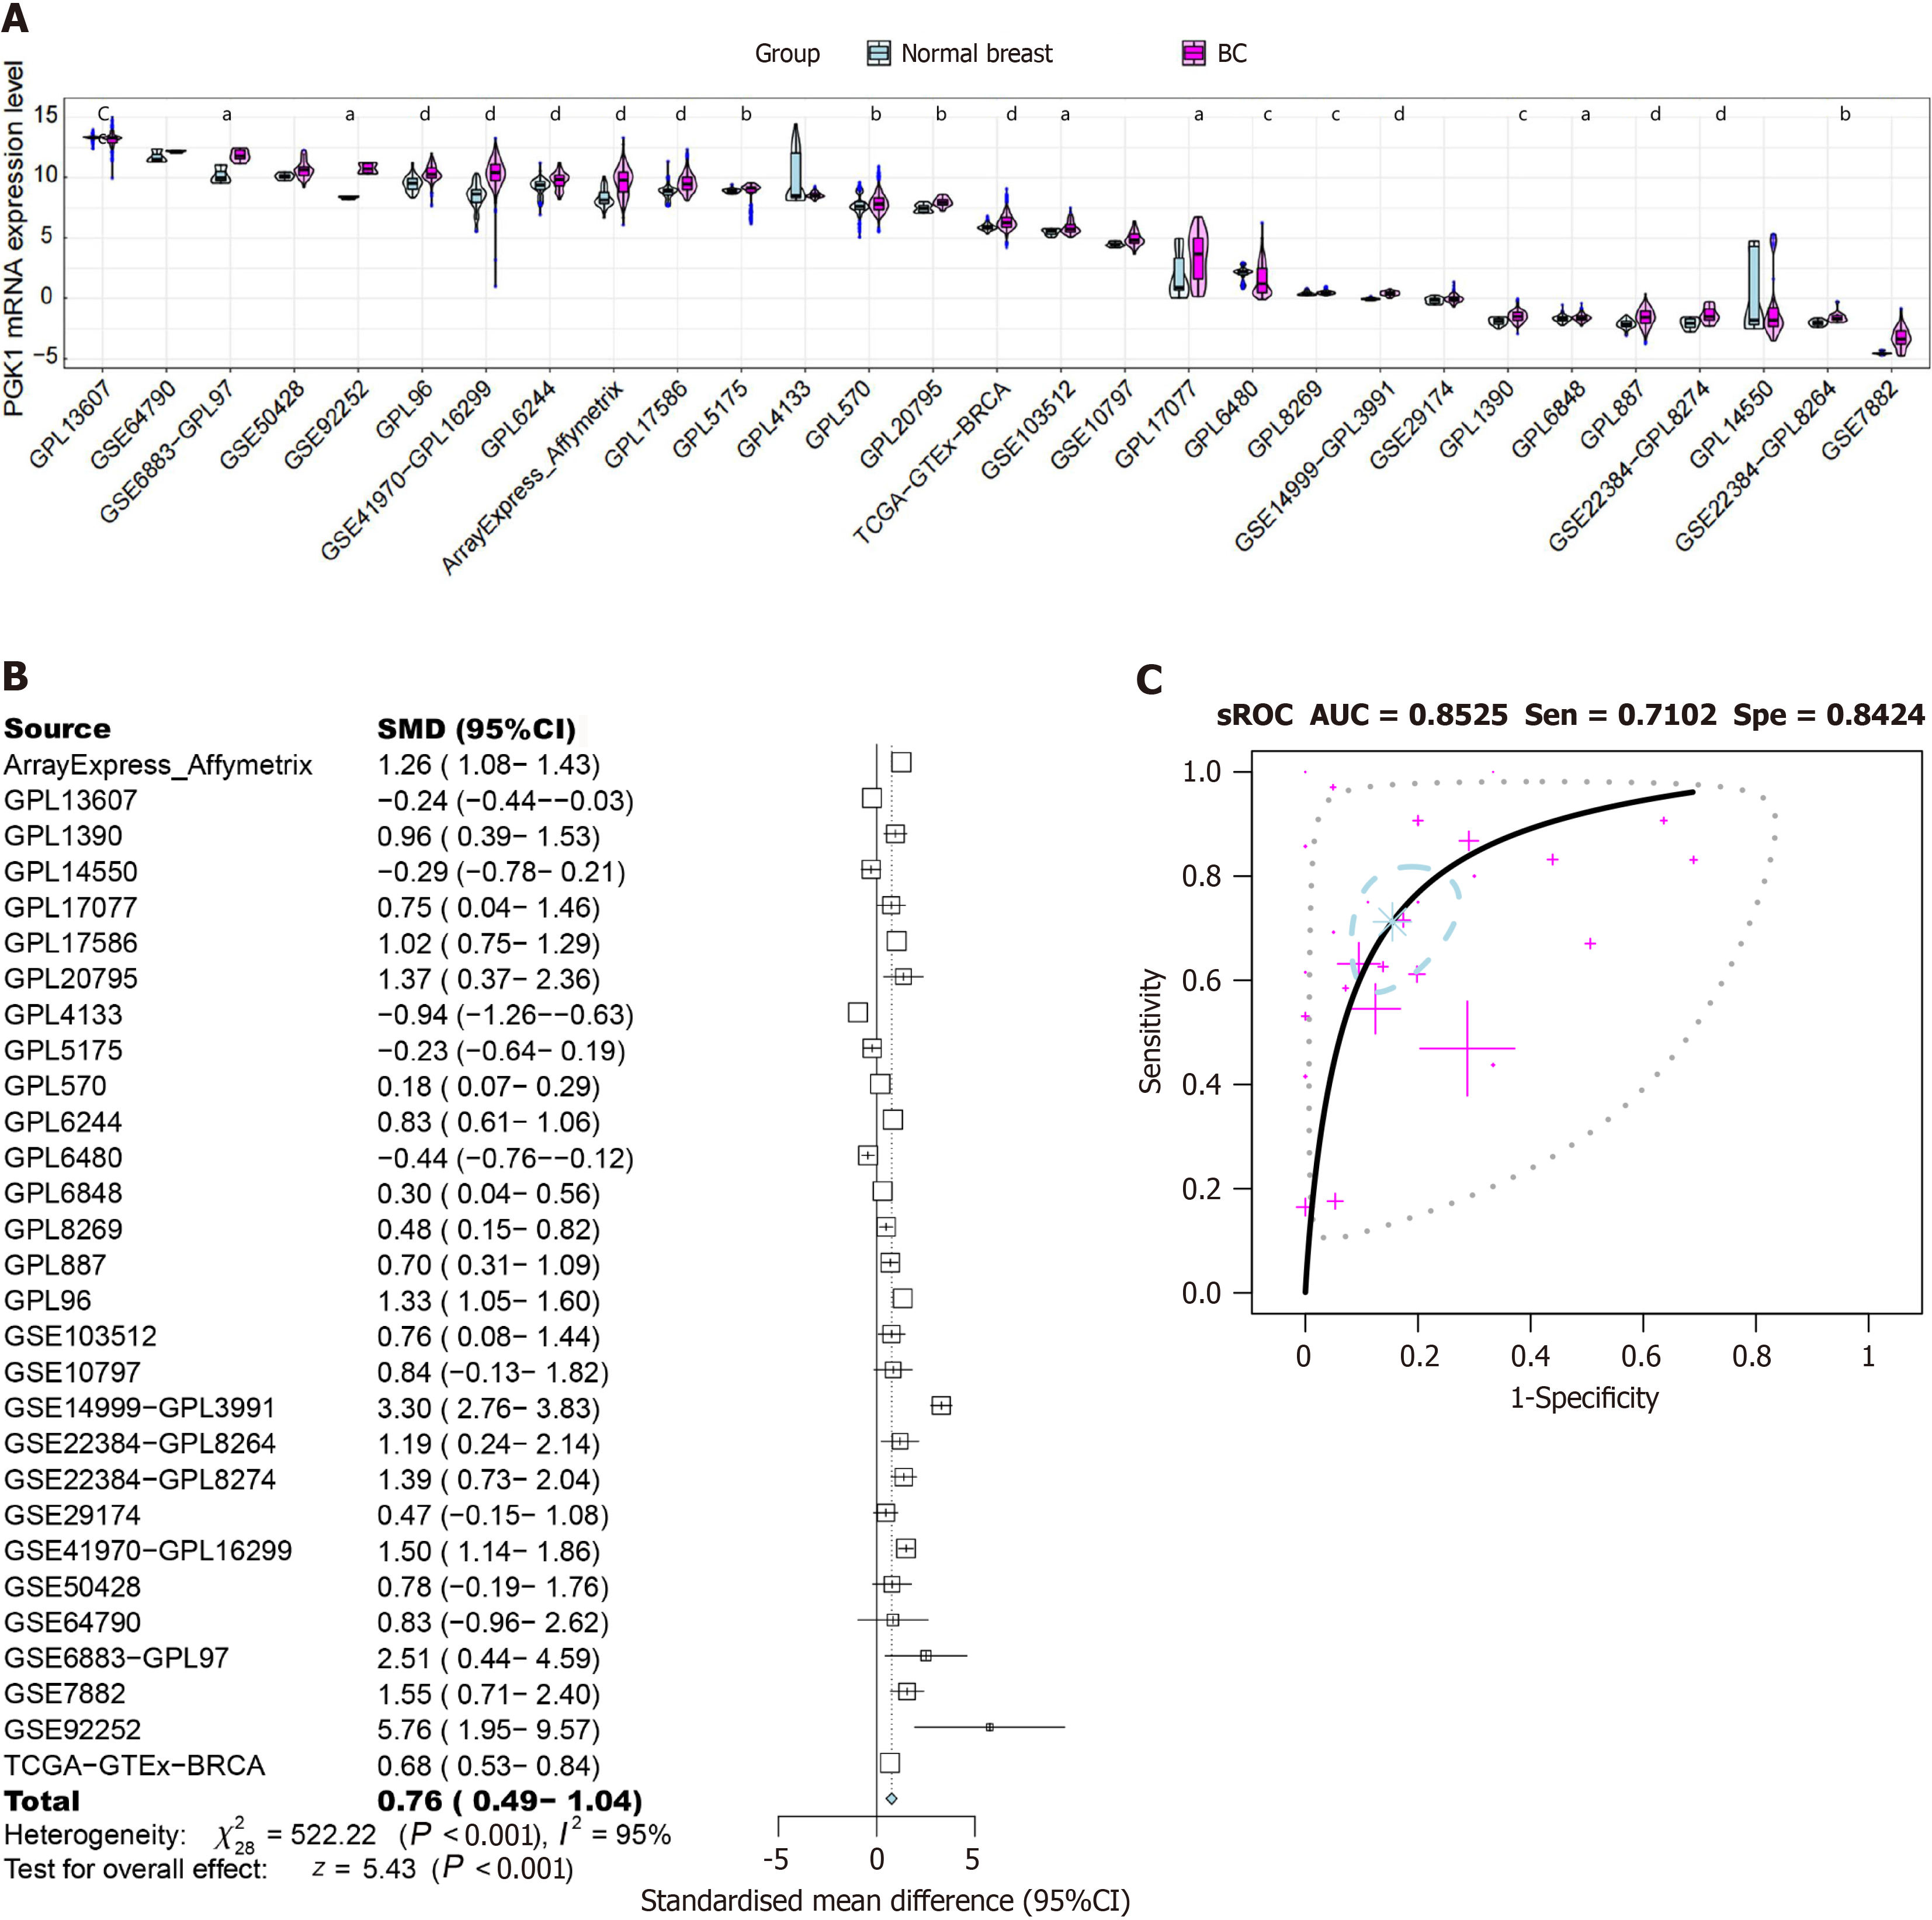
Figure 7 Expression levels of phosphoglycerate kinase 1 in breast cancer tissue vs normal breast tissue.
A: mRNA expression level; B: Standardized mean differences; C: Summary receiver operating characteristic curves. aP < 0.05; bP < 0.01; cP < 0.001; dP < 0.0001. BC: Breast cancer; sROC: Summary receiver operating characteristic curve; AUC: Area under the curve; Sen: Sensitivity; Spe: Specificity; SMD: Standardized mean difference; 95%CI: 95% confidence interval.
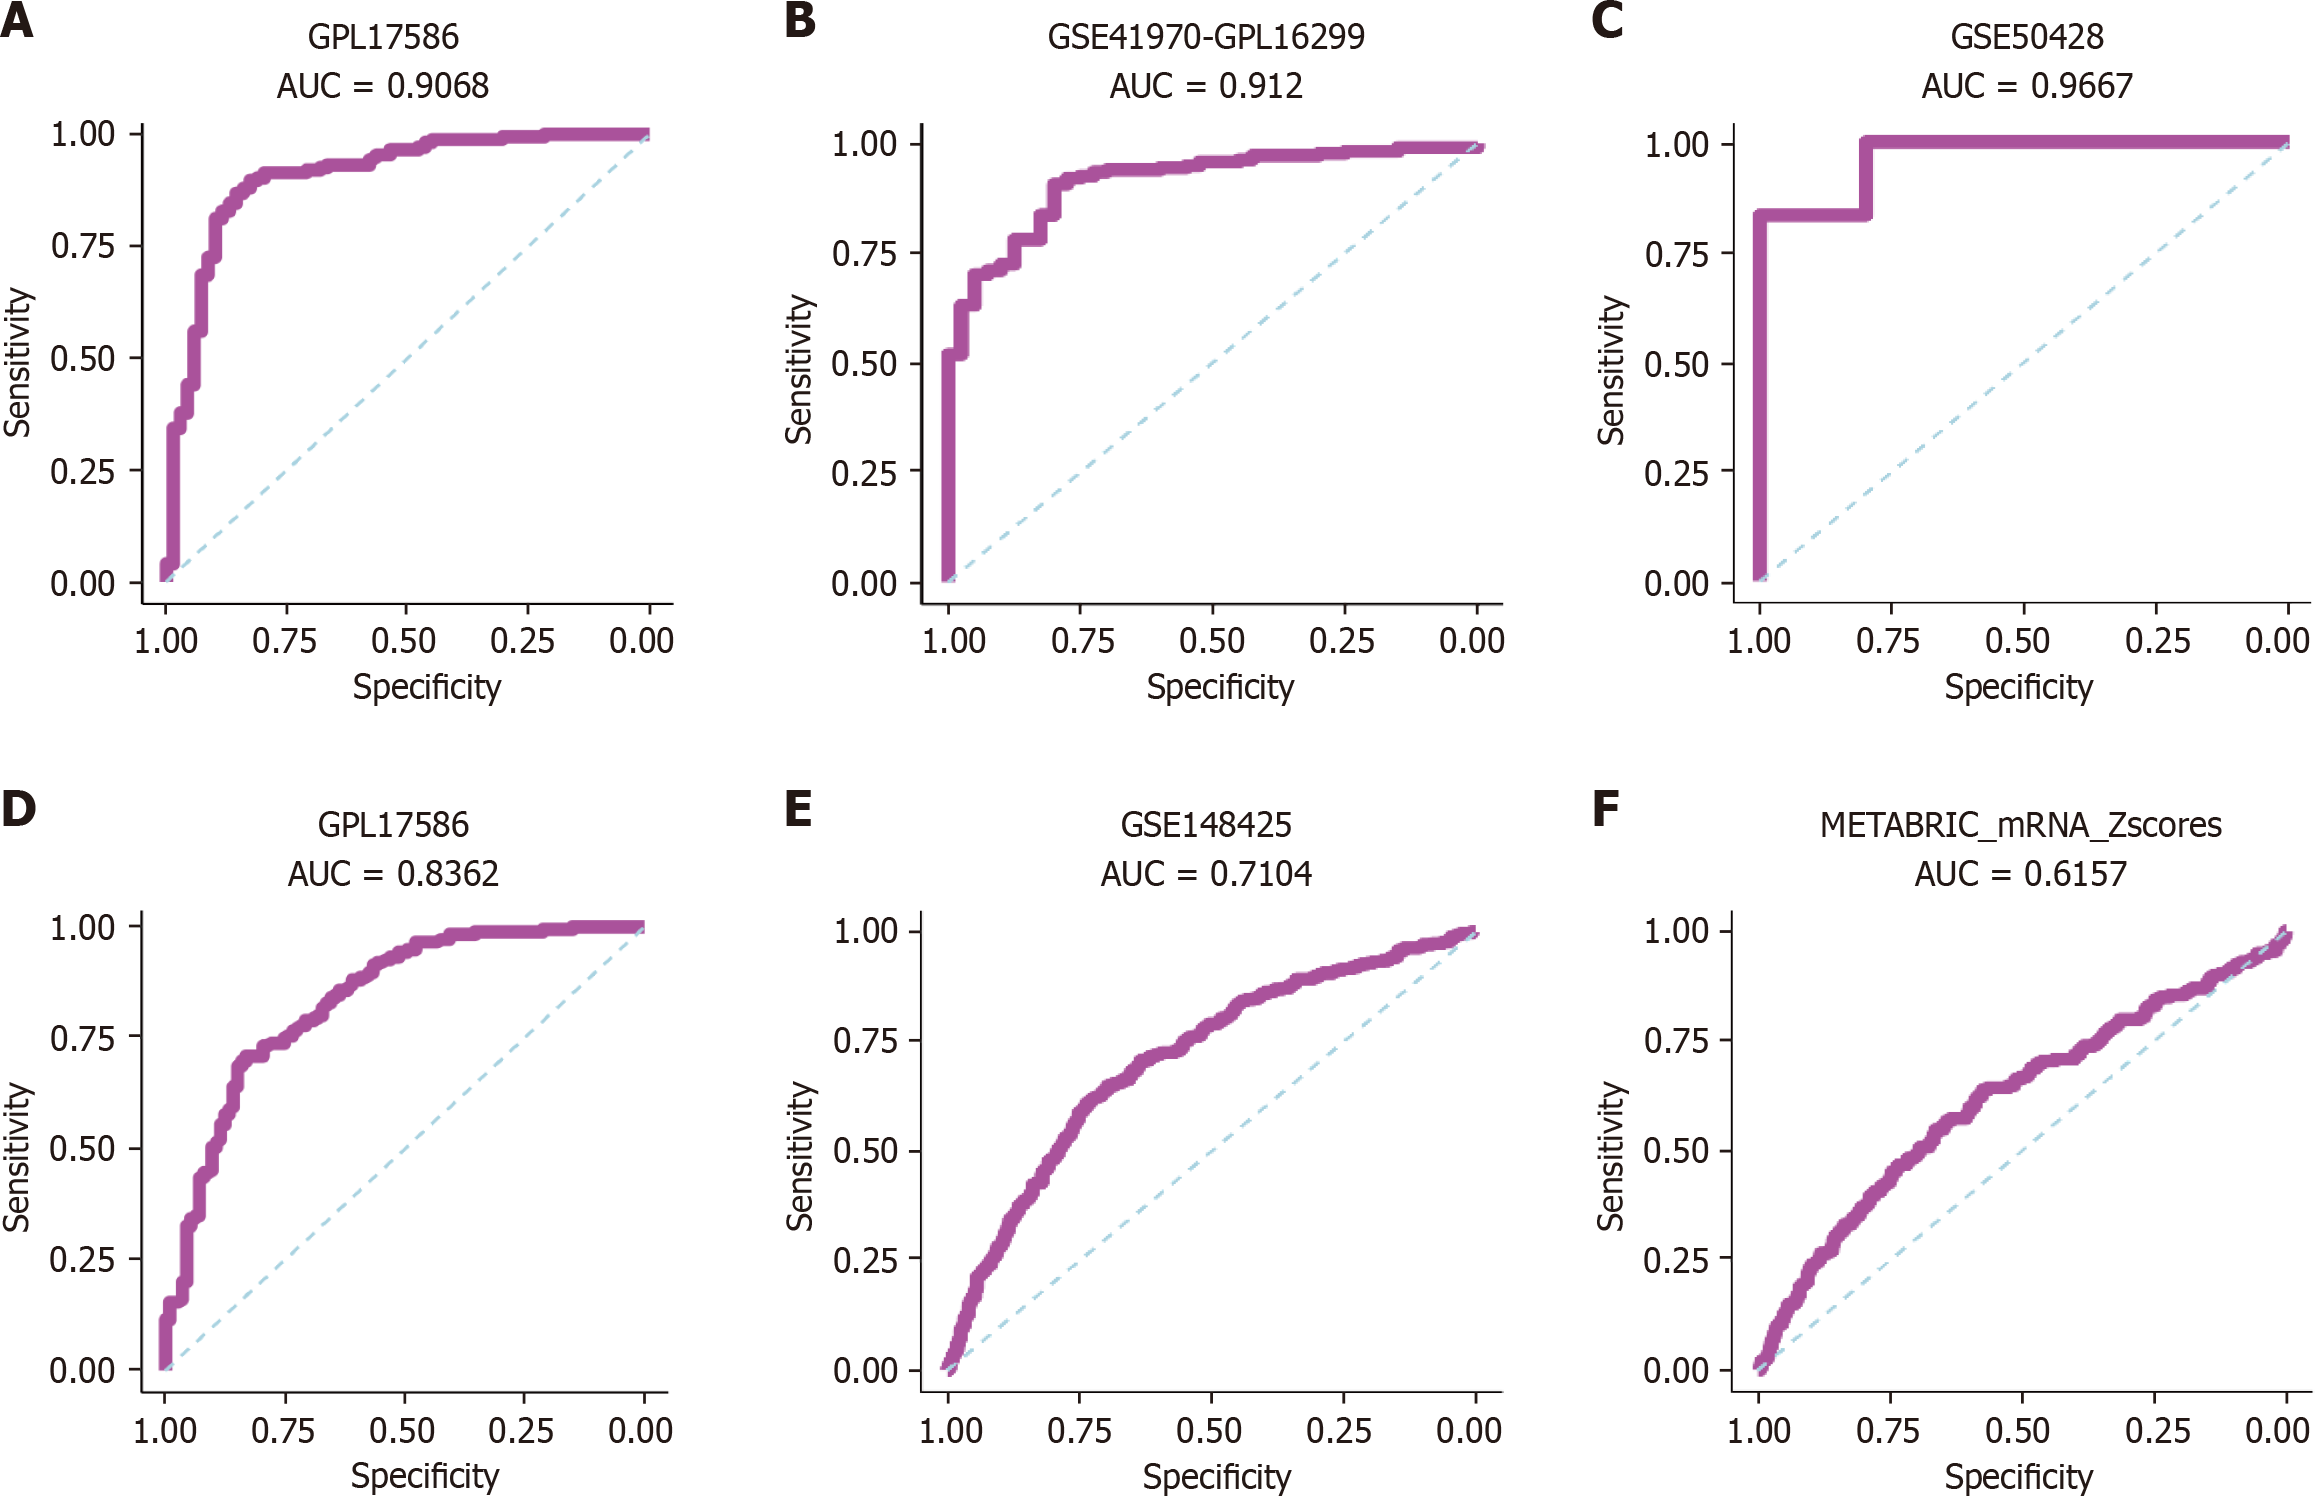
Figure 8 Receiver operating characteristic curves.
A-C: Receiver operating characteristic curves of phosphoglycerate kinase 1 expression in breast cancer tissue vs normal breast tissue. AUC: Area under the curve.
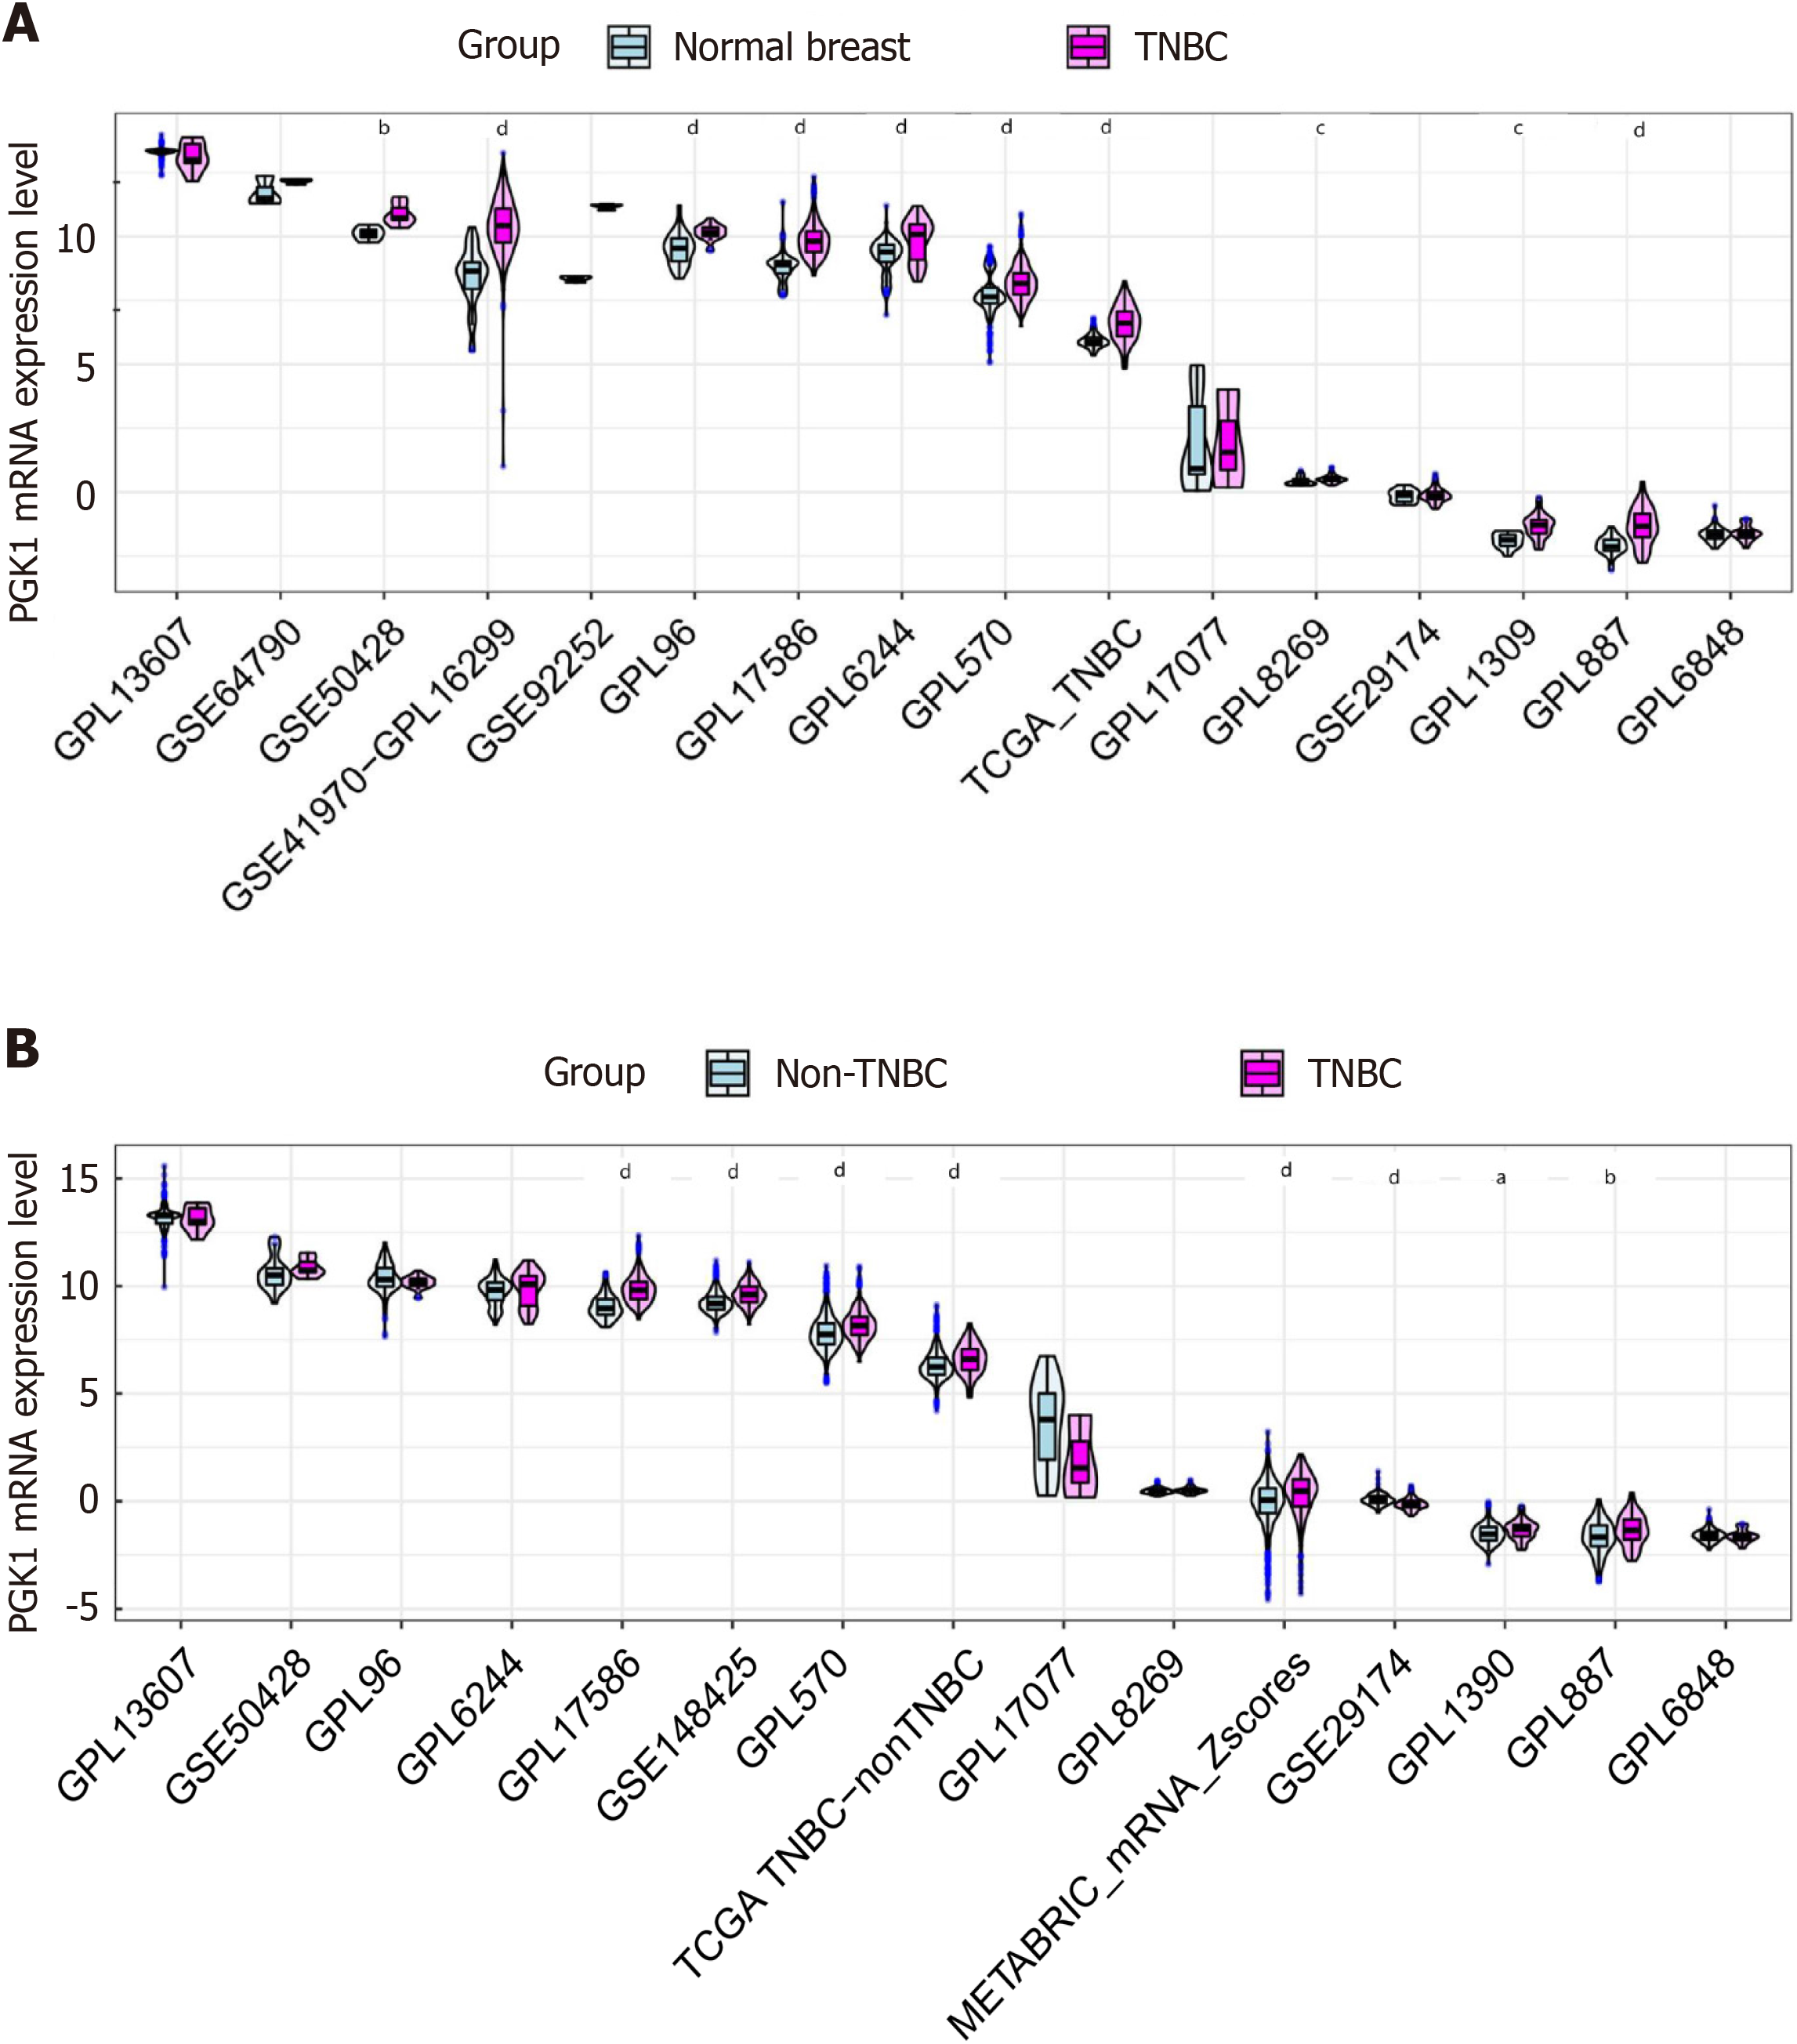
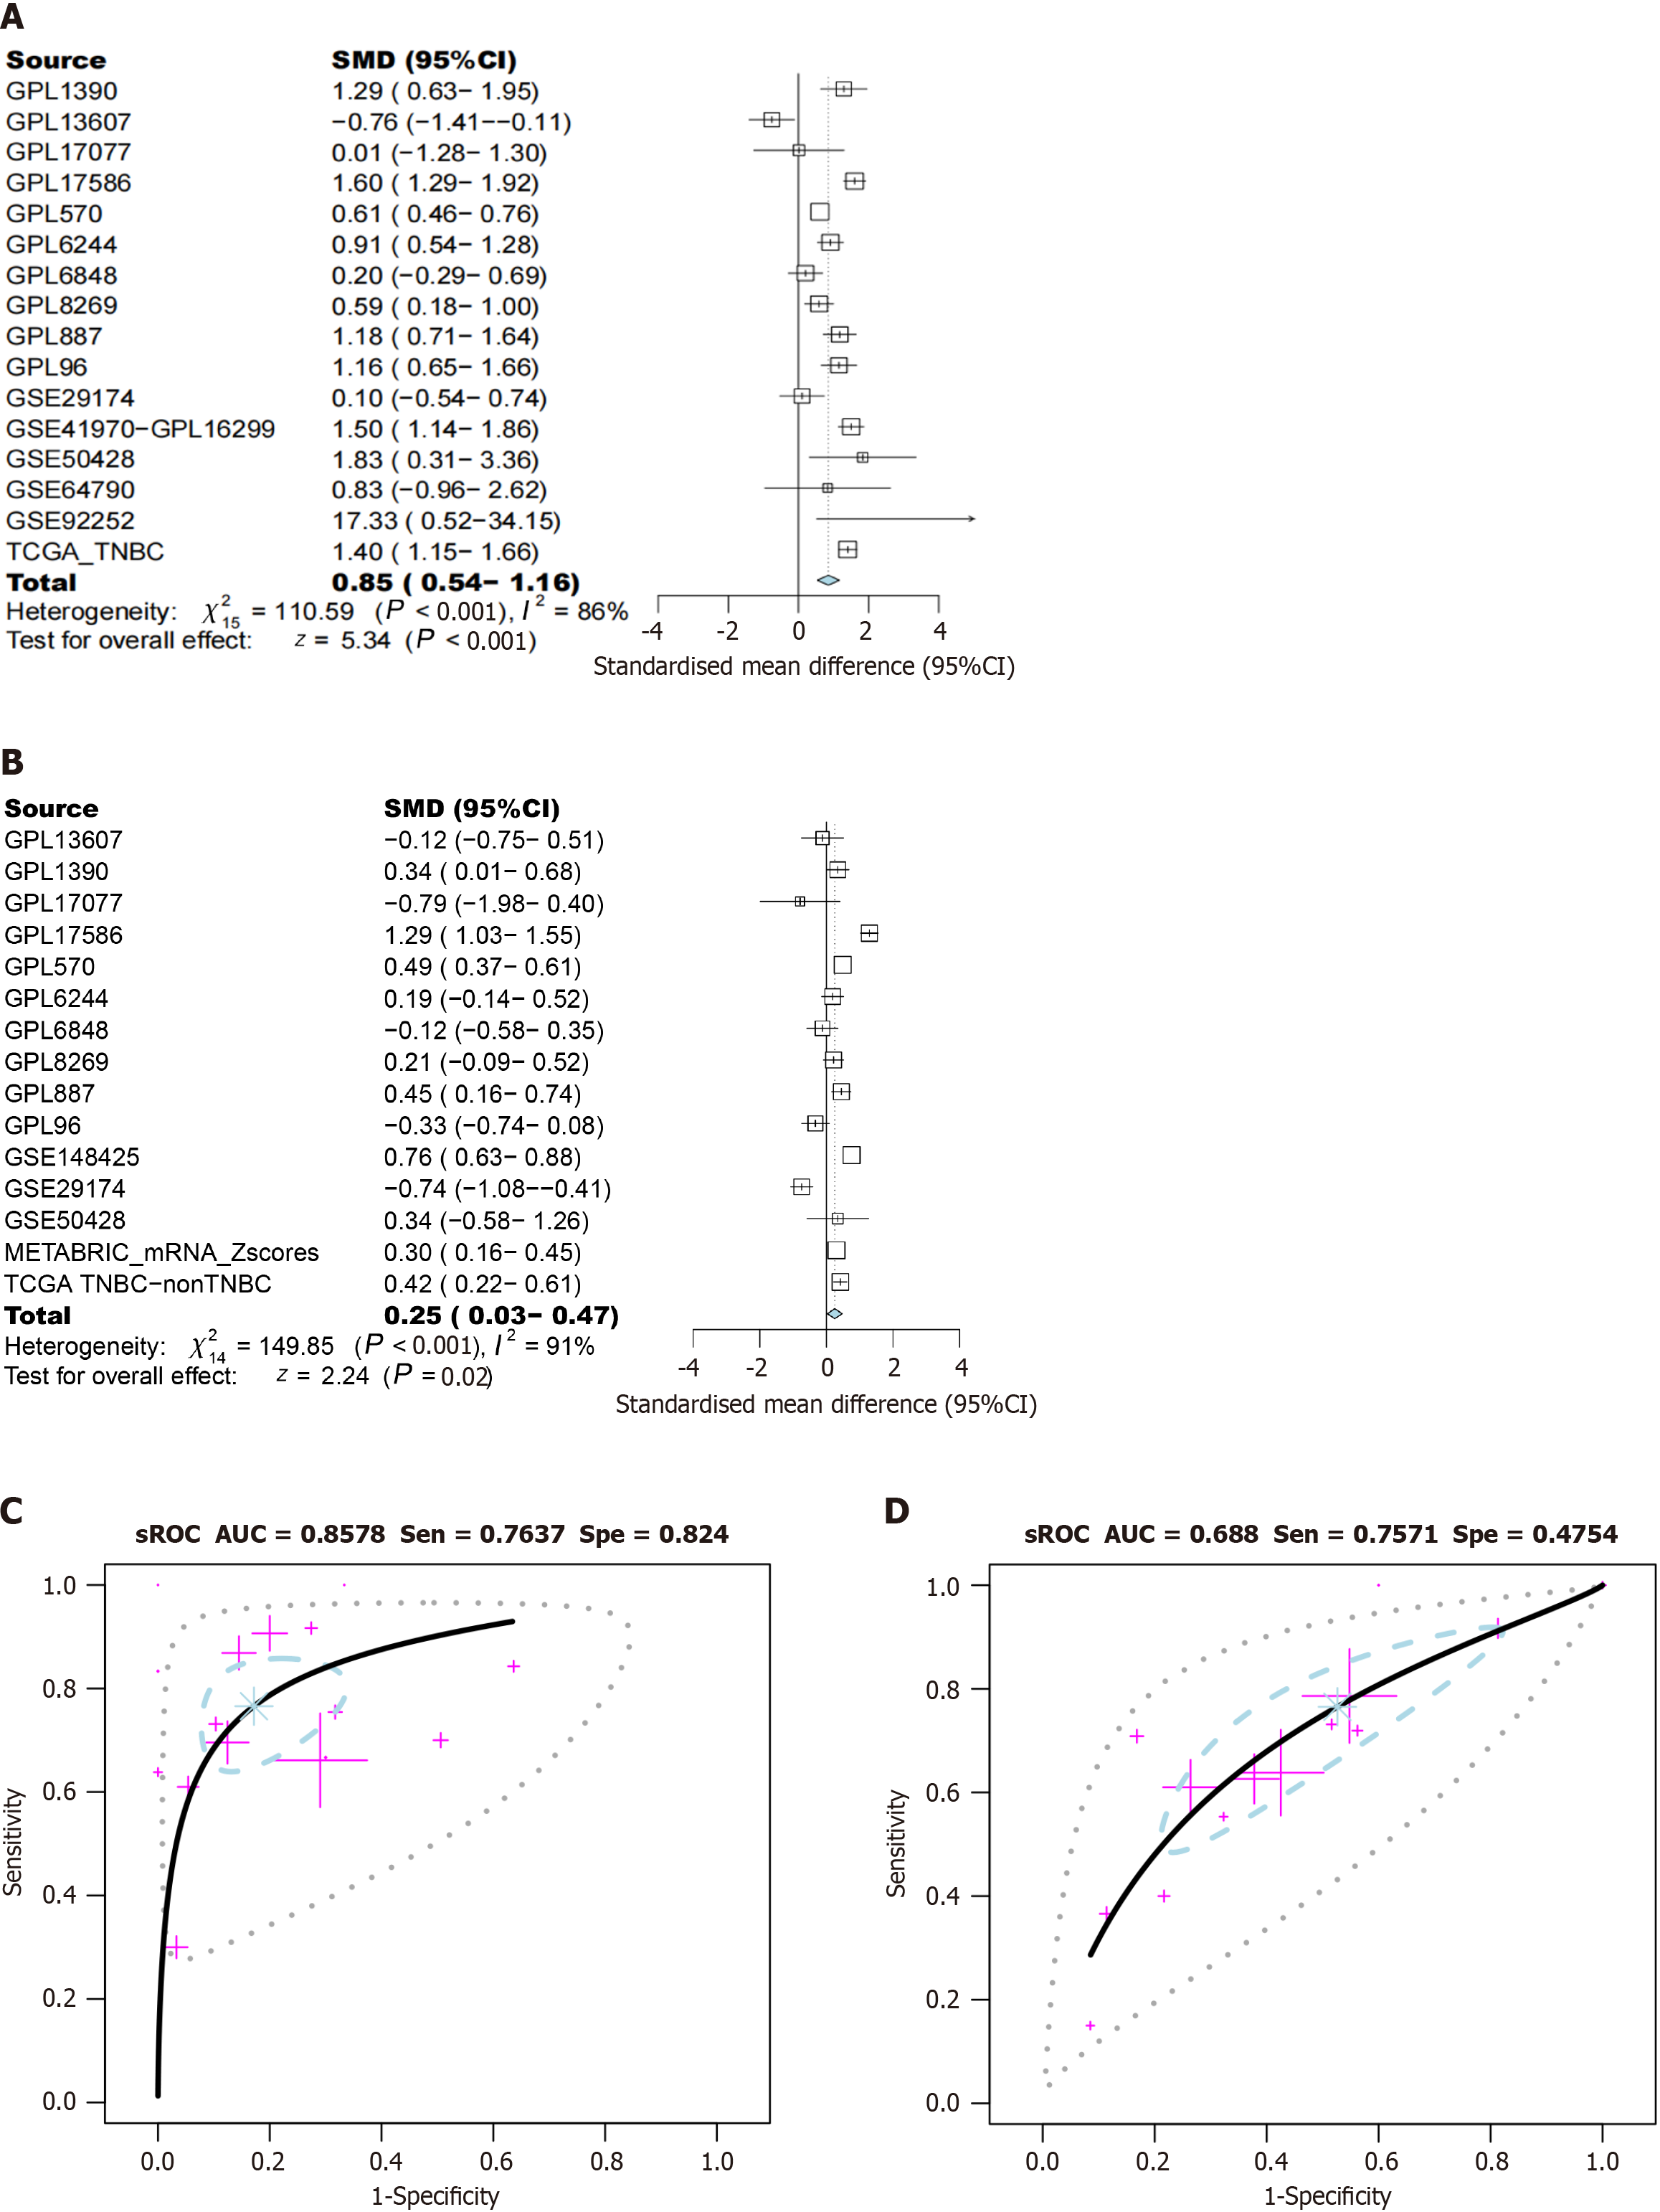
Figure 9 mRNA expression level of phosphoglycerate kinase 1 in triple-negative breast cancer.
A: Triple-negative breast cancer (TNBC) tissue vs normal breast tissue; B: TNBC tissue vs non-TNBC tissue. TNBC: Triple-negative breast cancer. aP < 0.05; bP < 0.01; cP < 0.001; dP < 0.0001.
Figure 10 Comprehensive expression levels of phosphoglycerate kinase 1 in triple-negative breast cancer.
A and C: Triple-negative breast cancer (TNBC) tissue vs normal breast tissue; B and D: TNBC tissue vs non-TNBC tissue. SMD: Standardized mean difference; 95%CI: 95% confidence interval; sROC: Summary receiver operating characteristic curve; AUC: Area under the curve; Sen: Sensitivity; Spe: Specificity.
Figure 11 Receiver operating characteristic curves for phosphoglycerate kinase 1 expression in triple-negative breast cancer.
A: Triple-negative breast cancer (TNBC) tissue vs normal breast tissue; B: TNBC tissue vs non-TNBC tissue. AUC: Area under the curve.
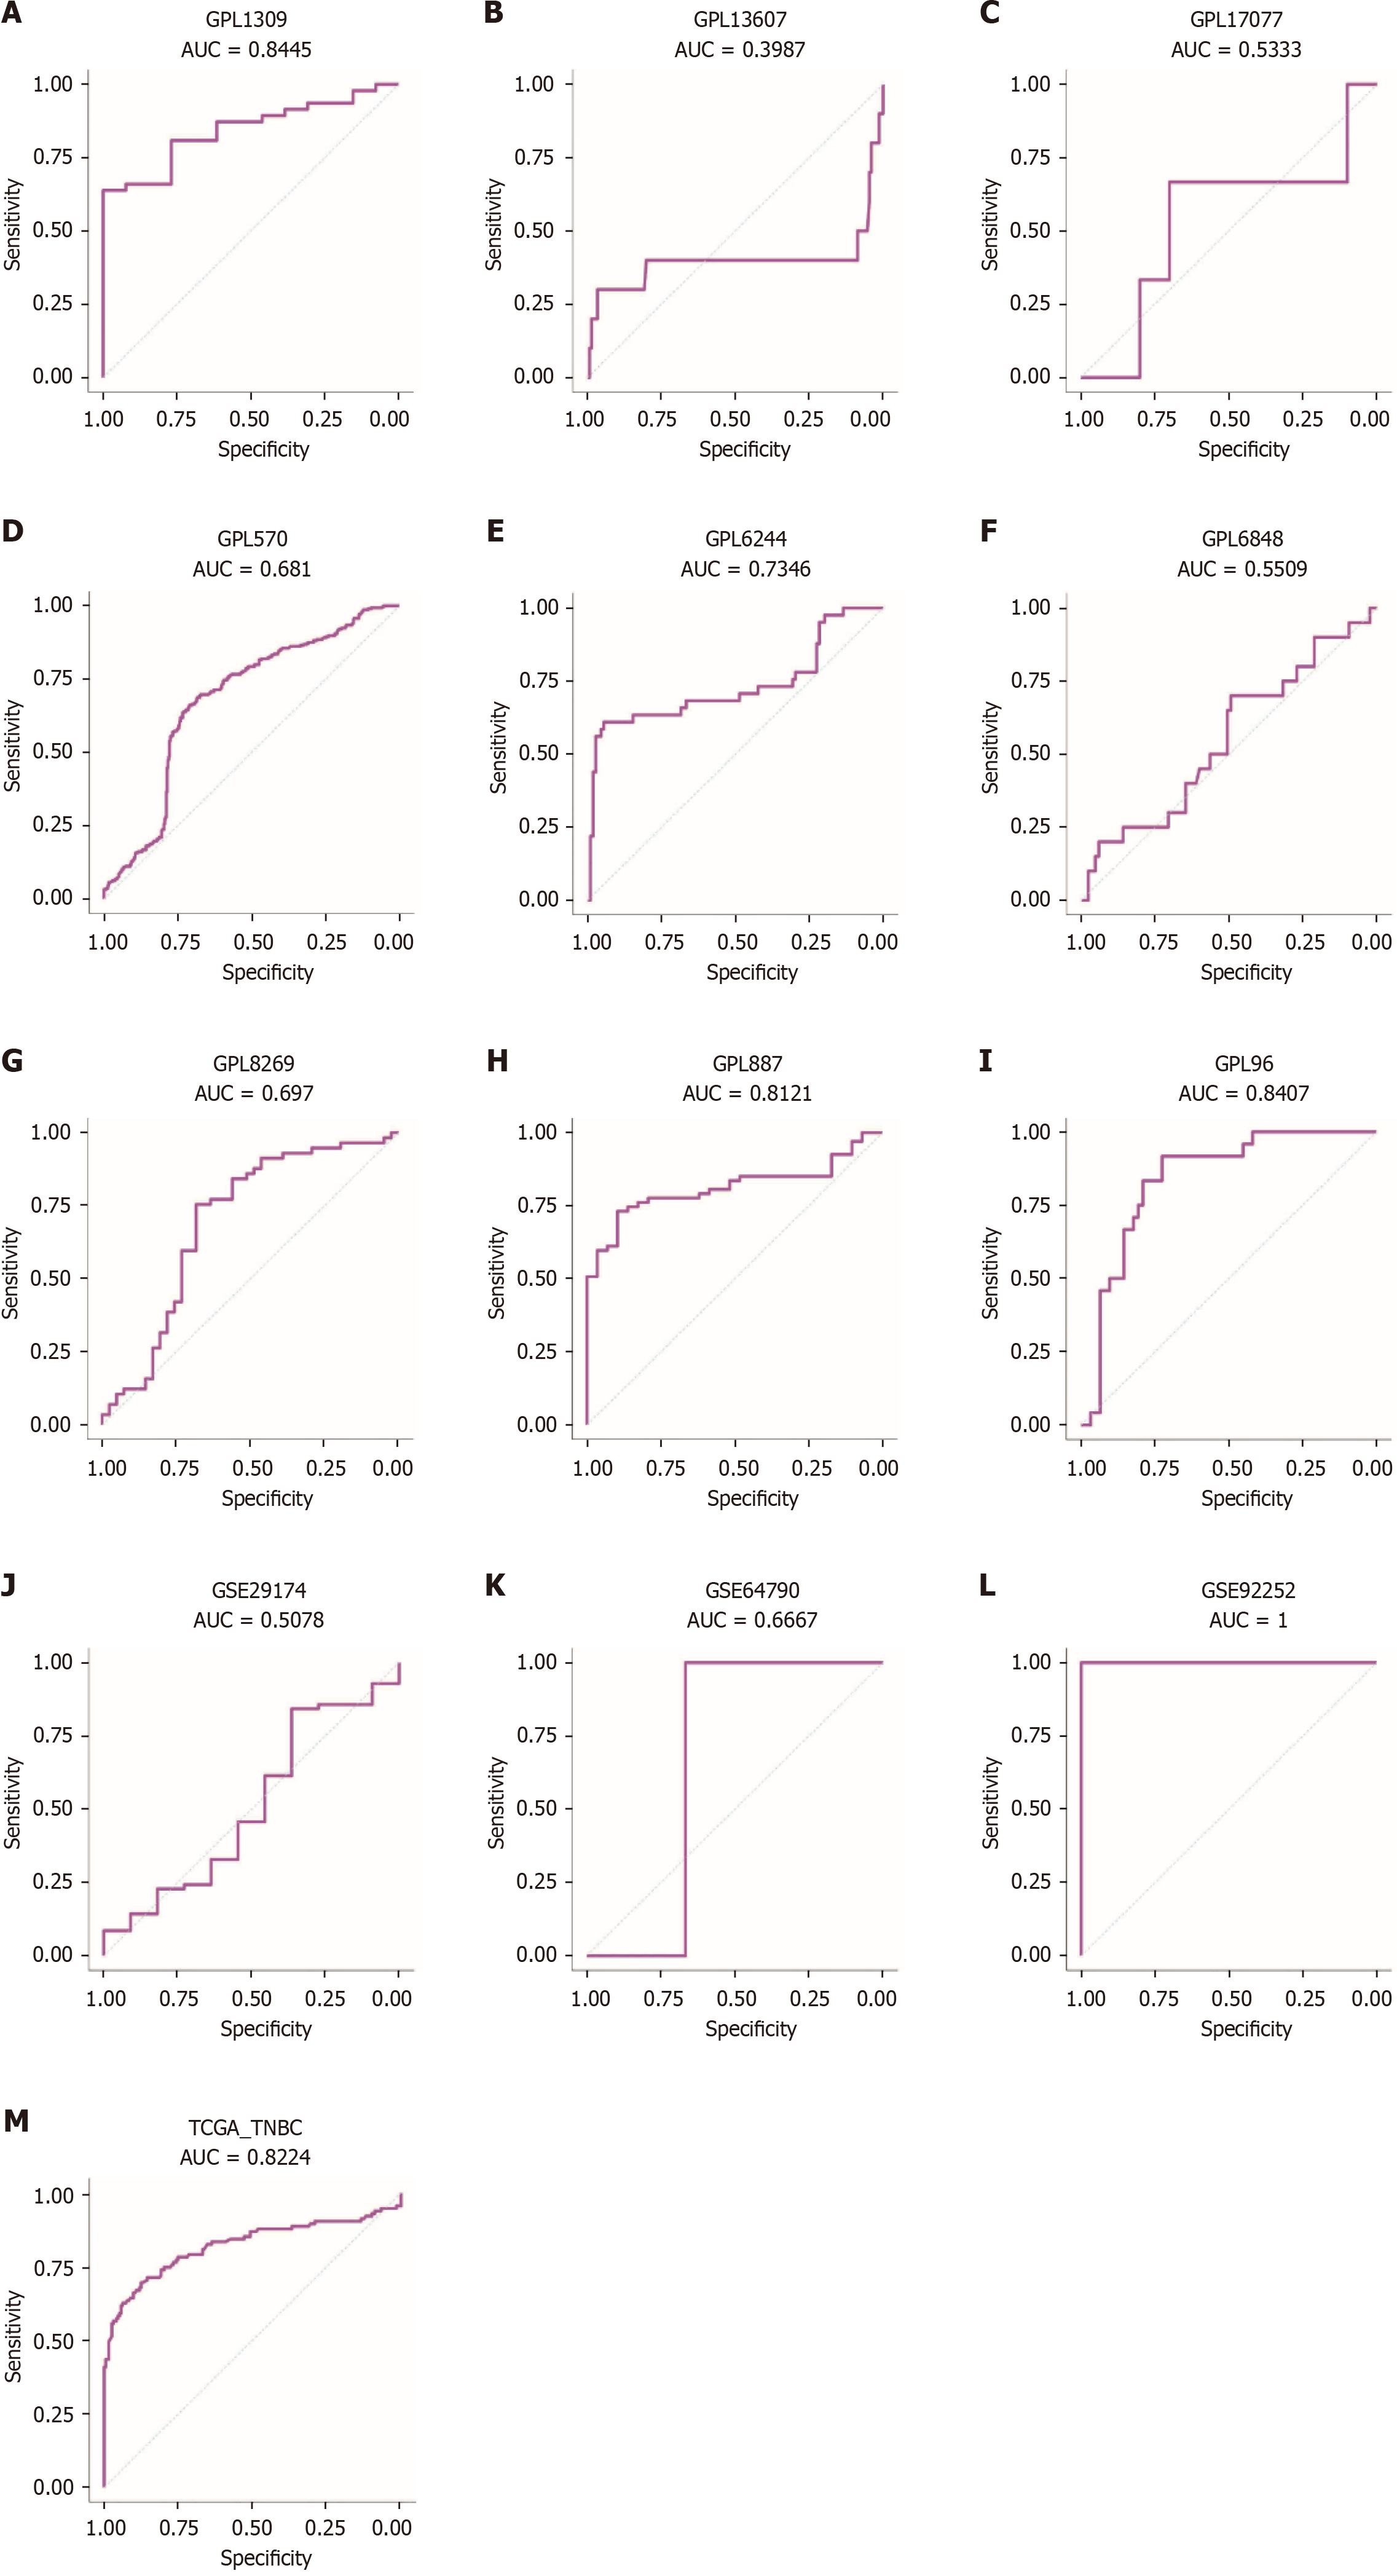
Figure 12 Receiver operating characteristic curves.
A-M: Receiver operating characteristic curves for phosphoglycerate kinase 1 expression in triple-negative breast cancer vs normal breast tissue. AUC: Area under the curve.
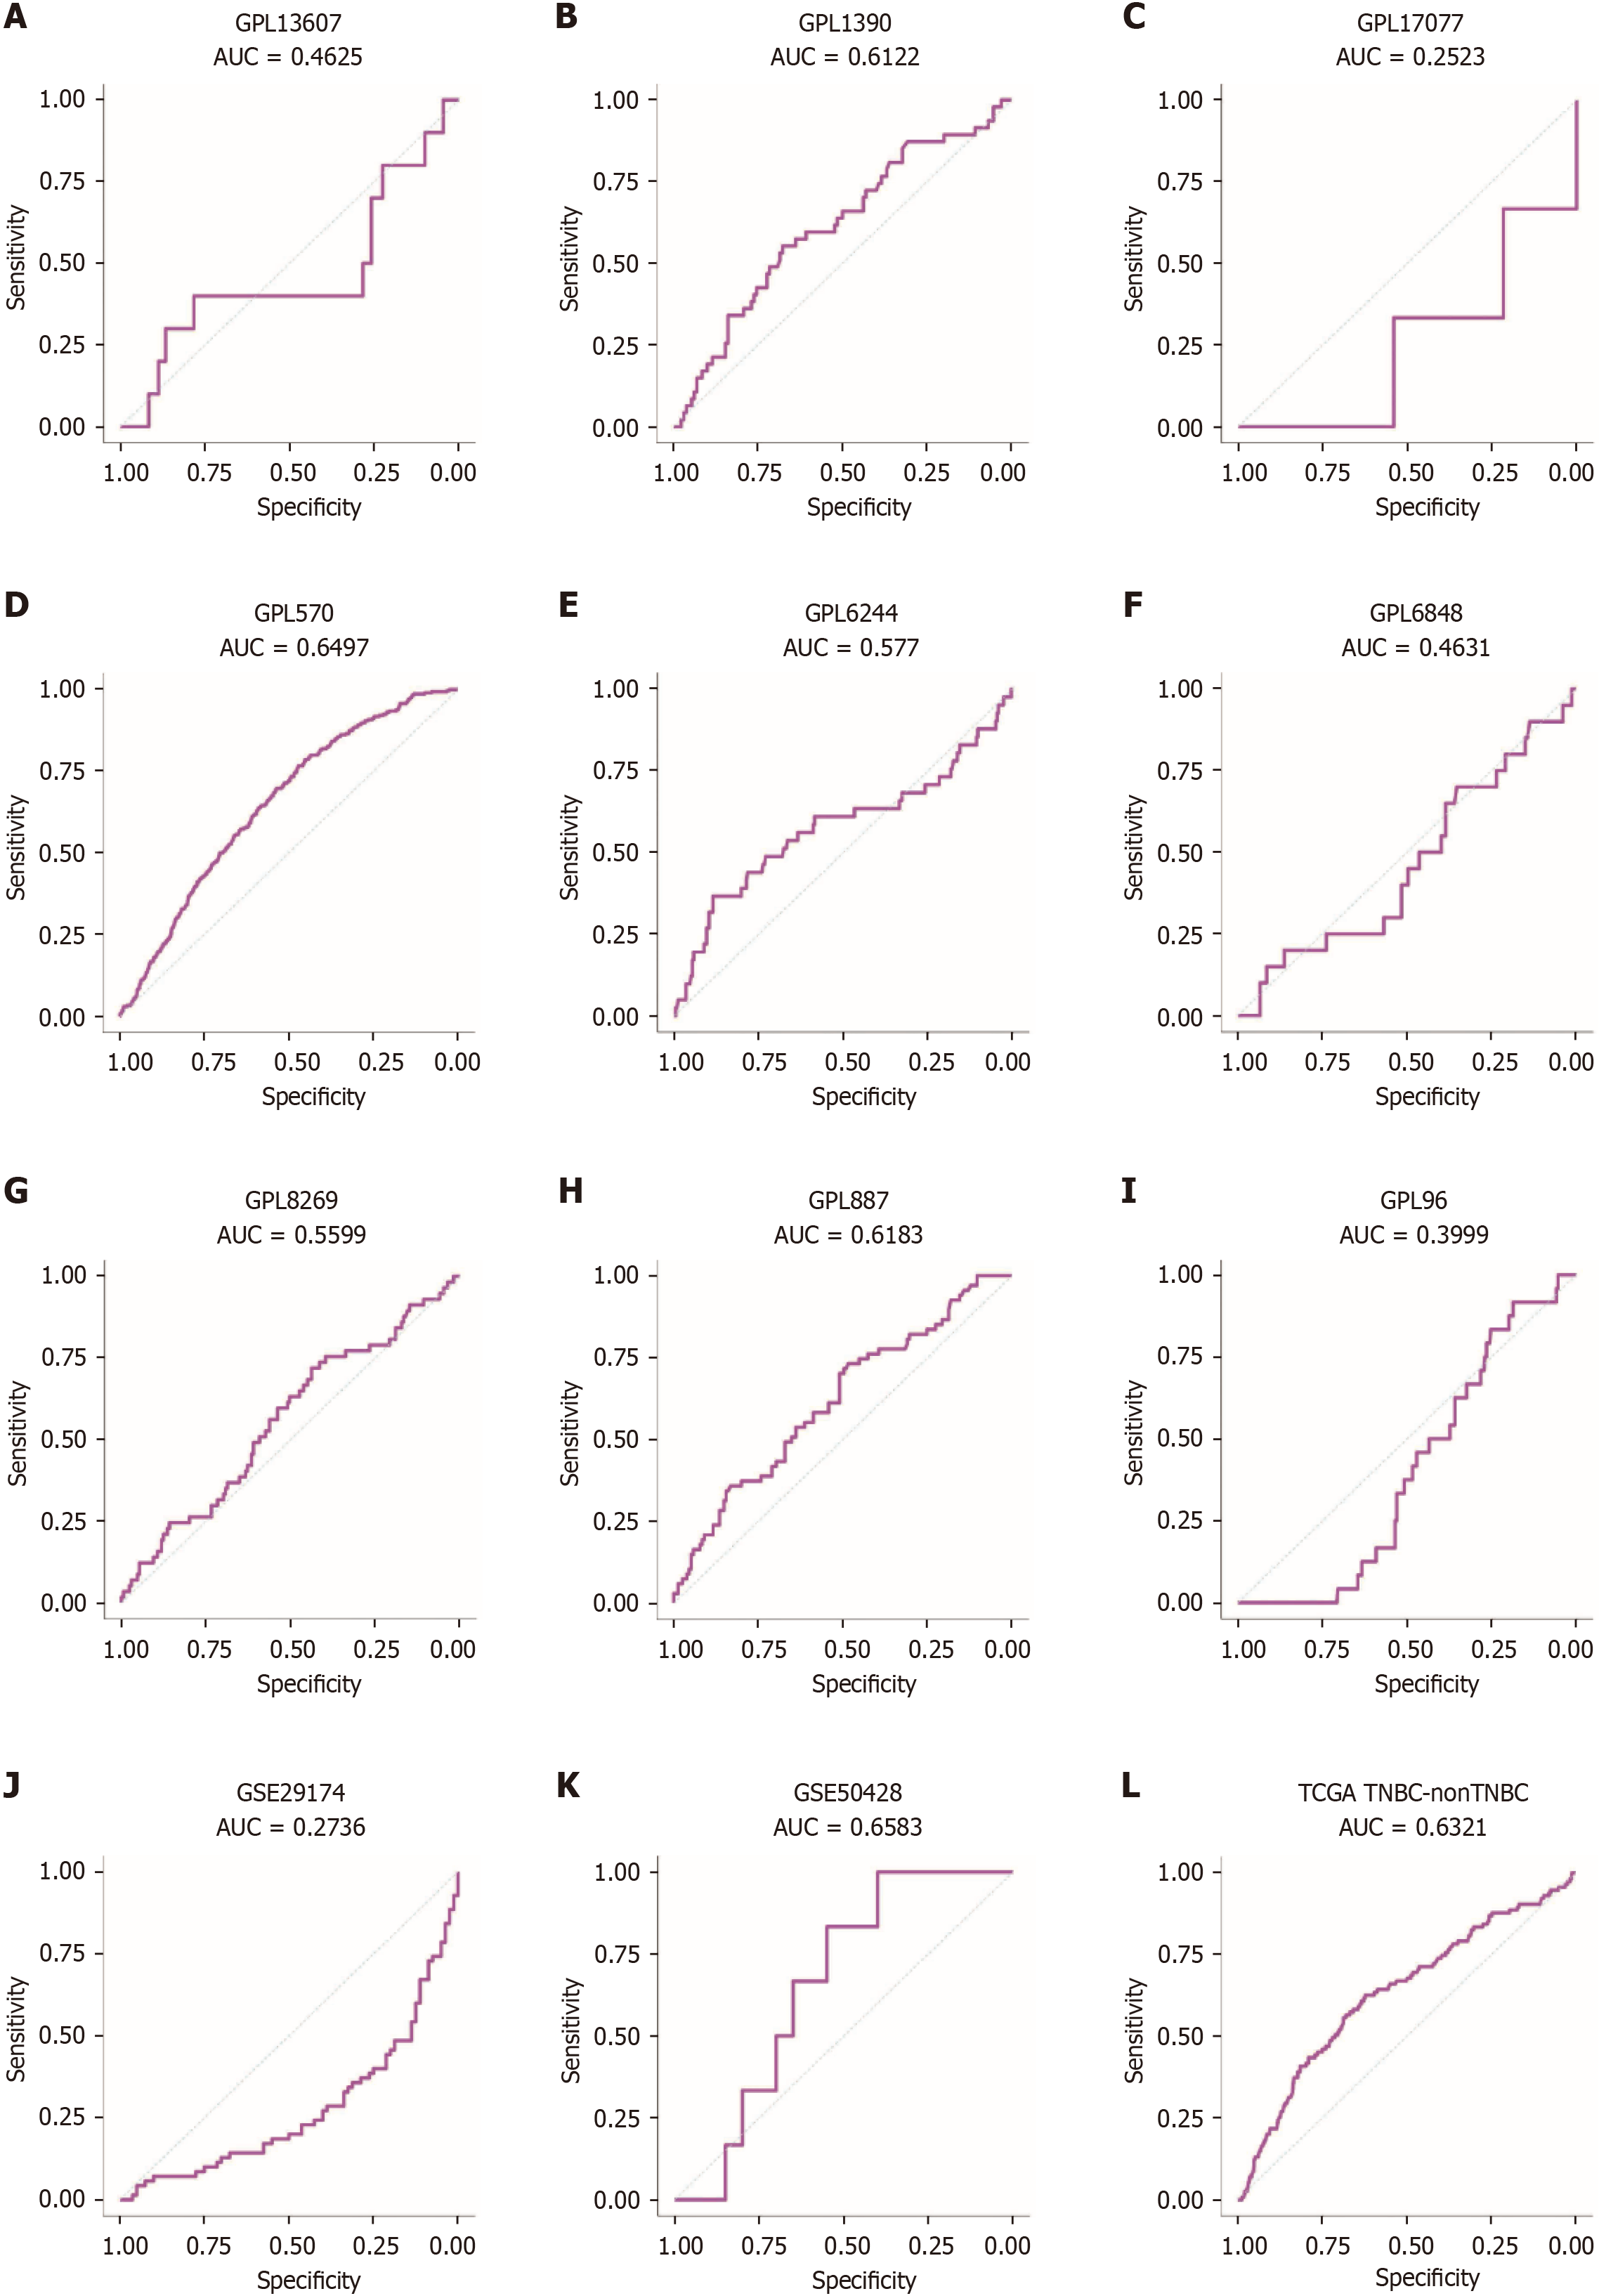
Figure 13 Receiver operating characteristic curves.
A-L: Receiver operating characteristic curves for phosphoglycerate kinase 1 expression in triple-negative breast cancer vs non-triple-negative breast cancers. AUC: Area under the curve.
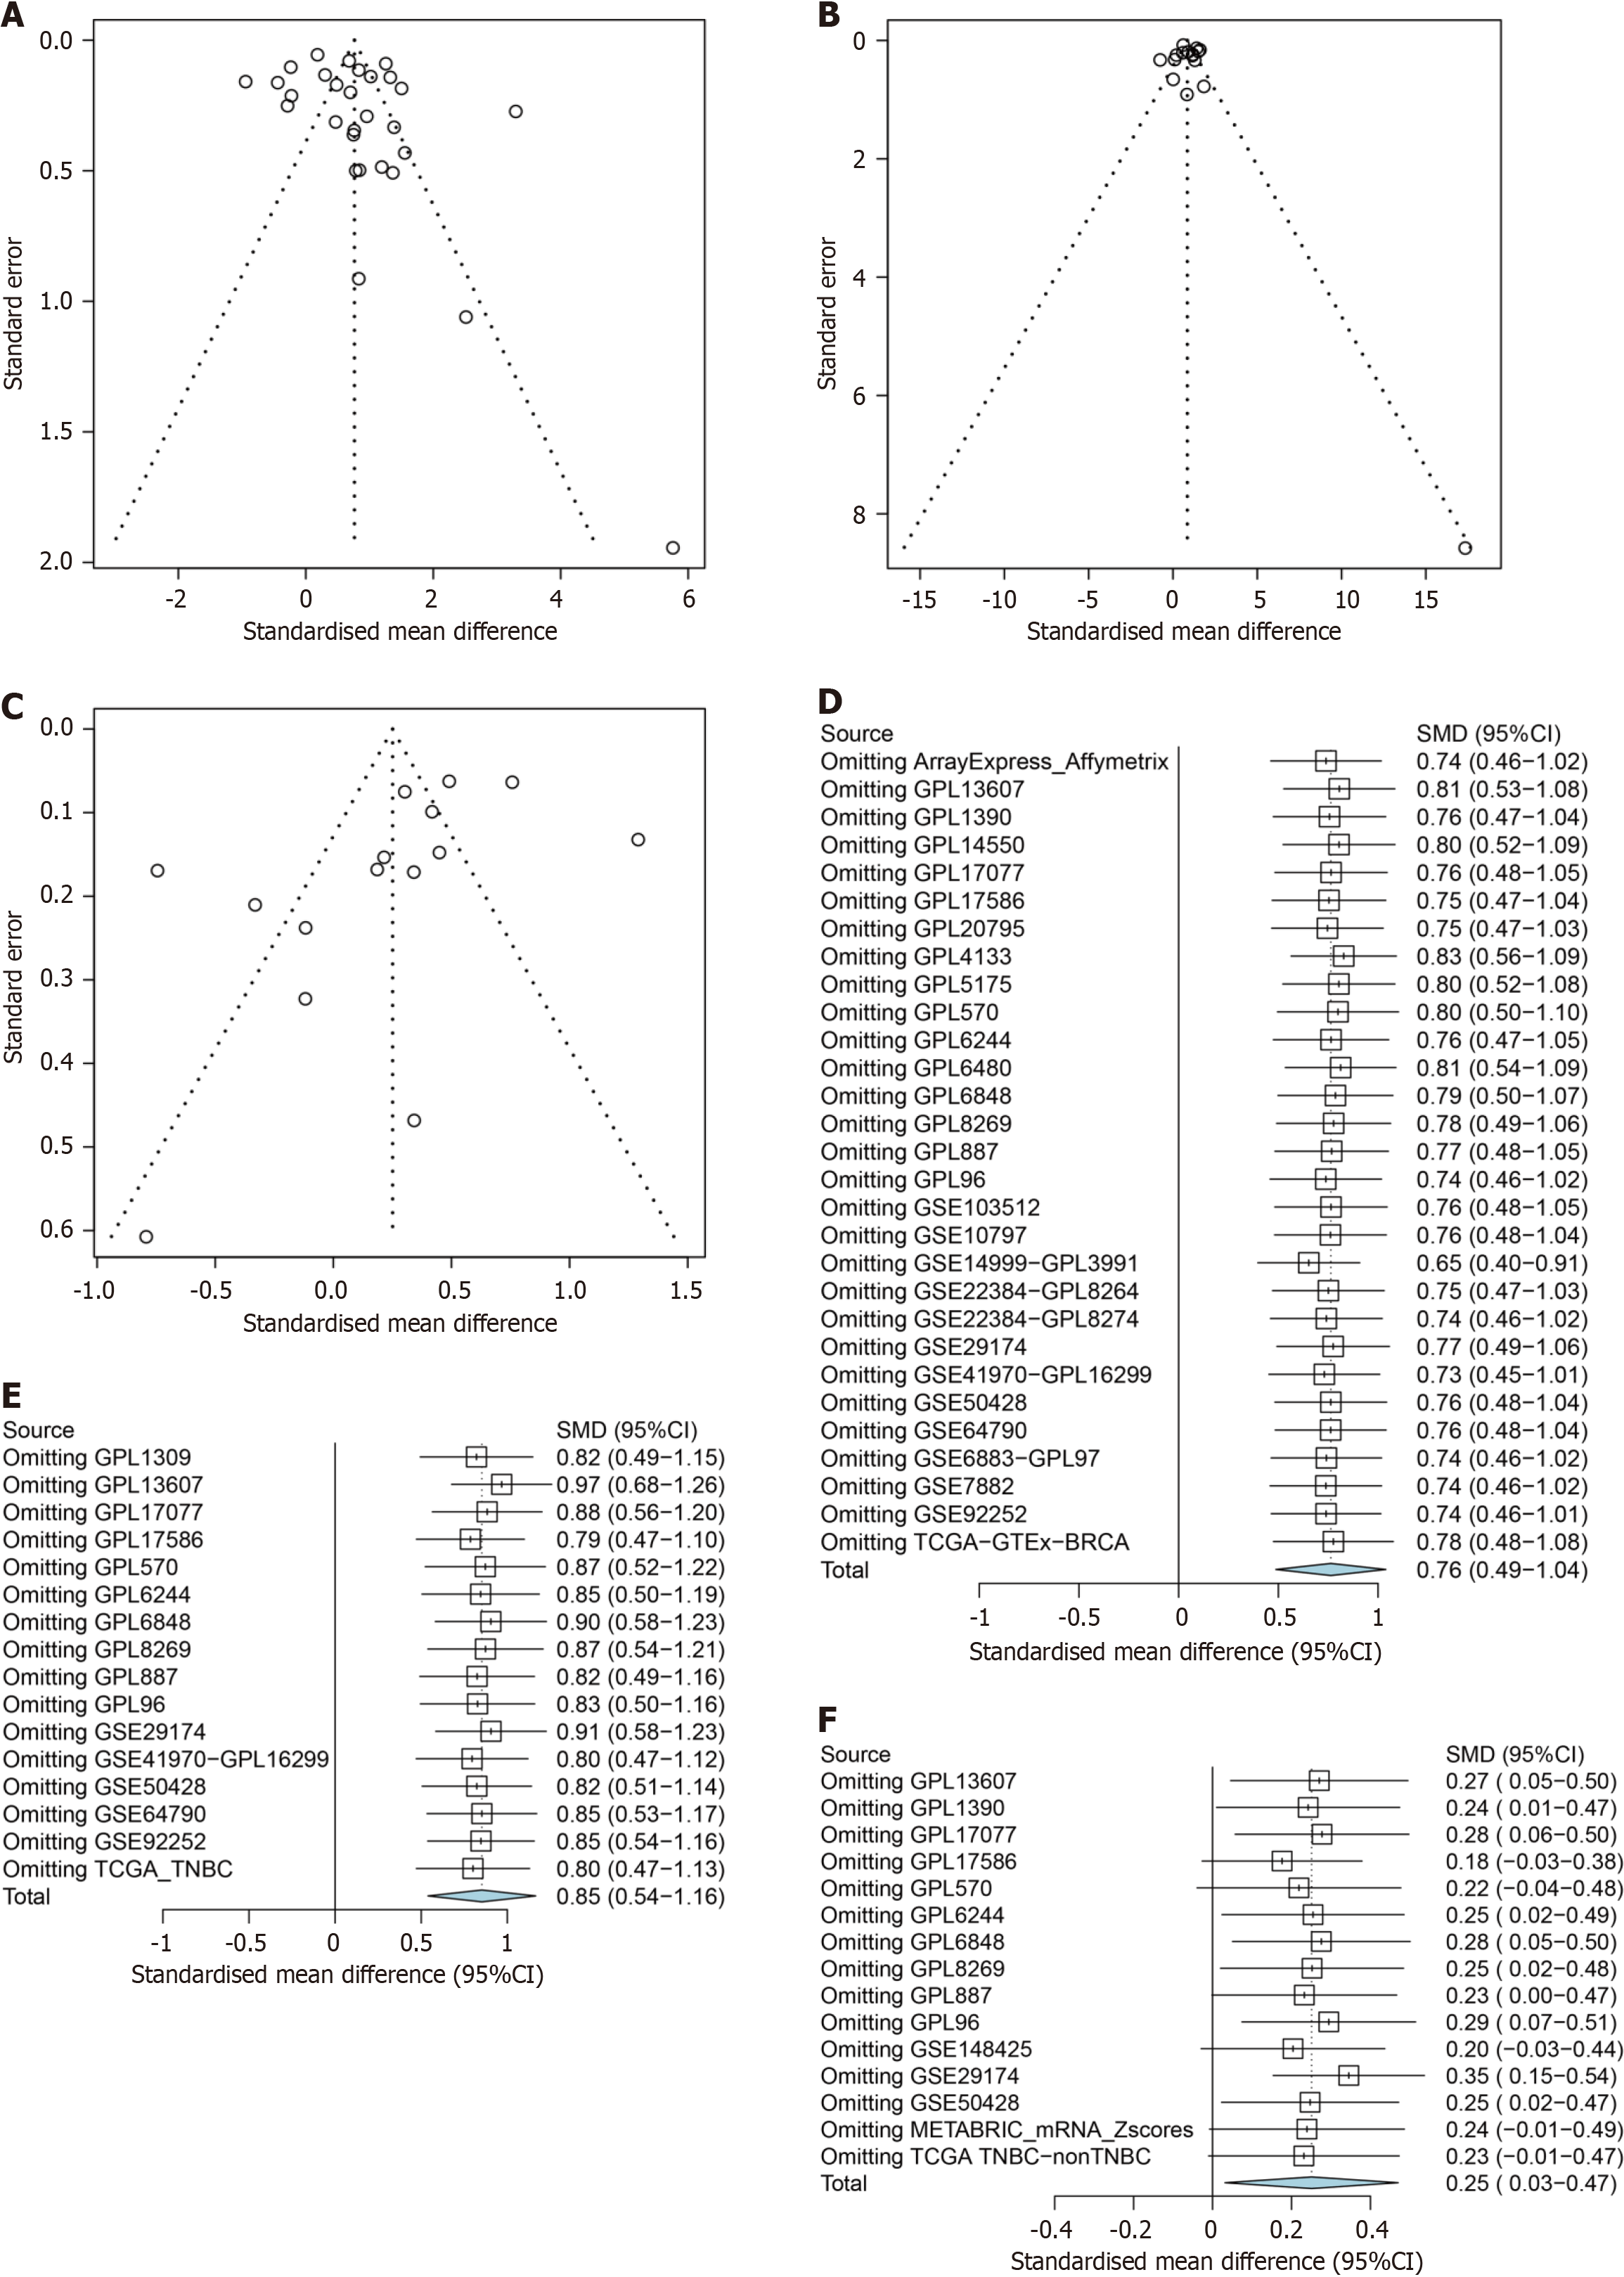
Figure 14 Funnel plots and forest plots for phosphoglycerate kinase 1 expression in breast cancer.
A-C: Publication bias detection based on breast cancer (BC) vs normal breast tissue, triple-negative BC (TNBC) vs normal breast tissue, and TNBC vs non-TNBC tissue; D-F: Sensitivity analysis based on BC vs normal breast tissue, TNBC vs normal breast tissue, and TNBC vs non-TNBC tissue.
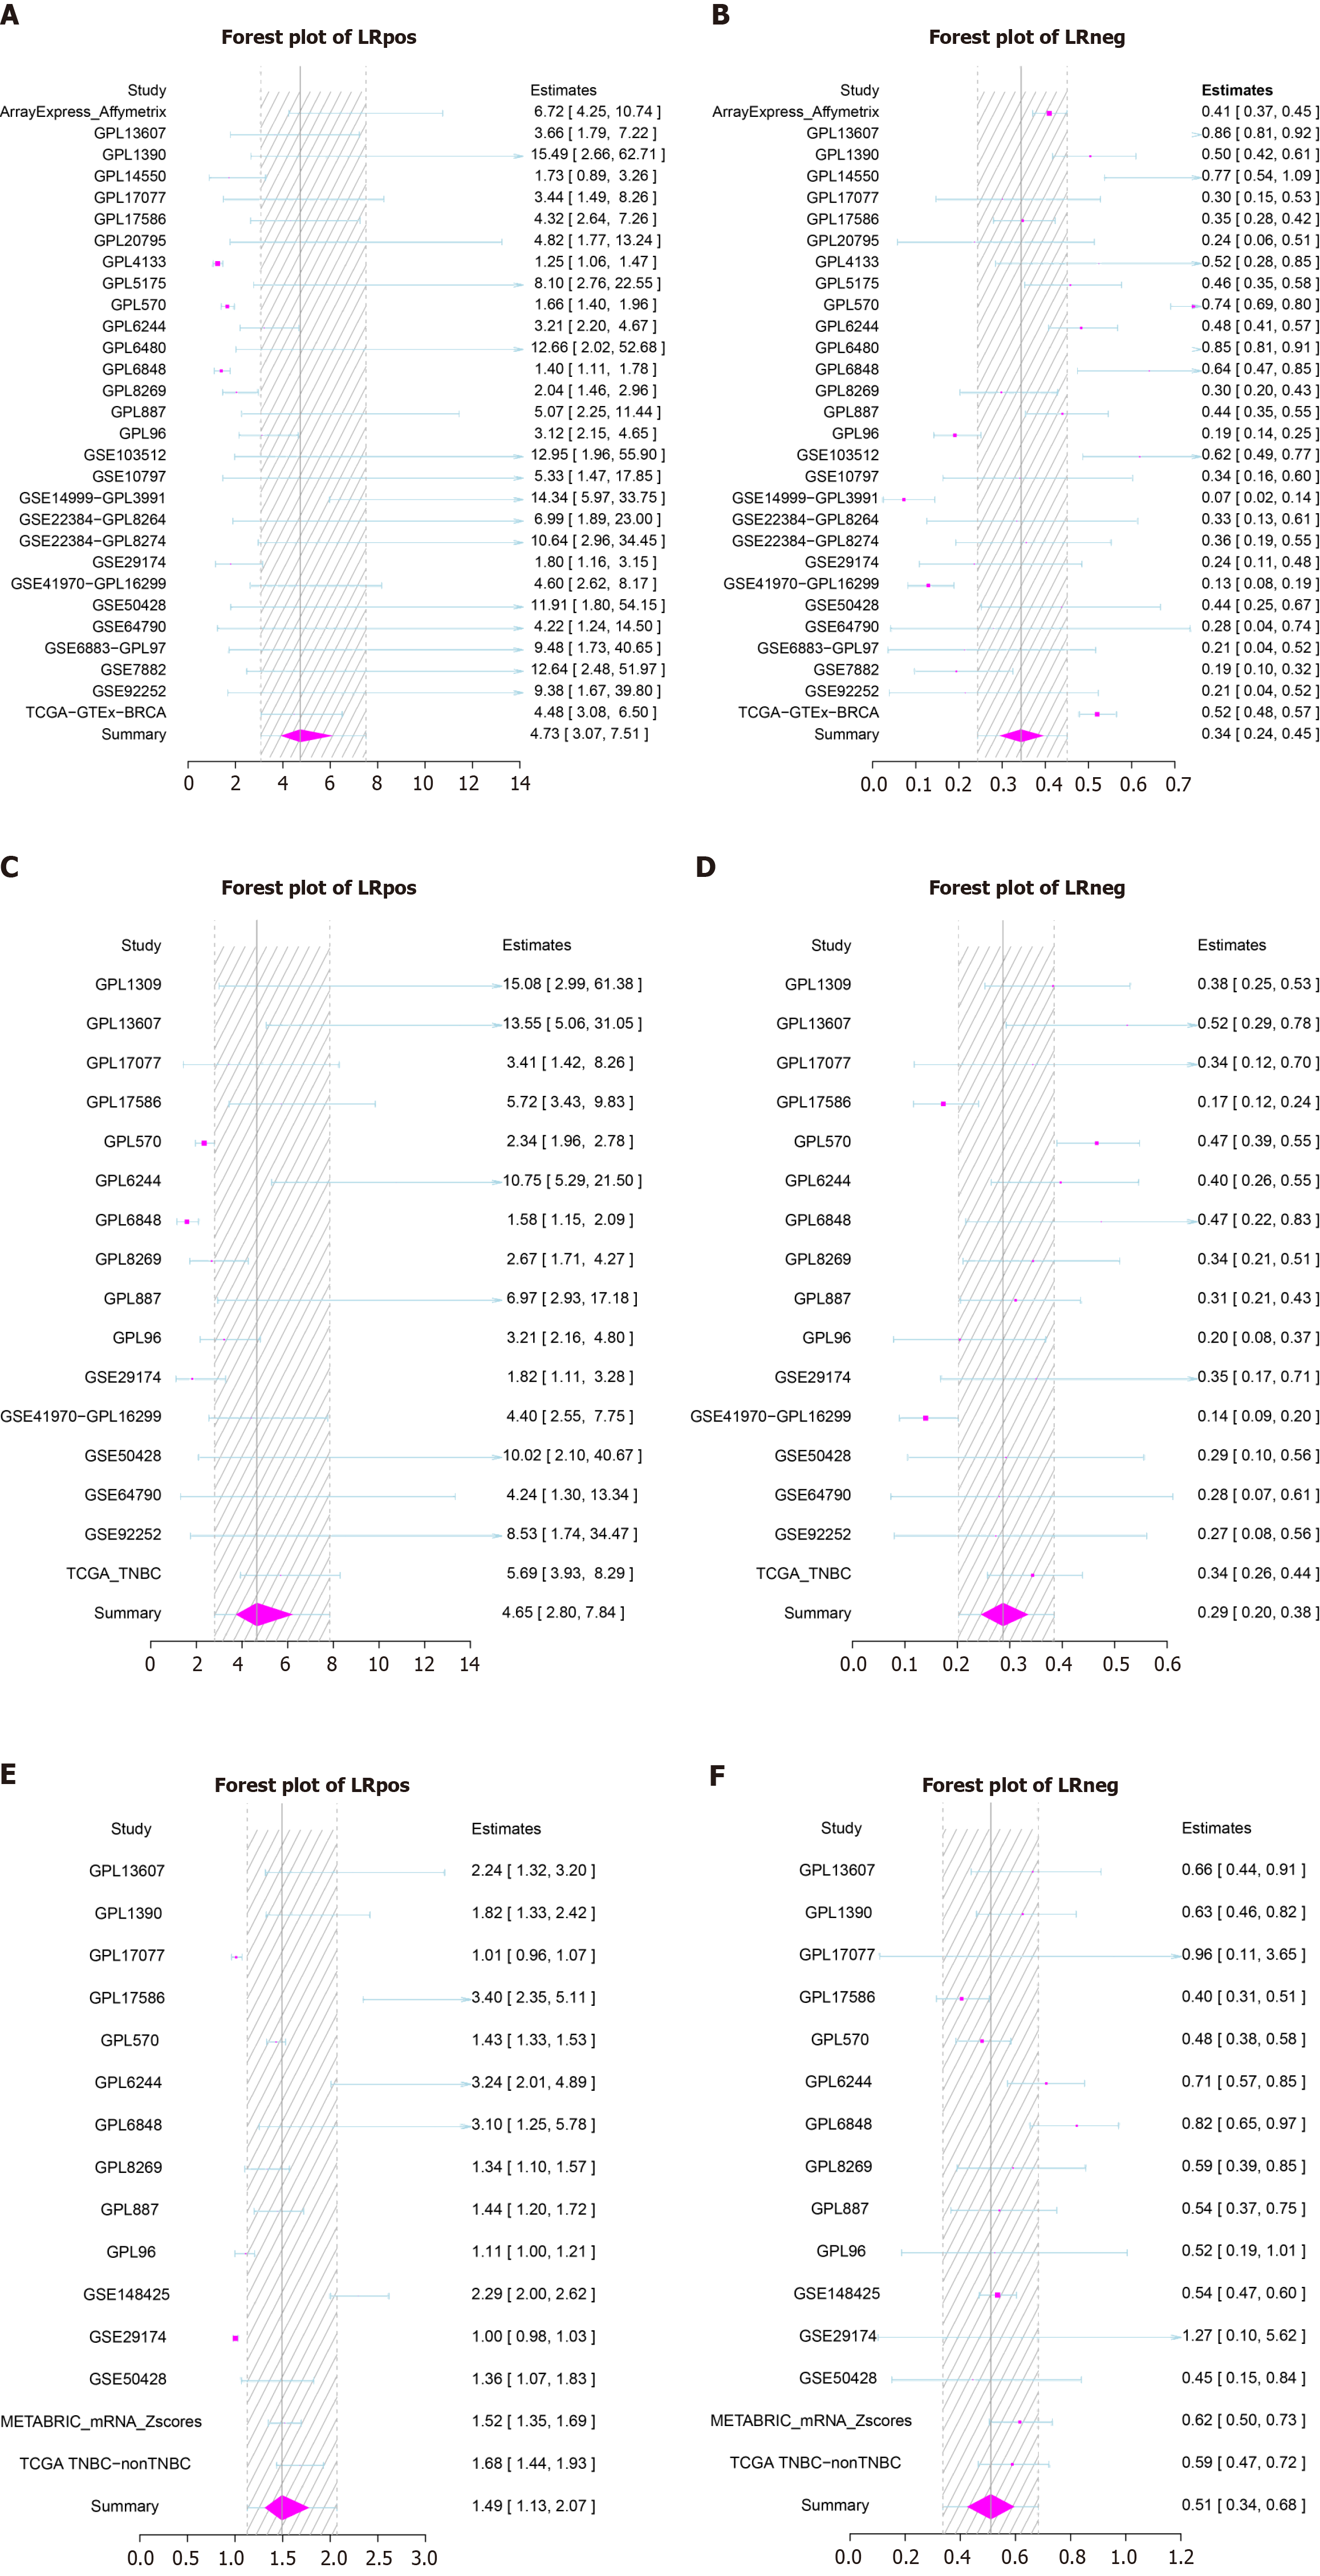
Figure 15 Forest plots of positive likelihood ratio (LRpos) and negative likelihood ratio (LRneg) for phosphoglycerate kinase 1 expression based on different groups.
A and B: Breast cancer (BC) vs normal breast tissue; C and D: Triple-negative BC (TNBC) vs normal breast tissue; E and F: TNBC vs non-TNBC tissue.
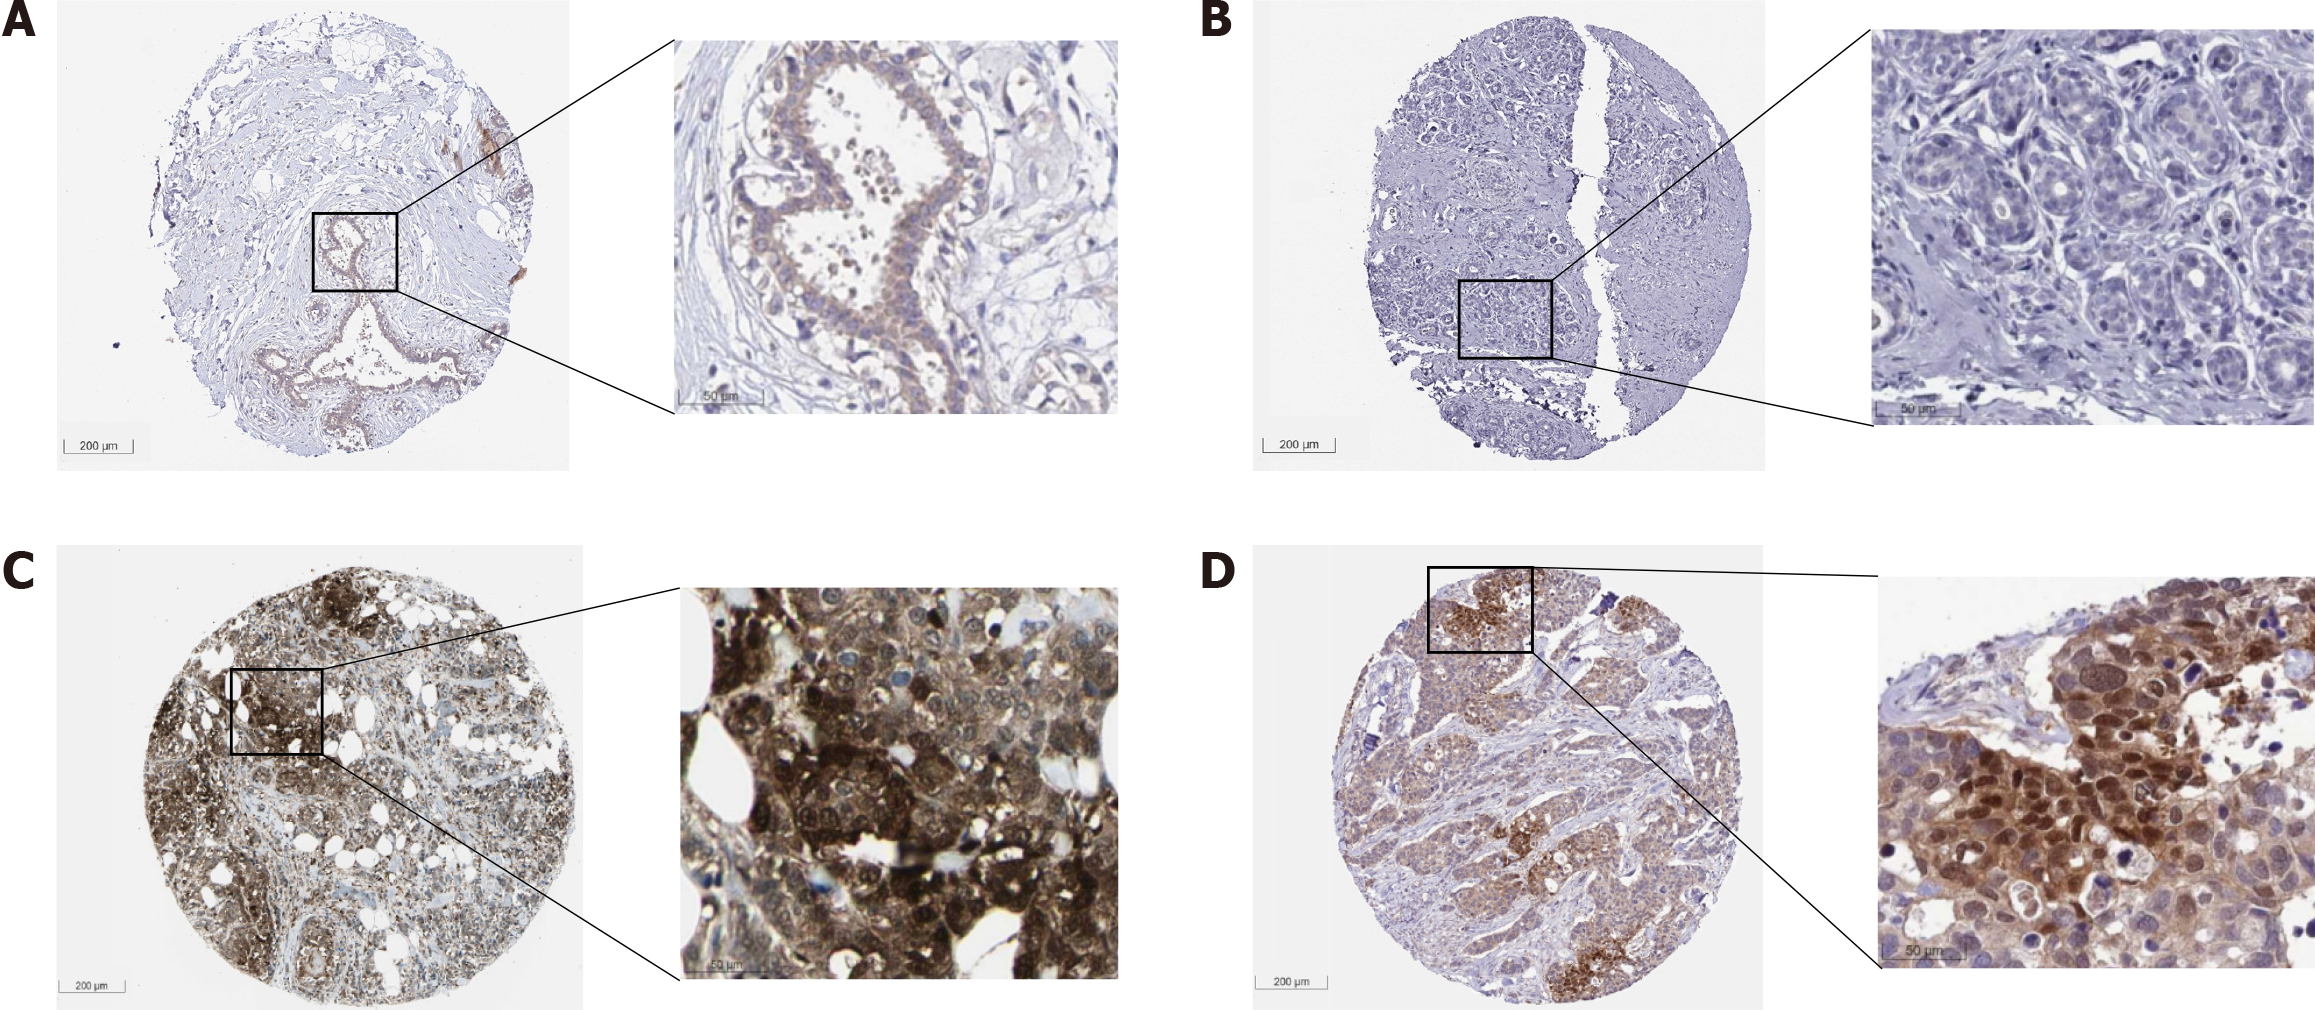
Figure 16 Immunohistochemistry staining from the Human Protein Atlas showing low or no expression of phosphoglycerate kinase 1 in normal breast tissue cells, and high expression in breast cancer cells.
A: HPA045385, female, age 45, breast (T-04000), normal tissue, NOS (M-00100), Patient ID: 3544 (low or no expression). (1) Adipocytes. Staining: Not detected; Intensity: Weak; Quantity: < 25%; Location: cytoplasmic/membranous; (2) Glandular cells. Staining: Low; Intensity: Weak; Quantity: > 75%; Location: cytoplasmic/membranous; and (3) Myoepithelial cells. Staining: Low; Intensity: Weak; Quantity: > 75%; Location: Cytoplasmic/membranous; B: HPA073644, female, age 43, breast (T-04000), skin (T-01000), normal tissue, NOS (M-00100), Patient ID: 2104 (low or no expression). Adipocytes, glandular cells, and myoepithelial cells. Staining: Not detected; Intensity: Negative; Quantity: None; C: CAB010065, female, age 59, breast (T-04000), lobular carcinoma (M-85203), Patient ID: 2805 (high expression). (1) Tumor cells. Staining: High; Intensity: Strong; Quantity: 75%-25%; Location: Cytoplasmic/membranous nuclear; D: HPA045385, female, age 83, breast (T-04000), duct carcinoma (M-85003), Patient ID: 2160 (high expression). (1) Tumor cells. Staining: High. Intensity: Strong. Quantity: 75%-25%. Location: Cytoplasmic/membranous nuclear. These immunohistochemical protein expression figures were from the Human Protein Atlas (THPA) database [71].
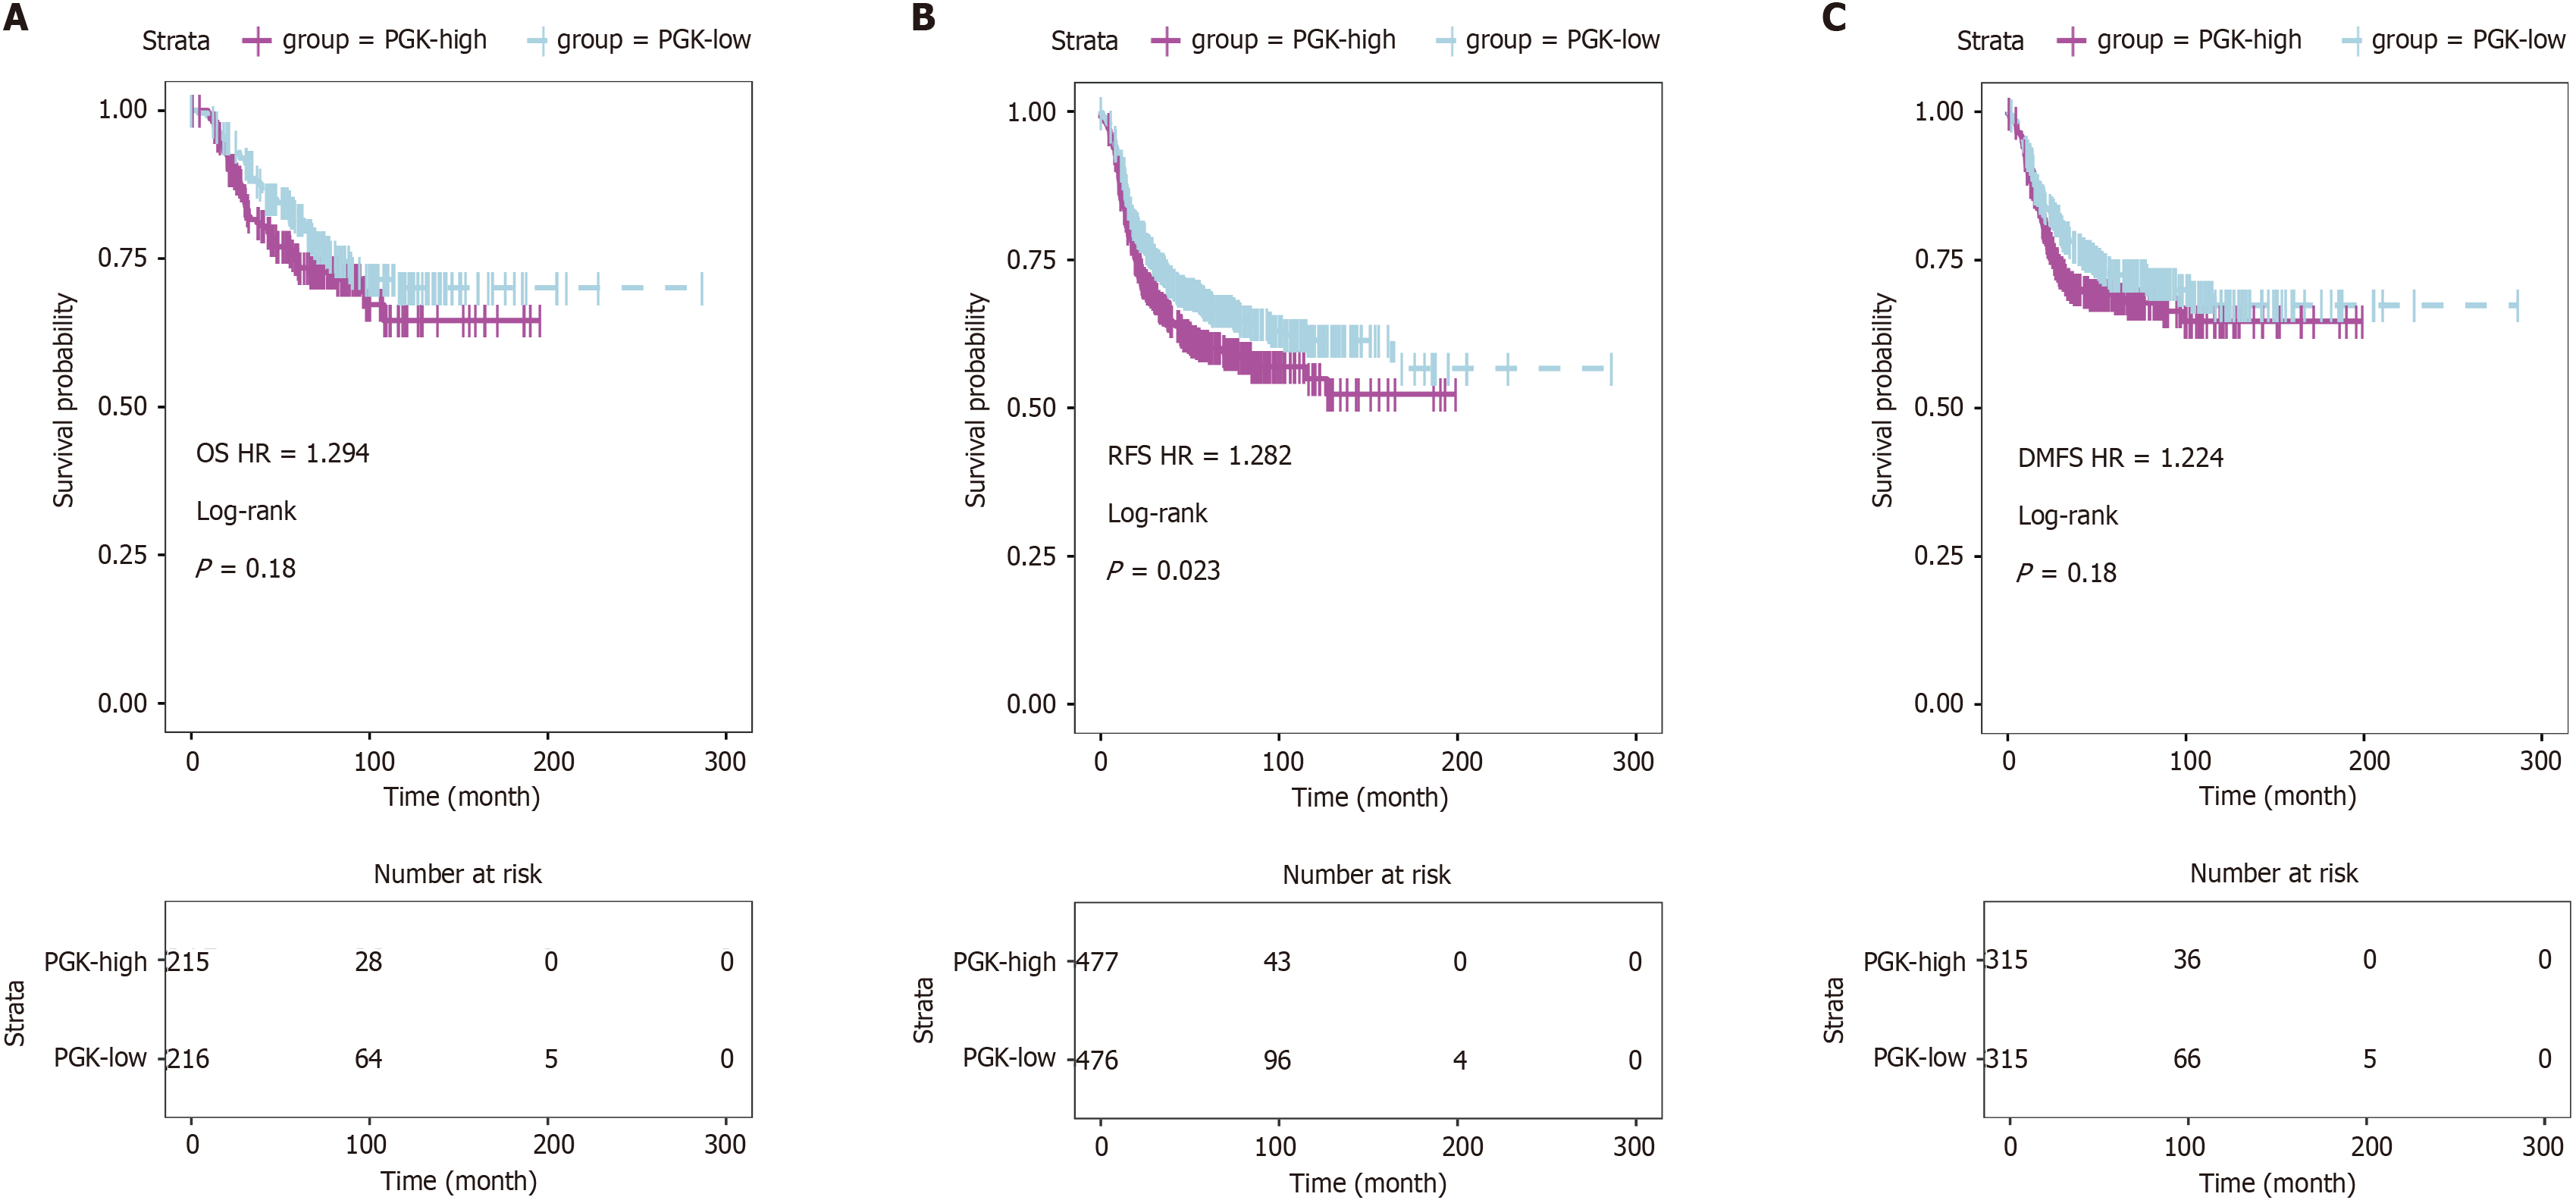
Figure 17 Kaplan-Meier curves for association between phosphoglycerate kinase 1 expression of triple-negative breast cancer patients.
A: Overall survival; B: Recurrence-free survival; C: Distant metastasis free survival. OS: Overall survival; RFS: Recurrence-free survival; DMFS: Distant metastasis free survival; HR: Hazard ratio.
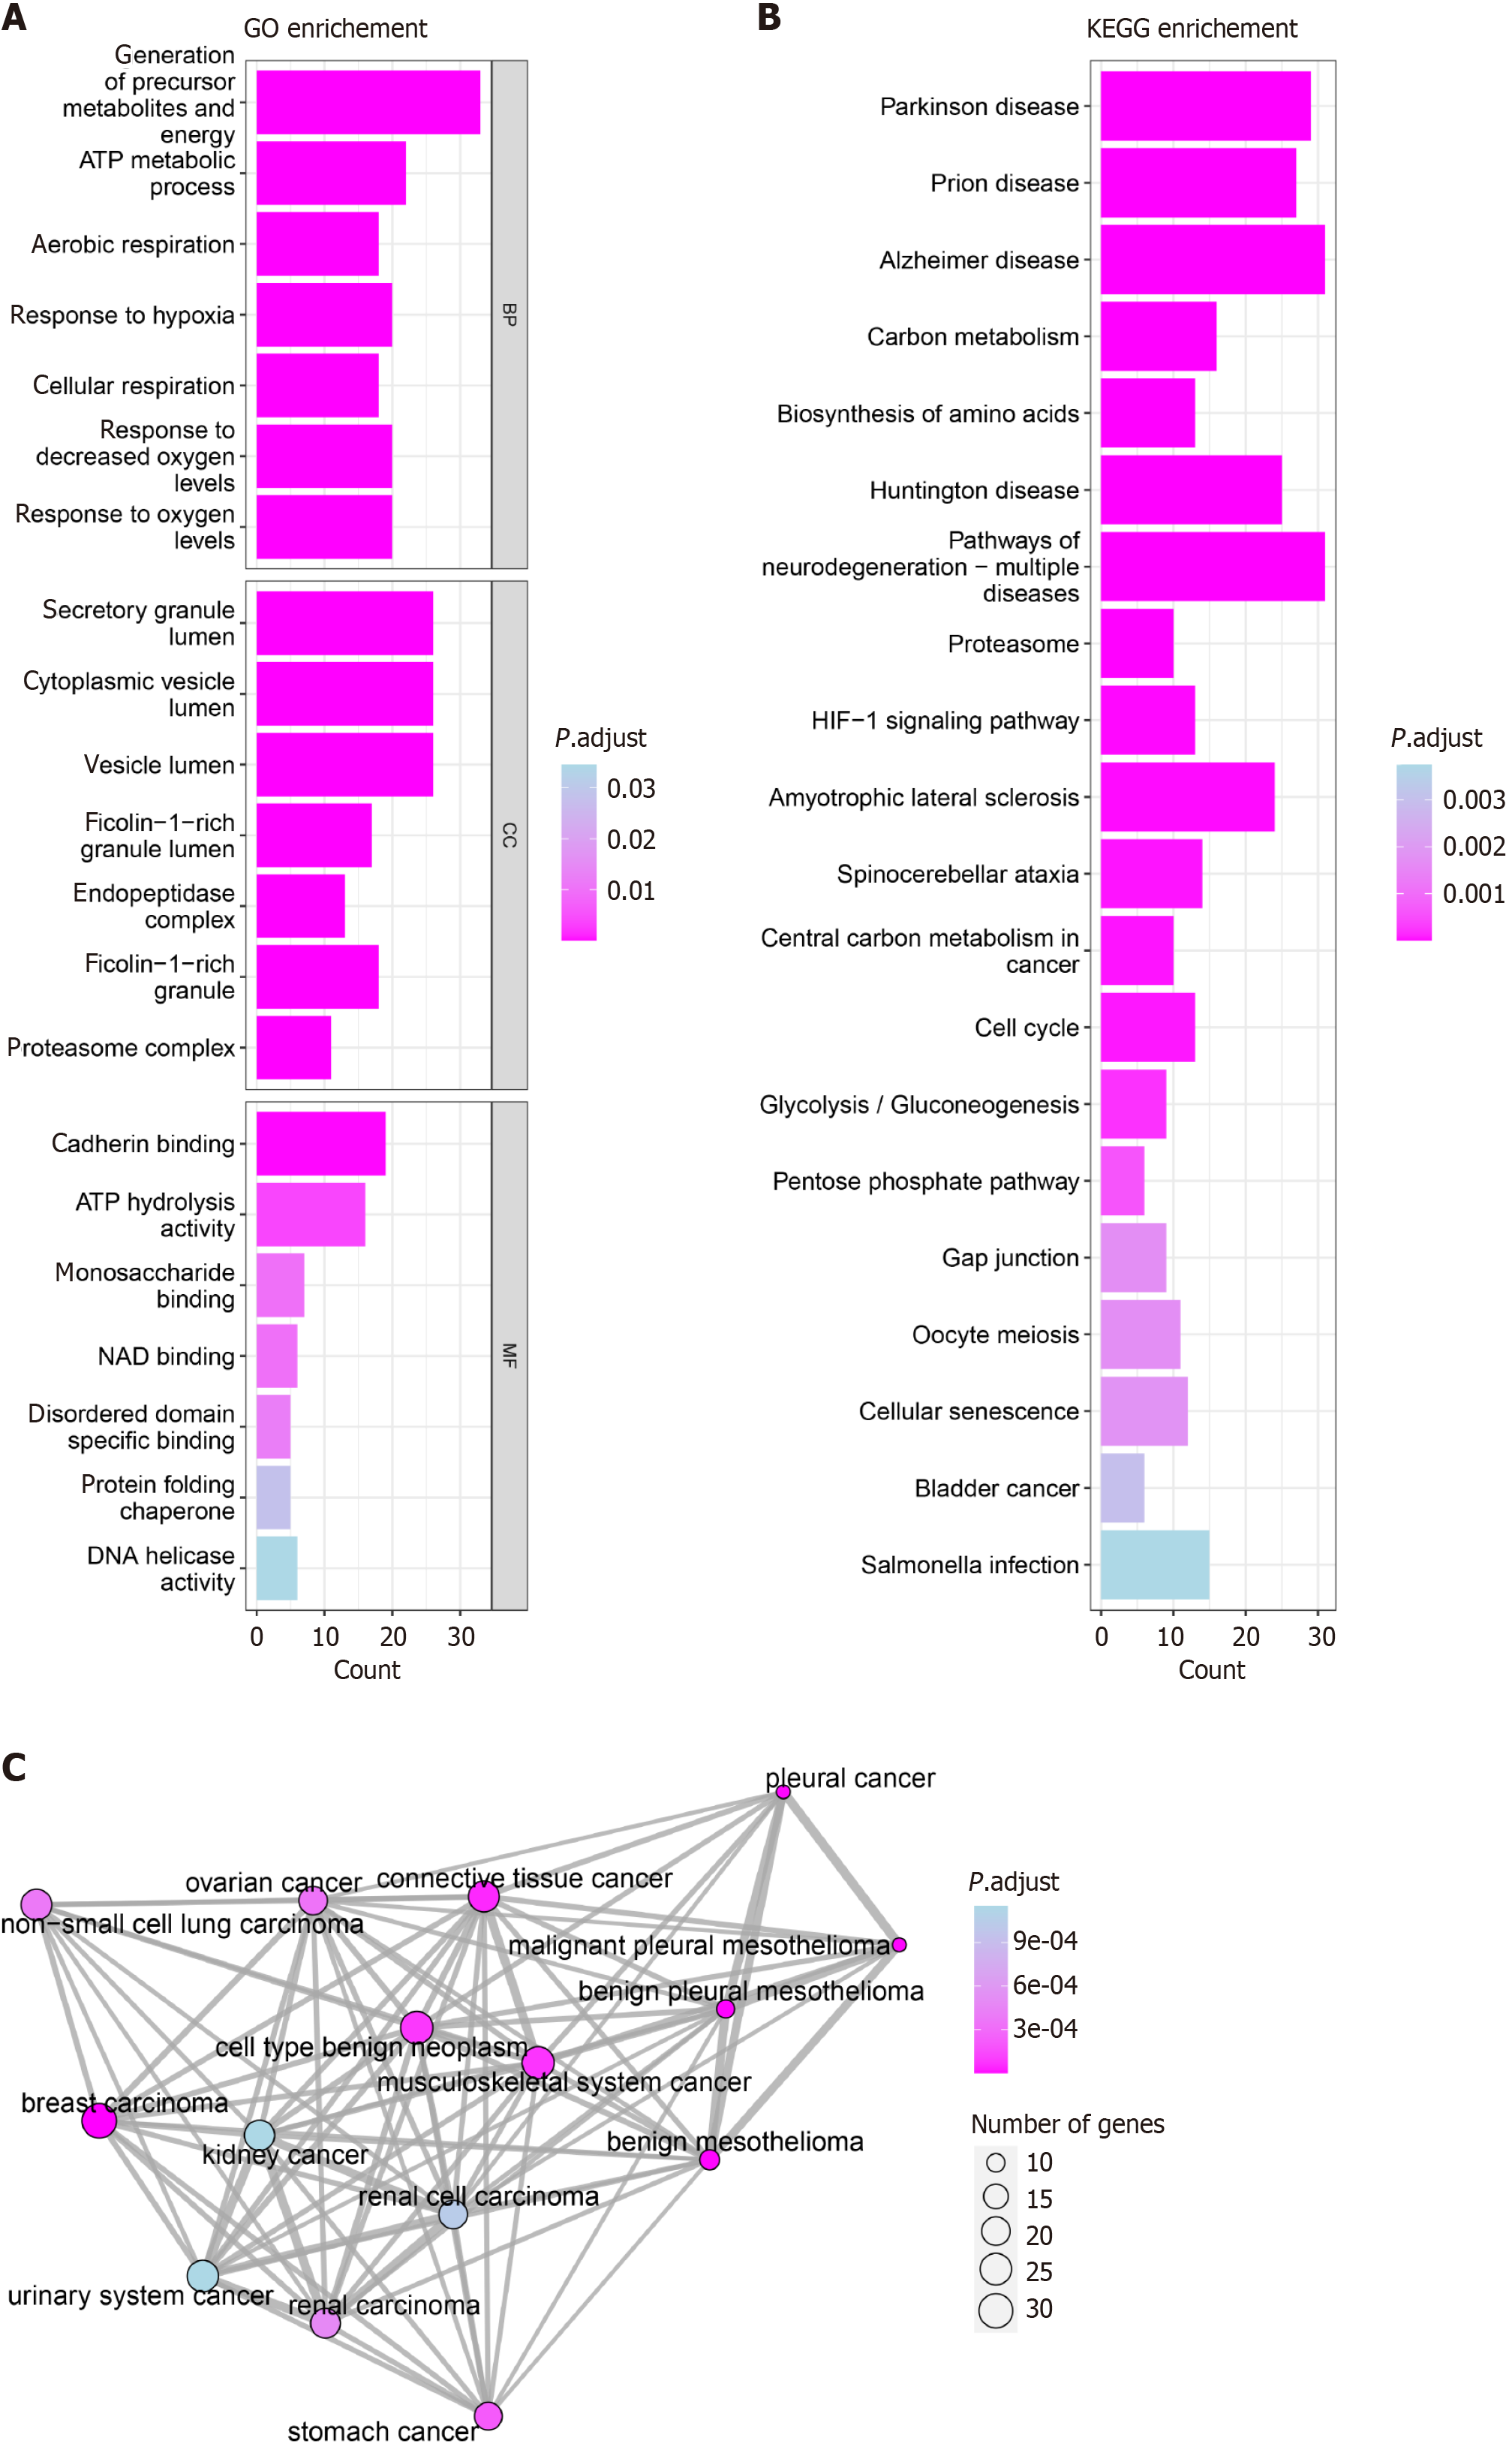
Figure 18 Pathway and disease enrichment analysis annotation.
A: Gene Ontology enrichment; B: Kyoto Encyclopedia of Genes and Genomes enrichment. Columnar length represents the number of gene enrichments; the longer the column, the more gene enrichment. Color indicates the size of the P value; the darker the color, the smaller the P value; C: Disease Ontology enrichment. The area of each circle represents the number of genes; the larger the circle, the more genes are involved. The color of each circle represents the P value; the darker the color, the smaller the P value. GO: Gene Ontology enrichment; KEGG: Kyoto Encyclopedia of Genes and Genomes.
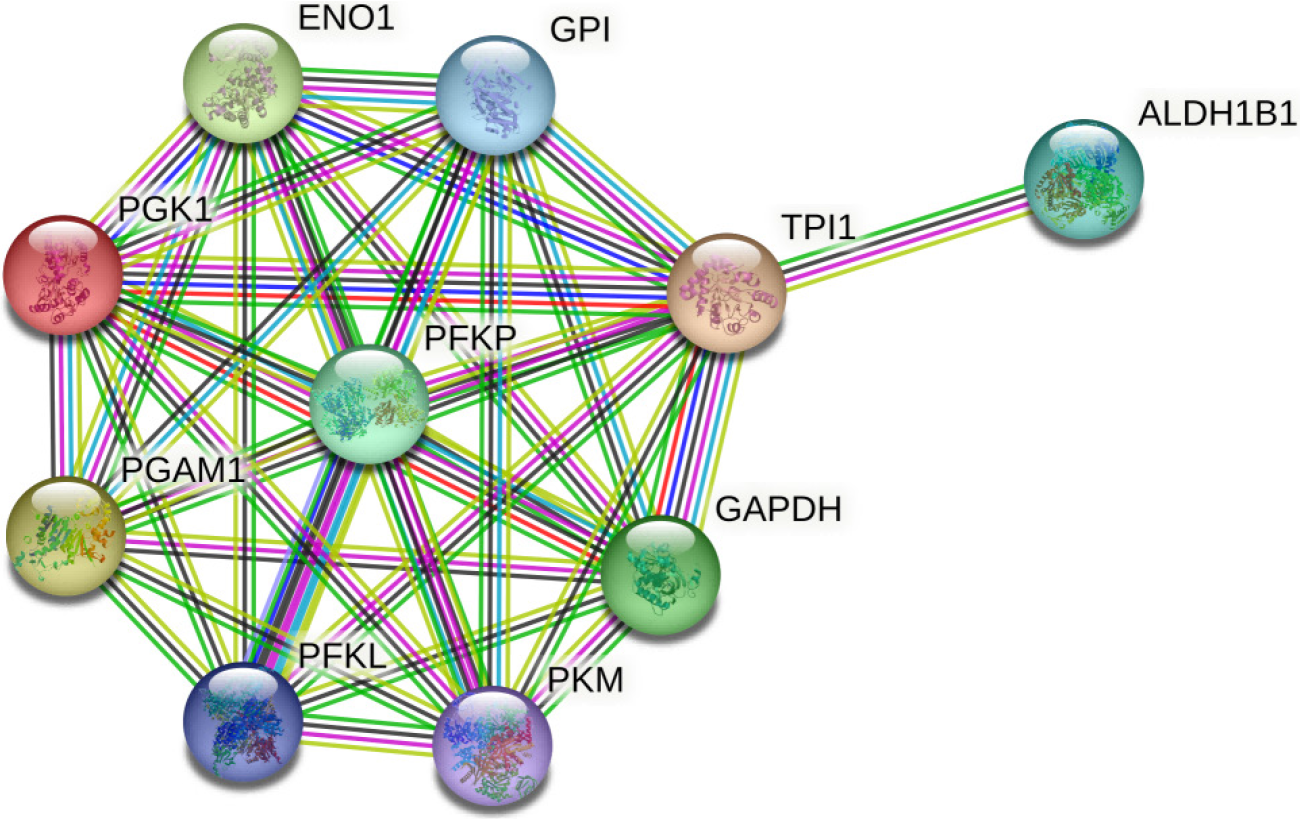
Figure 19
Protein-protein interaction network analysis of phosphoglycerate kinase 1 related genes.
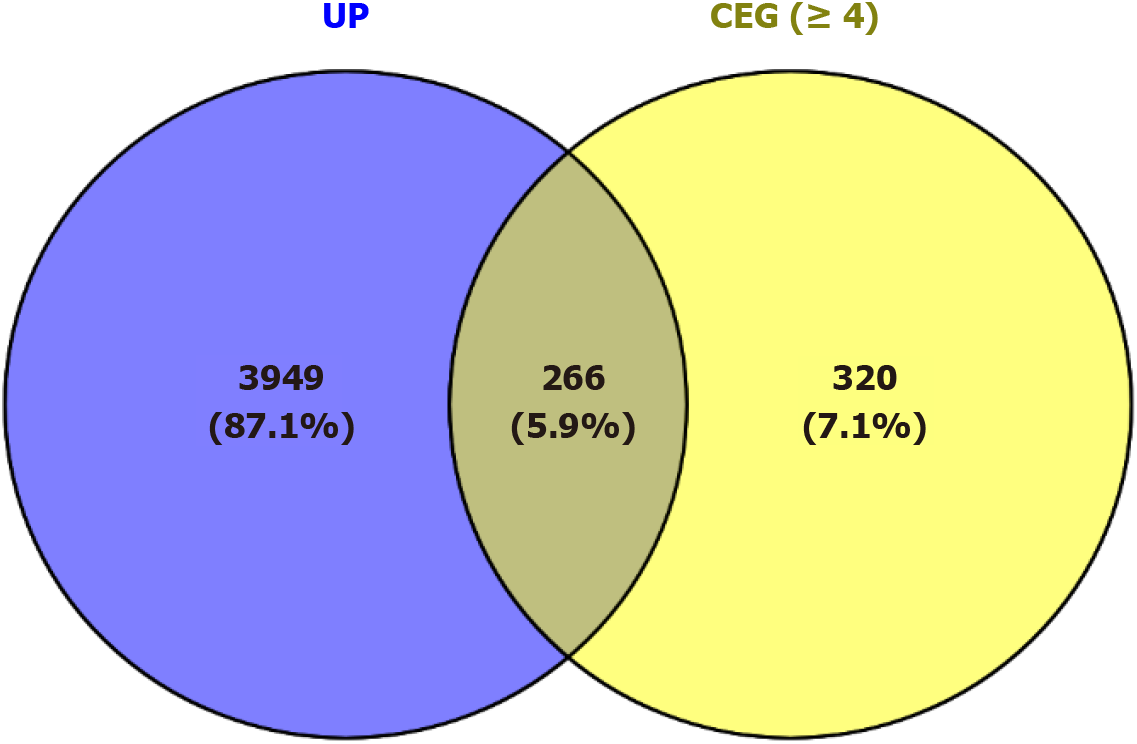
Figure 20
Intersection of triple-negative breast cancer vs non-triple-negative breast cancer gene overexpression and positively phosphoglycerate kinase 1 correlated gene co-expression in triple-negative breast cancer (occurrence ≥ 4).
UP: Upregulated gene; CEG: Co-expressed gene.
- Citation: Chen JY, Li JD, He RQ, Huang ZG, Chen G, Zou W. Bibliometric analysis of phosphoglycerate kinase 1 expression in breast cancer and its distinct upregulation in triple-negative breast cancer. World J Clin Oncol 2024; 15(7): 867-894
- URL: https://www.wjgnet.com/2218-4333/full/v15/i7/867.htm
- DOI: https://dx.doi.org/10.5306/wjco.v15.i7.867


