Copyright
©The Author(s) 2024.
World J Clin Oncol. Feb 24, 2024; 15(2): 302-316
Published online Feb 24, 2024. doi: 10.5306/wjco.v15.i2.302
Published online Feb 24, 2024. doi: 10.5306/wjco.v15.i2.302
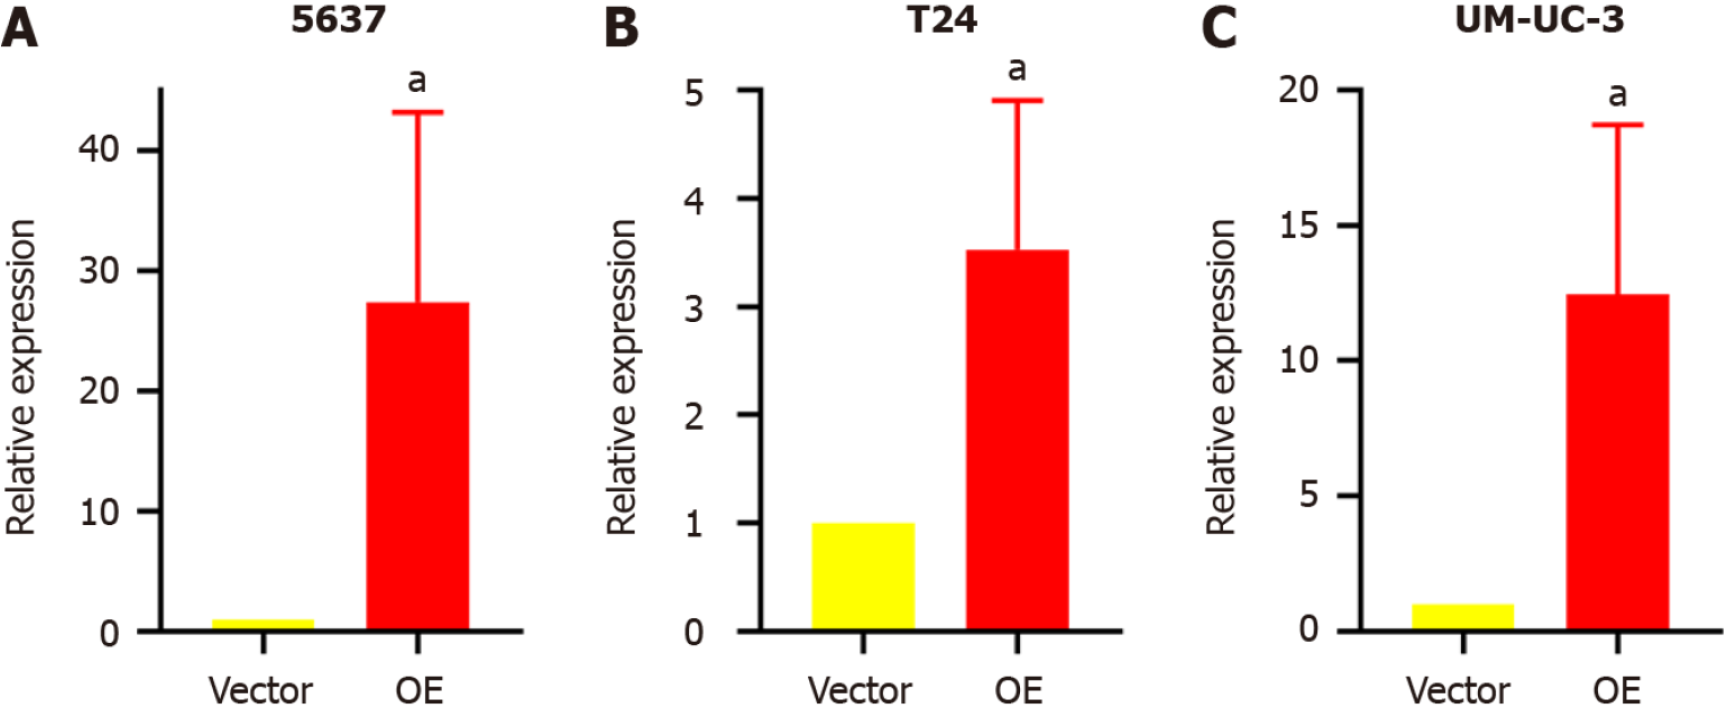
Figure 1 Relative expression of TM9SF1 in bladder cancer cells transfected with TM9SF1-overexpressing lentiviral vector and empty vector.
A-C: Relative expression of TM9SF1 in 5637 (A), T24 (B), and UM-UC-3 (C) bladder cancer cells transfected with TM9SF1-overexpressing lentiviral vector and empty vector. aP < 0.05. OE: TM9SF1-overexpressing lentiviral vector.
Figure 2 Effect of overexpression of TM9SF1 on proliferation of bladder cancer cells.
A-C: Promoting effect of overexpression of TM9SF1 on proliferation of 5637 (A), T24 (B), and UM-UC-3 (C) cells at 24 h, 48 h, 72 h, and 96 h by CCK8 assay. aP < 0.05, bP < 0.01, cP < 0.001. OE: TM9SF1-overexpressing lentiviral vector.
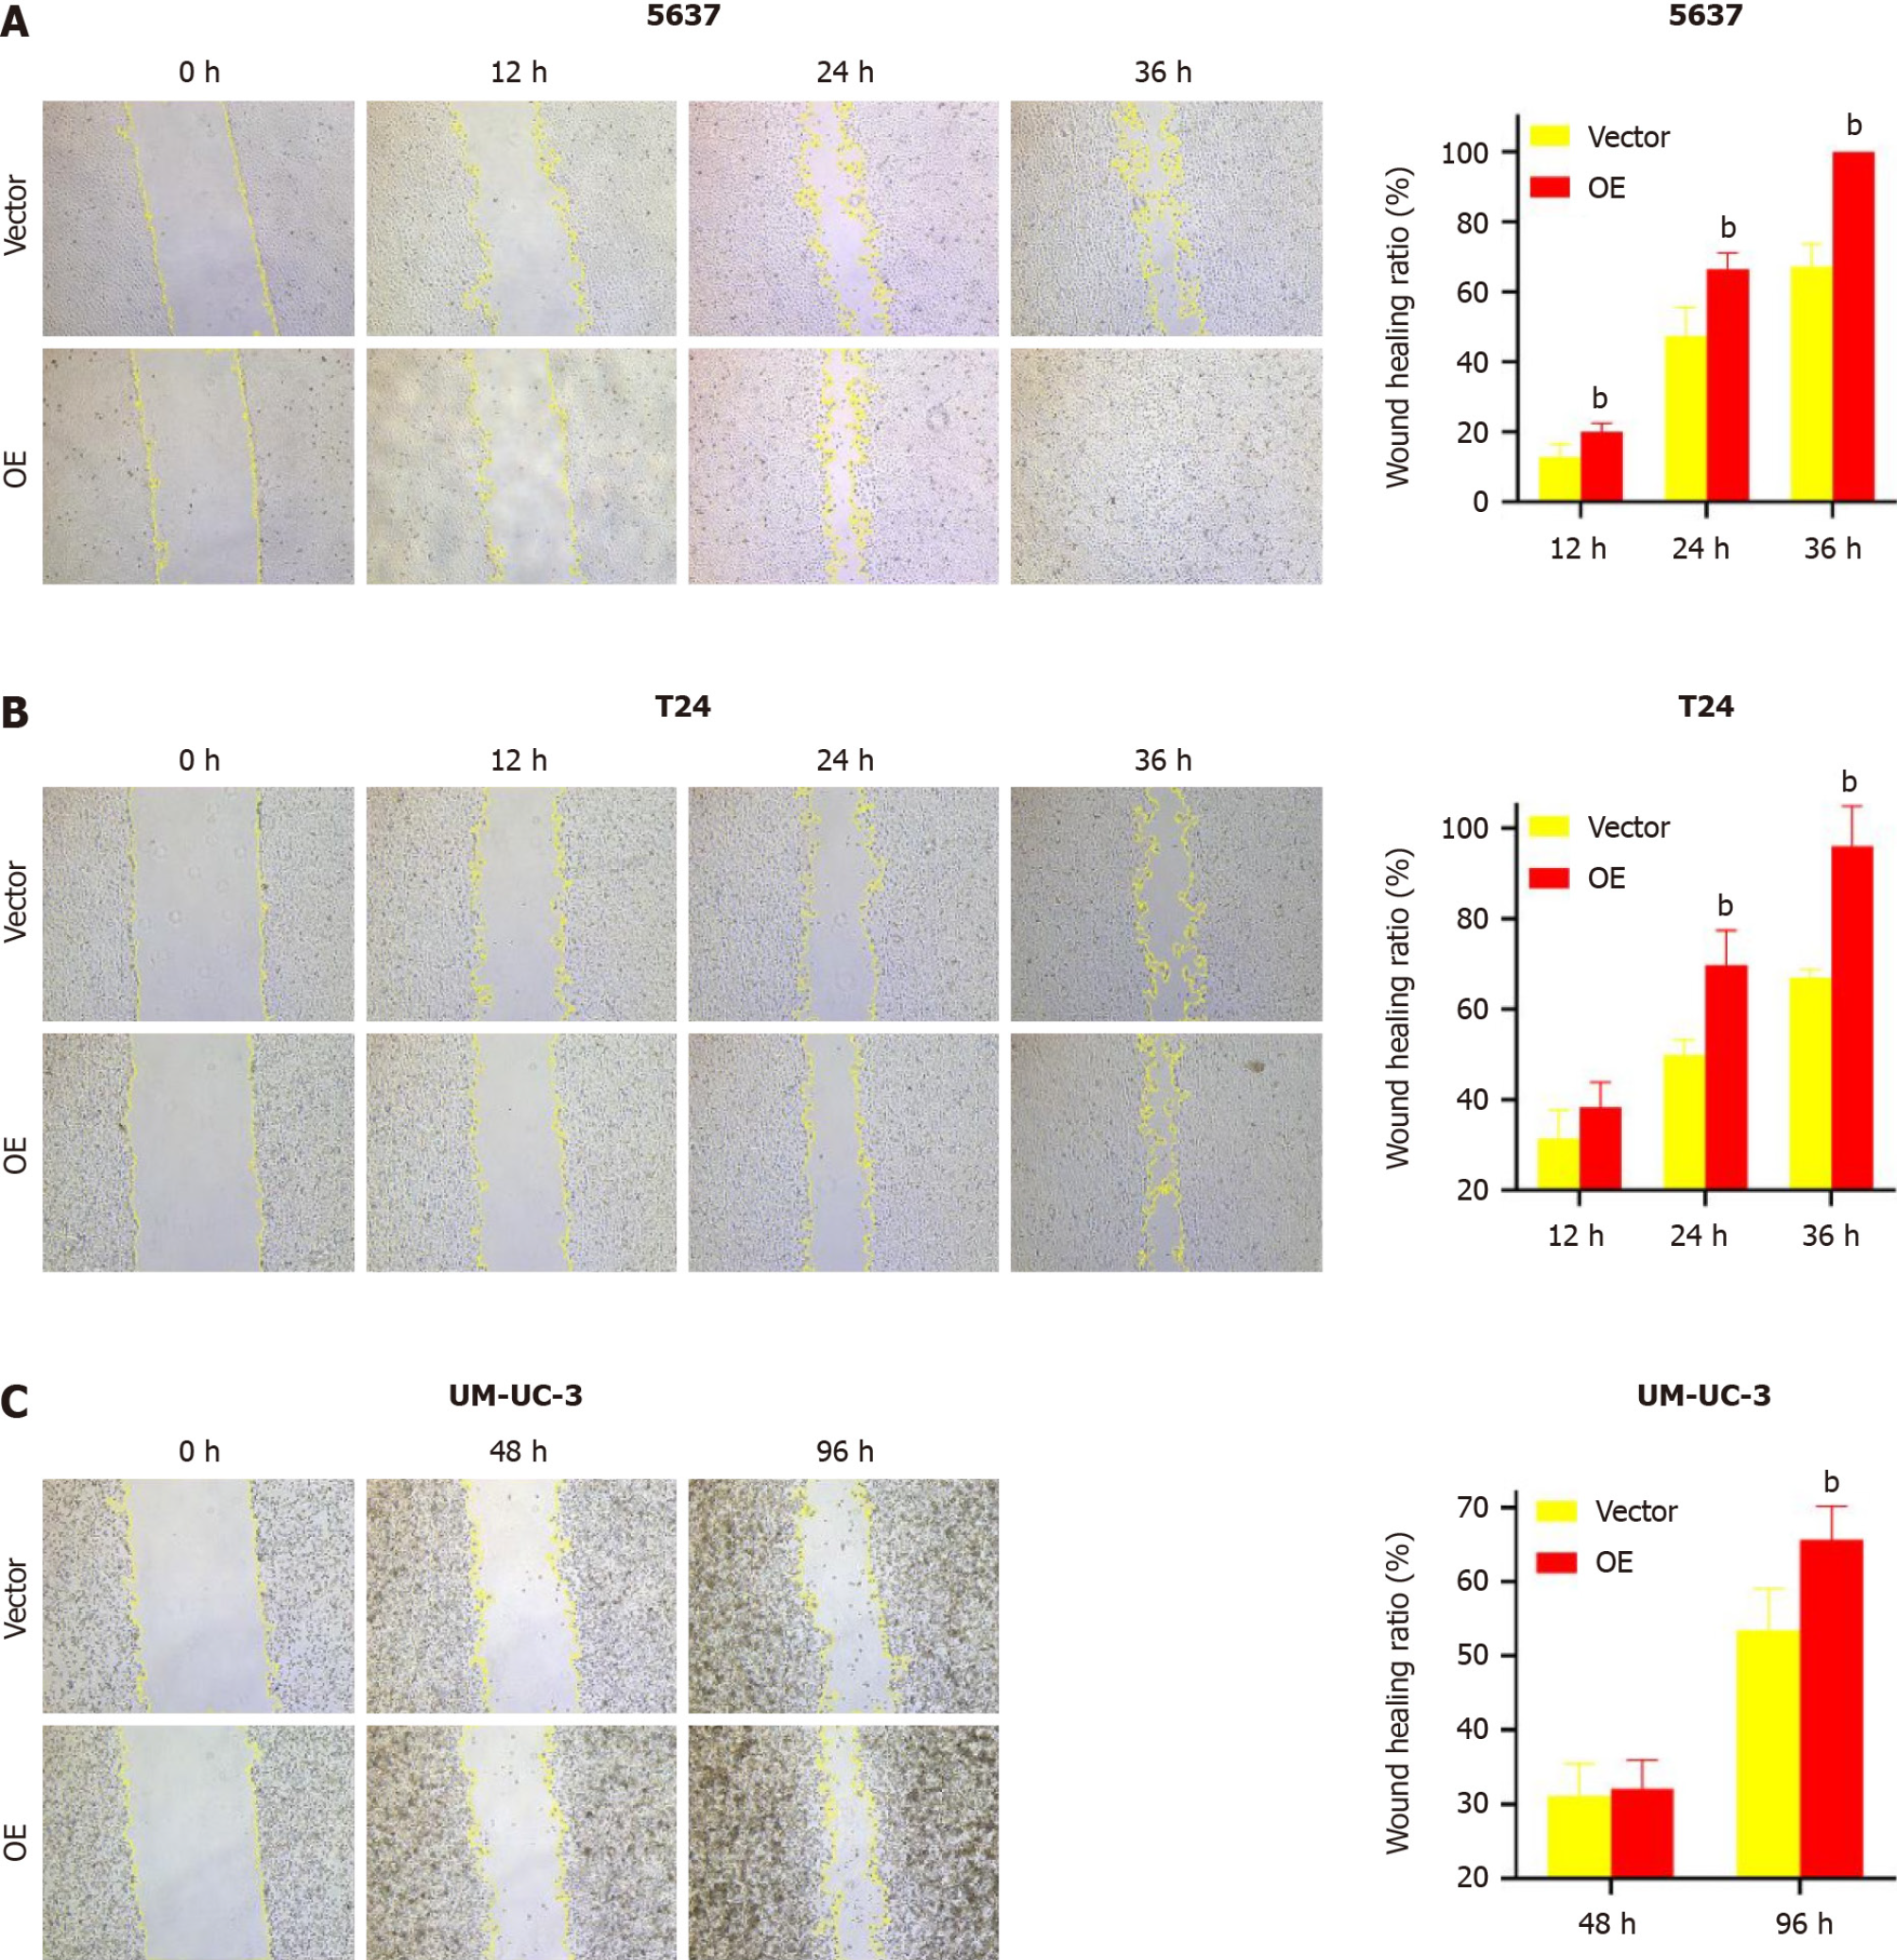
Figure 3 Effect of overexpression of TM9SF1 on migration of bladder cancer cells by scratch assay (50 ×).
A-C: Scratches under a microscope and wound-healing rate of transfected 5637 (A) and T24 (B) cells at 0 h, 12 h, 24 h, 36 h, and UM-UC-3 cells (C) at 0 h, 48 h, and 96 h by wound-healing assay. bP < 0.01. OE: TM9SF1-overexpressing lentiviral vector.
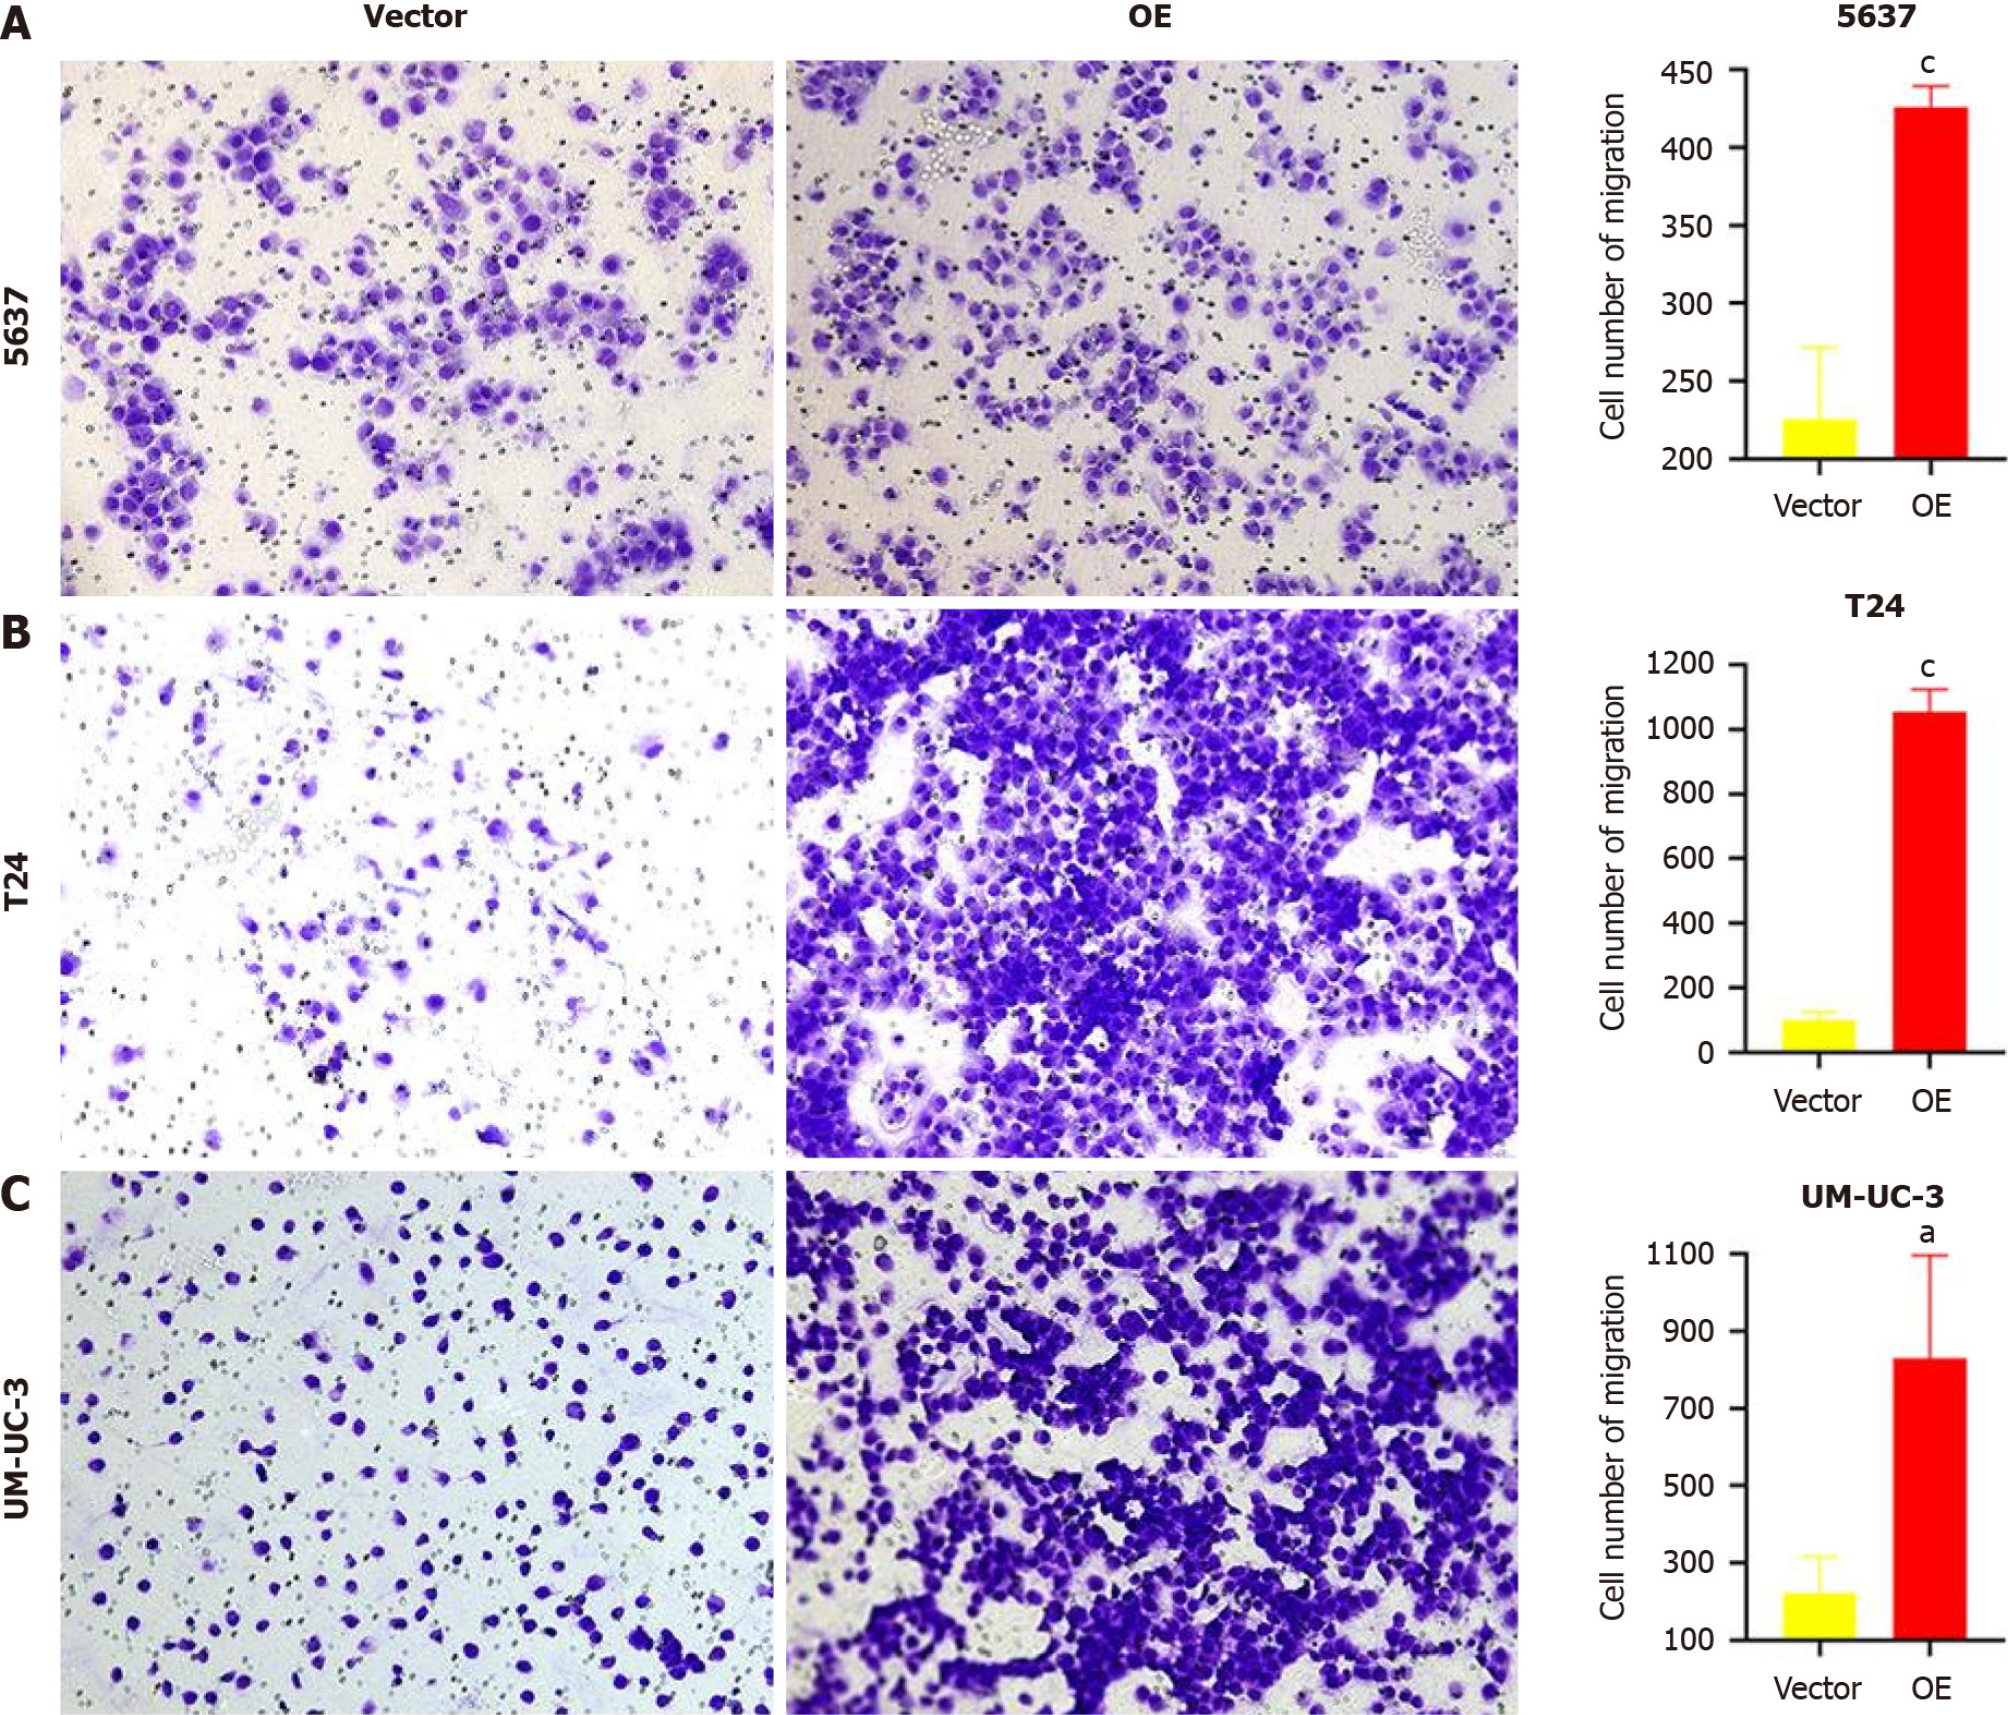
Figure 4 Effect of overexpression of TM9SF1 on cell migration by transwell cell migration assay (100 ×).
A-C: After 24 h for cell culture, the number of migrating 5637 (A), T24 (B), and UM-UC-3 (C) cells in the TM9SF1 overexpression groups was more than that of the empty vector groups. aP < 0.05, cP < 0.001. OE: TM9SF1-overexpressing lentiviral vector.
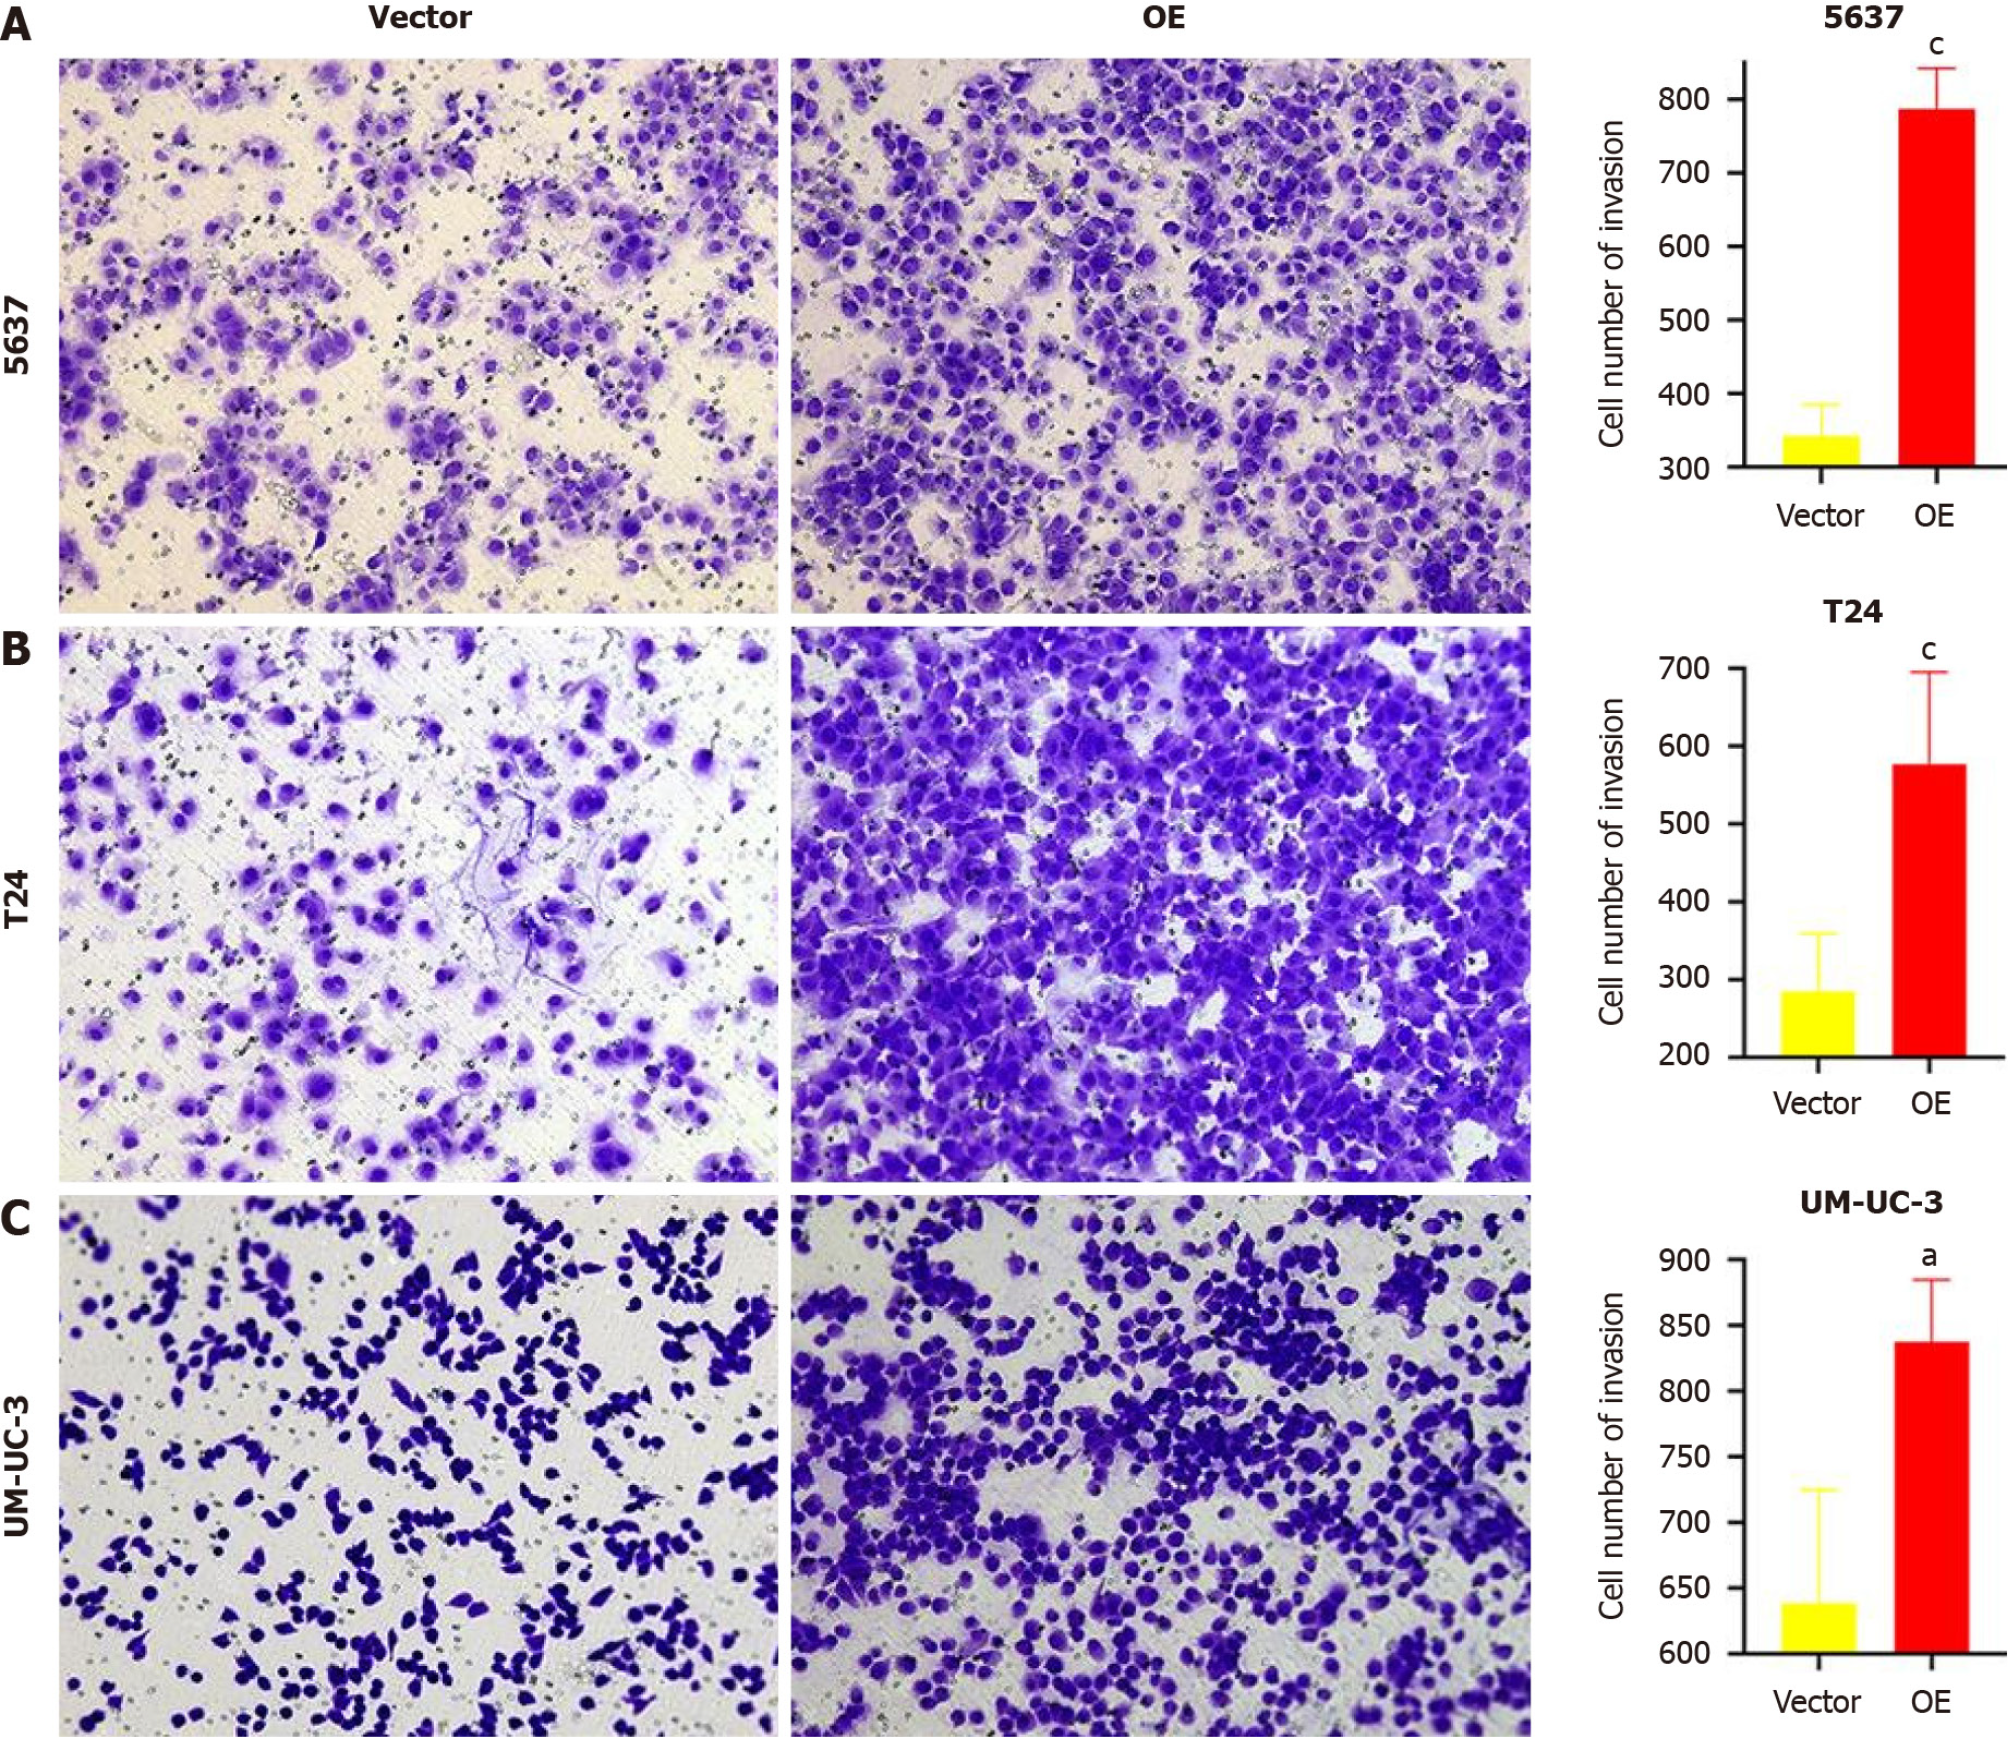
Figure 5 Effect of overexpression of TM9SF1 on invasion of bladder cancer cells by transwell invasion assay (100 ×).
A-C: After 24 h for cell culture, the number of invasive 5637 (A), T24 (B), and UM-UC-3 (C) cells in the overexpression groups was significantly more than that of the empty vector groups. aP < 0.05, cP < 0.001. OE: TM9SF1-overexpressing lentiviral vector.
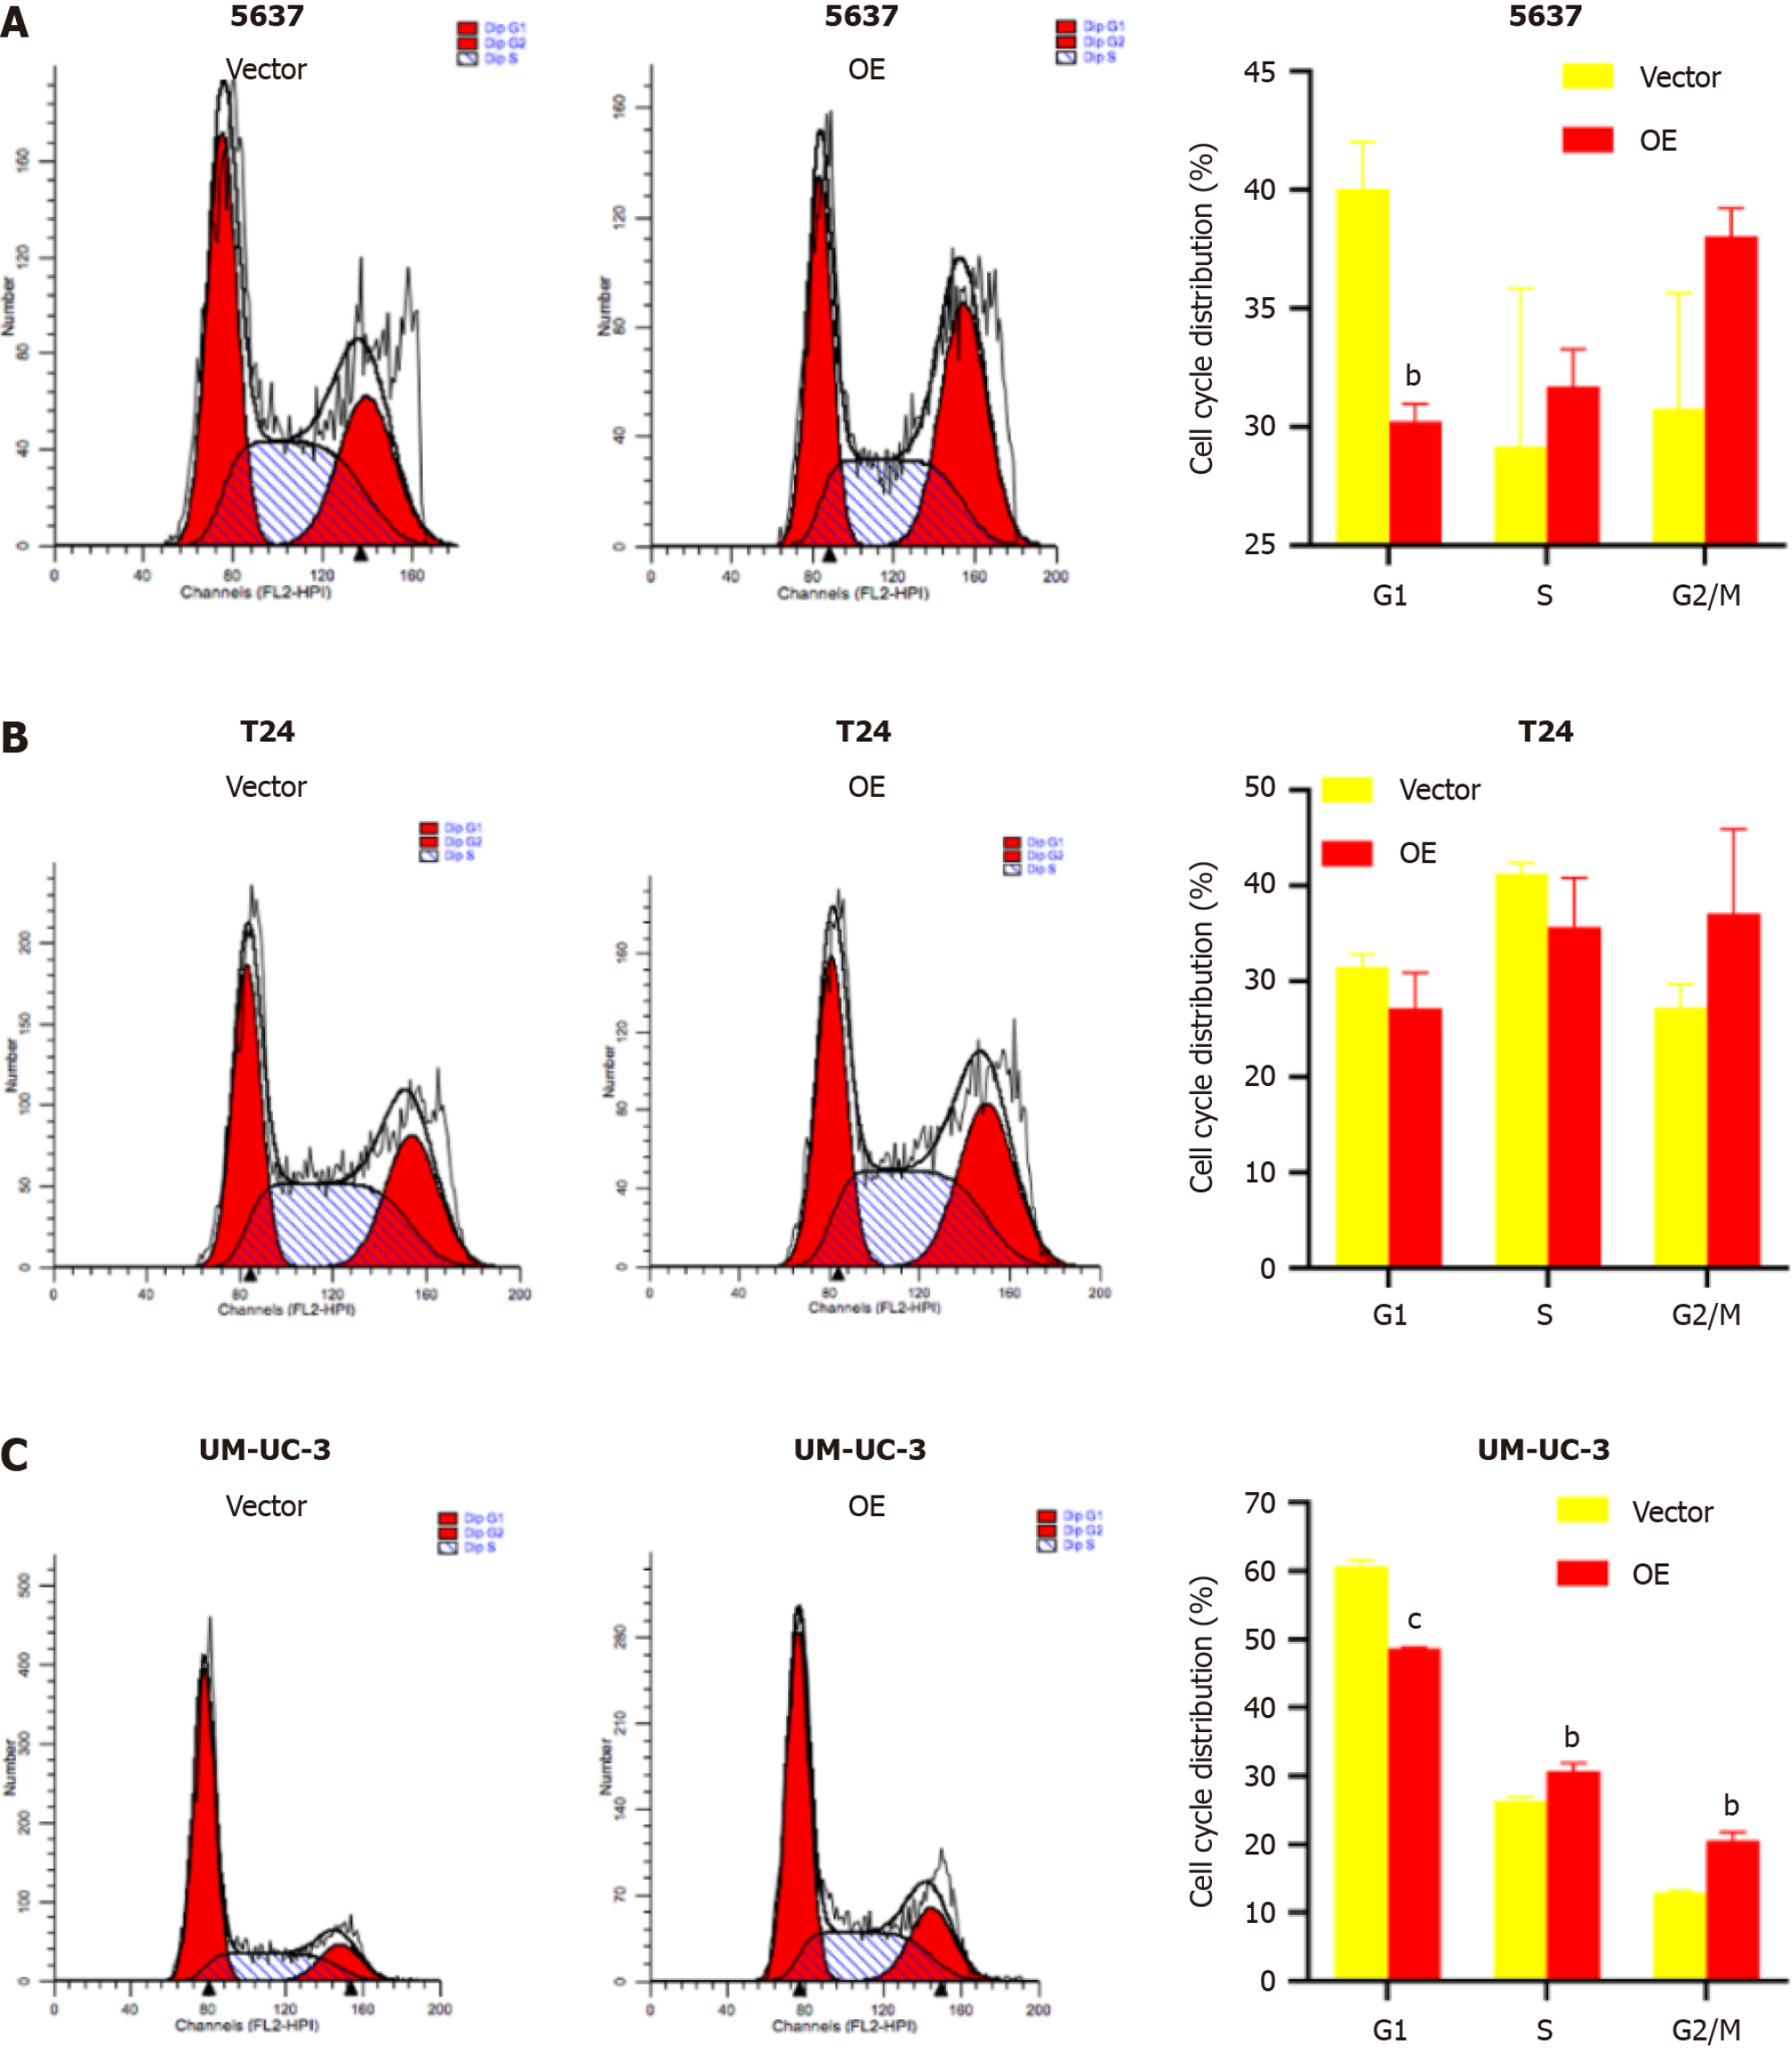
Figure 6 Effect of overexpression of TM9SF1 on bladder cancer cell cycle progression.
A-C: Cell cycle results in (A) 5637, (B) T24, and (C) UM-UC-3 cells. bP < 0.01, cP < 0.001. OE: TM9SF1-overexpressing lentiviral vector.
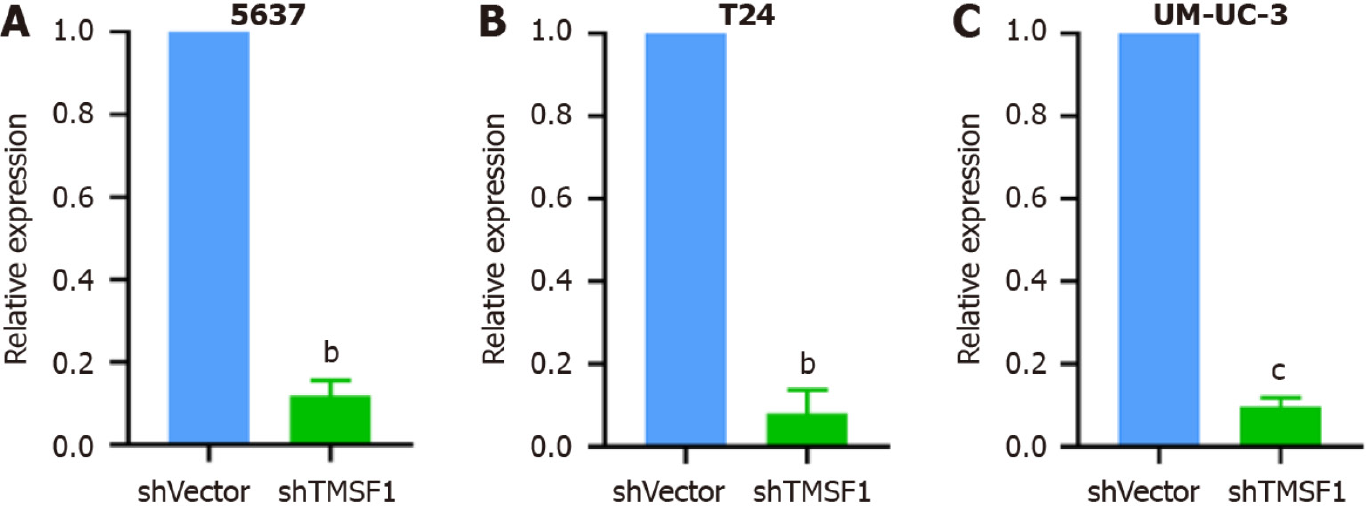
Figure 7 Relative expression of TM9SF1 in bladder cancer cells transfected with TM9SF1-silencing lentiviral vector and empty vector.
A-C: Relative expression of TM9SF1 in 5637 (A), T24 (B), and UM-UC-3 (C) bladder cancer cells transfected with TM9SF1-silencing lentiviral vector and empty vector. aP < 0.05, bP < 0.01, cP < 0.001. shVector: Short hairpin vector; shTM9SF1: Short hairpin TM9SF1.
Figure 8 Effect of TM9SF1 knockdown on proliferation of bladder cancer cells.
A-C: Inhibiting effect of TM9SF1 knockdown on proliferation of 5637 (A), T24 (B), and UM-UC-3 (C) cells at 24 h, 48 h, 72 h, and 96 h by CCK8 assay. aP < 0.05, bP < 0.01, cP < 0.001. shVector: Short hairpin vector; shTM9SF1: Short hairpin TM9SF1.
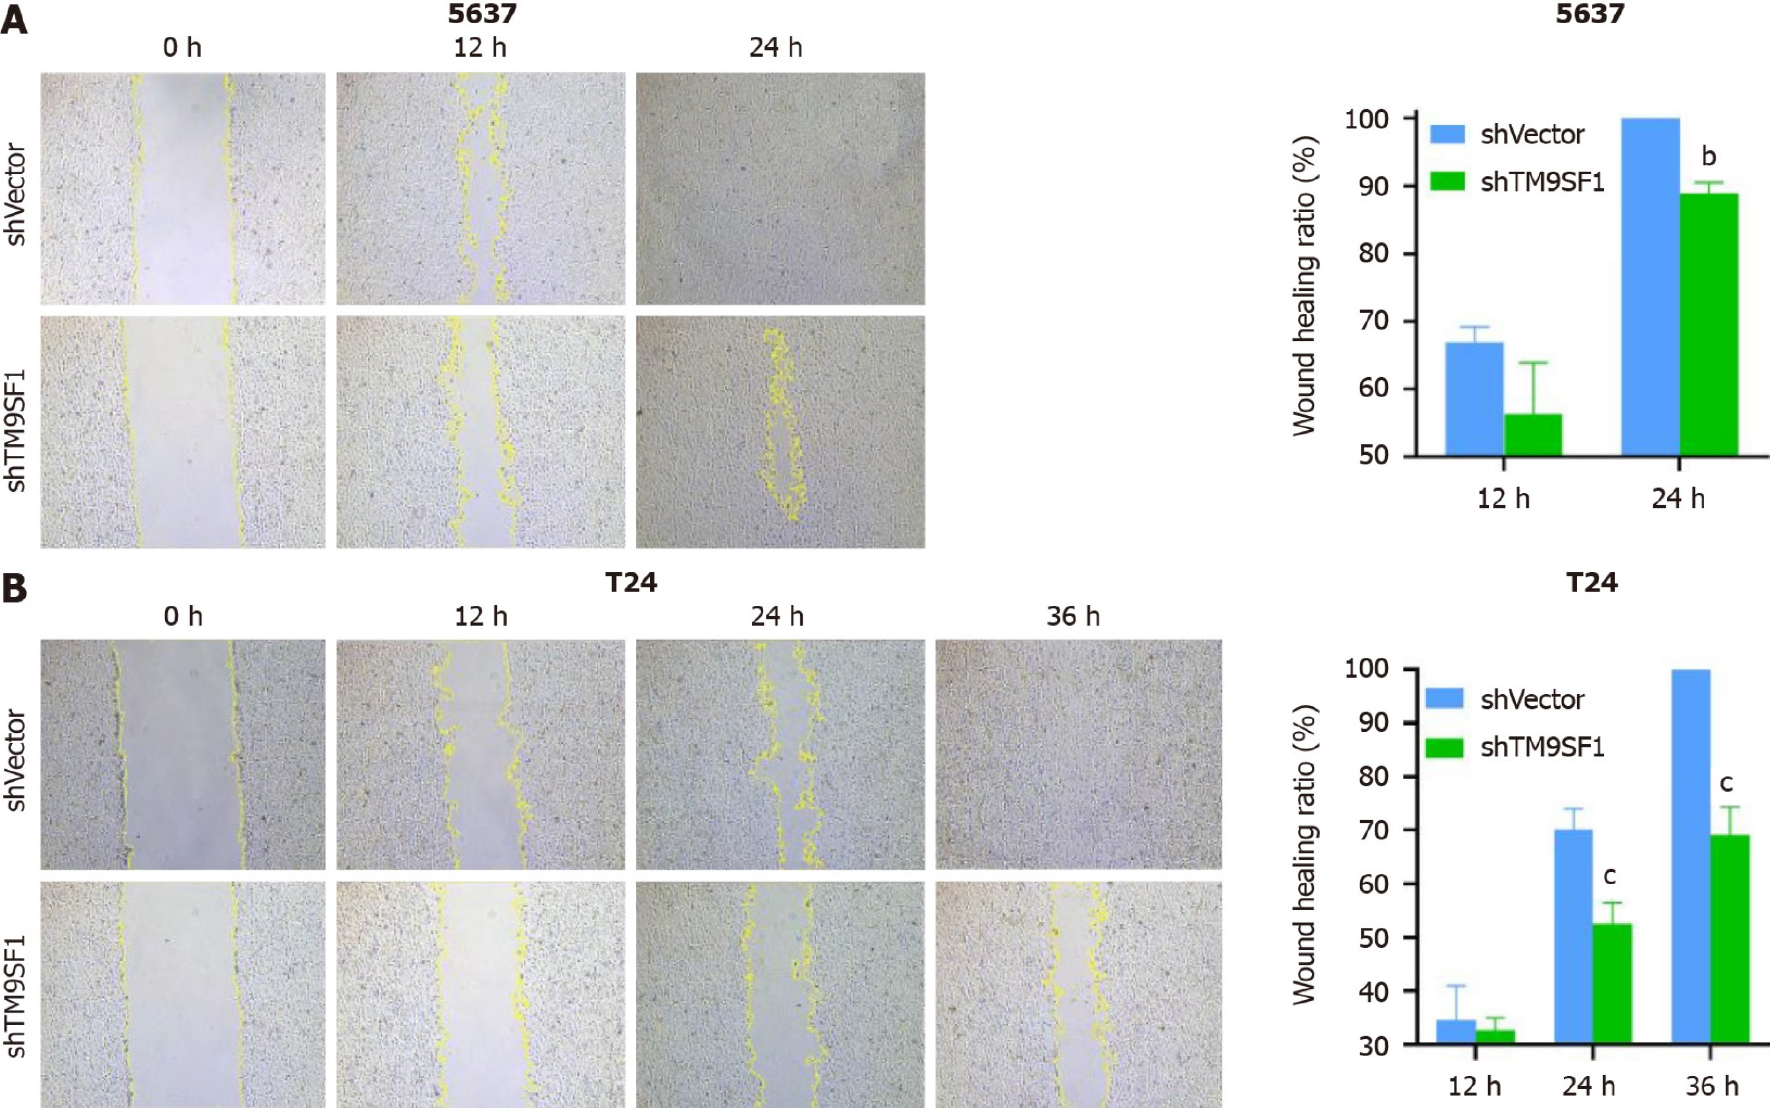
Figure 9 Effect of TM9SF1 knockdown on migration of bladder cancer cells by scratch assay (50 ×).
A-C: Scratches under a microscope and wound-healing rate of 5637 (A) and T24 (B) at 0 h, 12 h, 24 h, and 36 h by wound-healing assay. bP < 0.01, cP < 0.001. shVector: Short hairpin vector; shTM9SF1: Short hairpin TM9SF1.
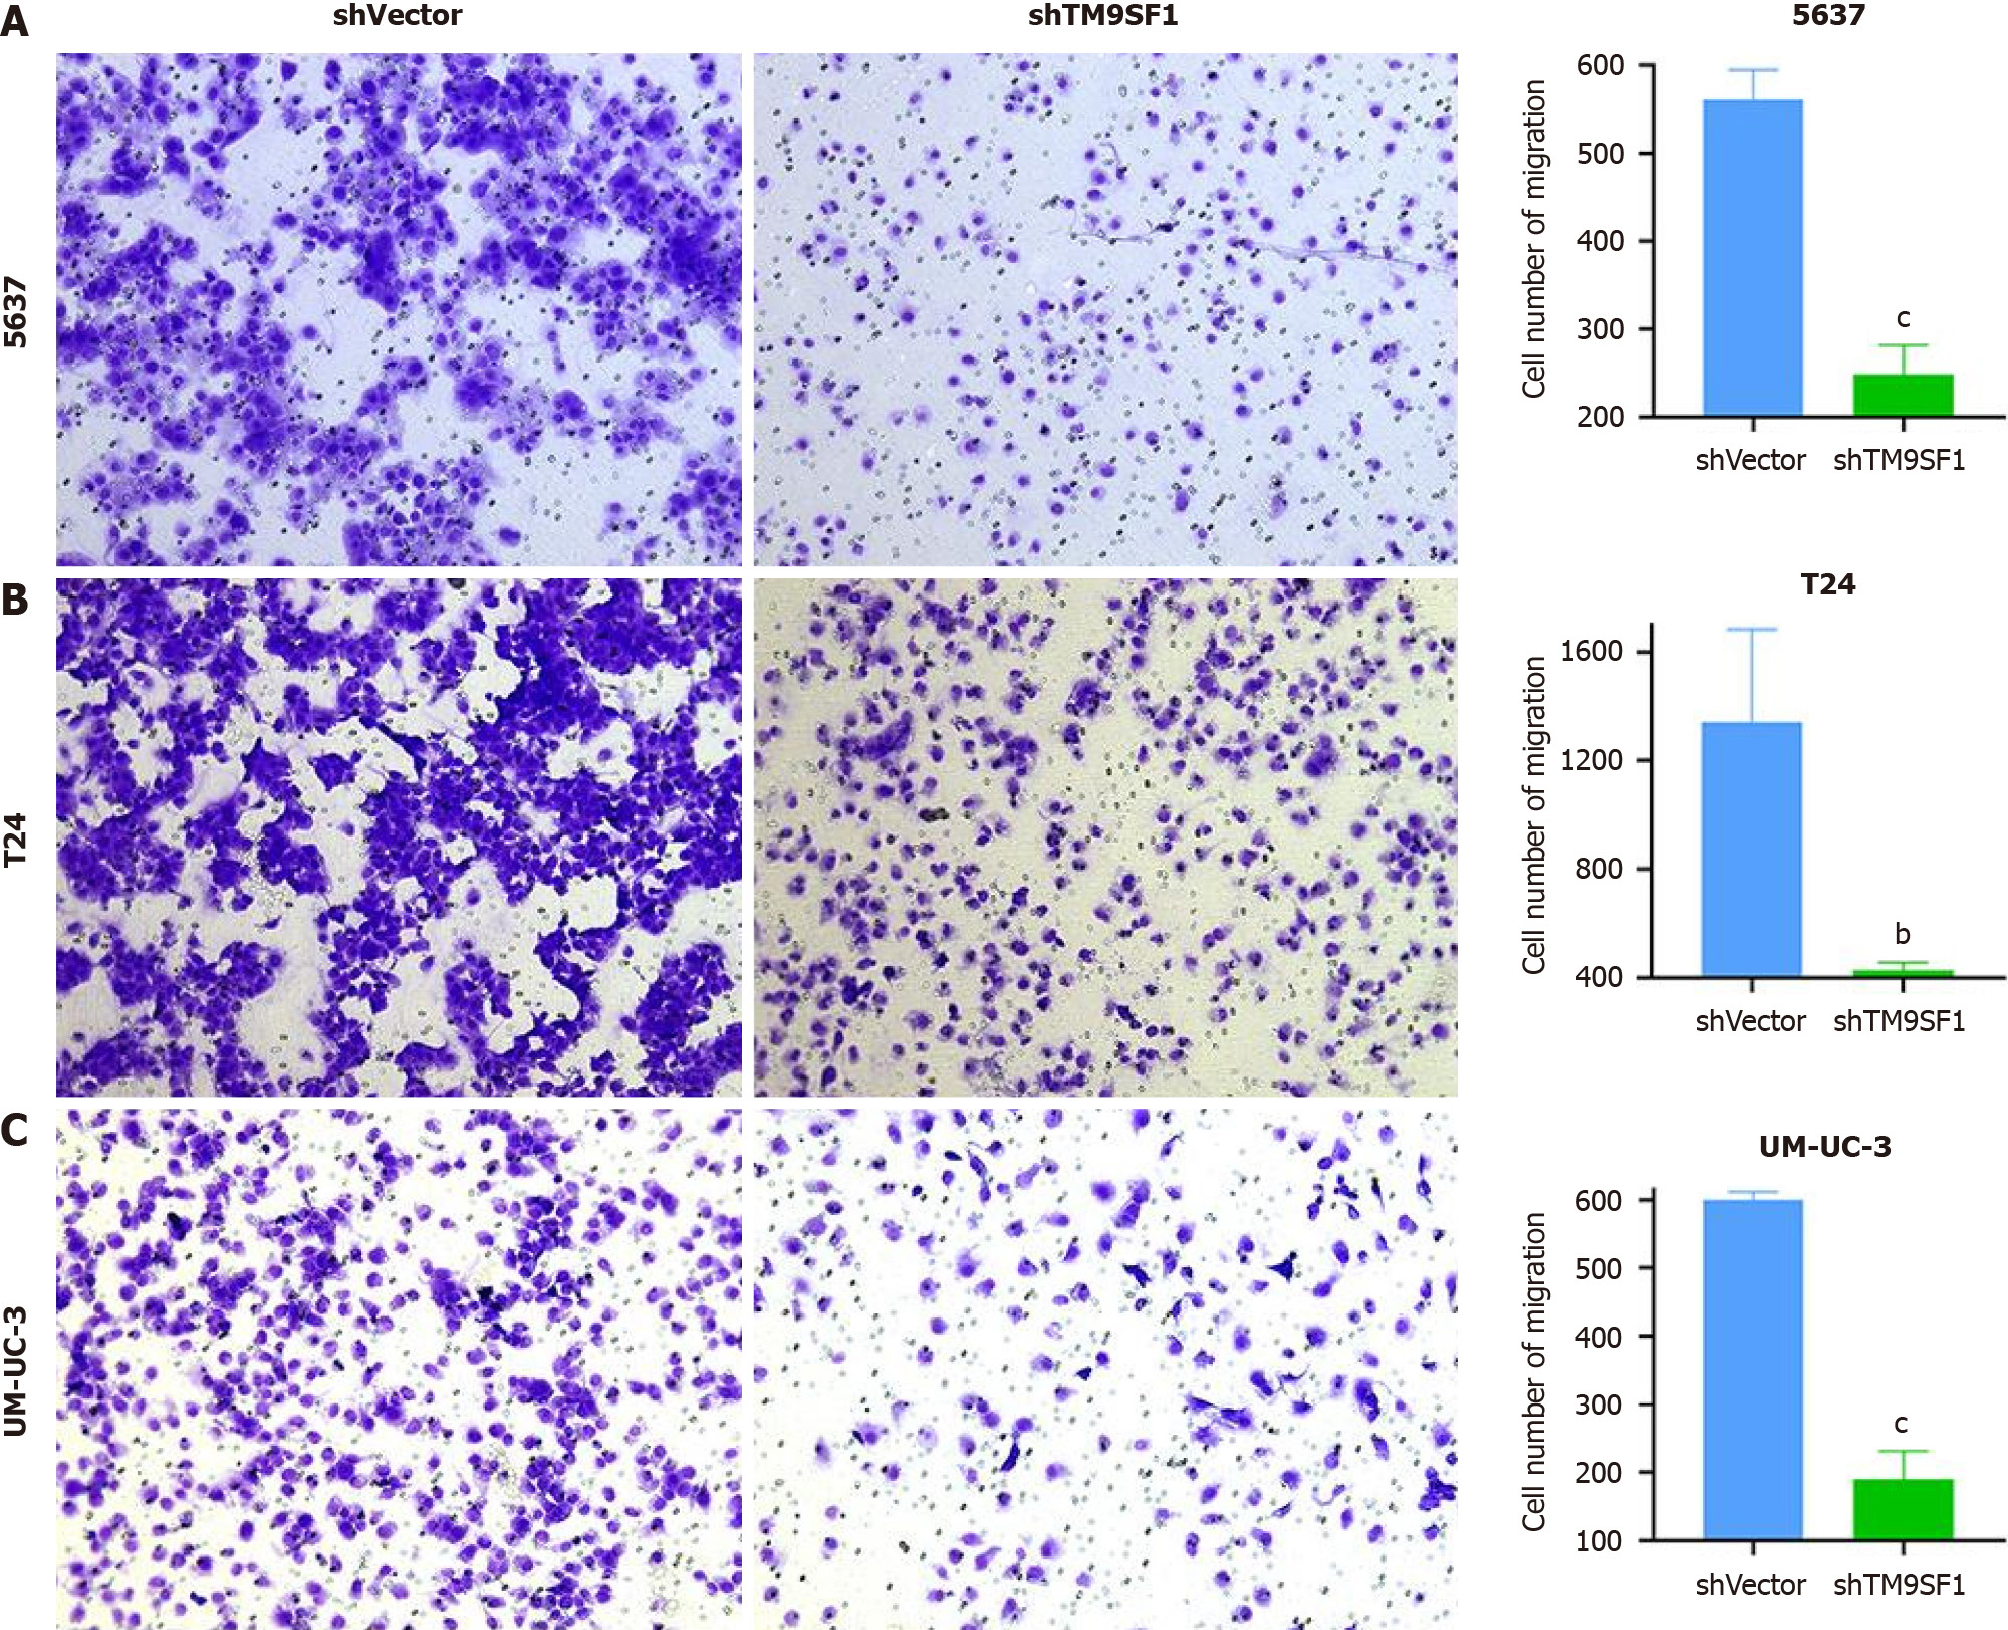
Figure 10 Effect of TM9SF1 knockdown on cell migration by transwell cell migration assay (100 ×).
A-C: After 24 h for cell culture, the number of migrating 5637 (A), T24 (B), and UM-UC-3 (C) cells in the TM9SF1 knockdown (short hairpin TM9SF1) groups was less than that of the control (short hairpin vector) groups. bP < 0.01, cP < 0.001. shVector: Short hairpin vector; shTM9SF1: Short hairpin TM9SF1.
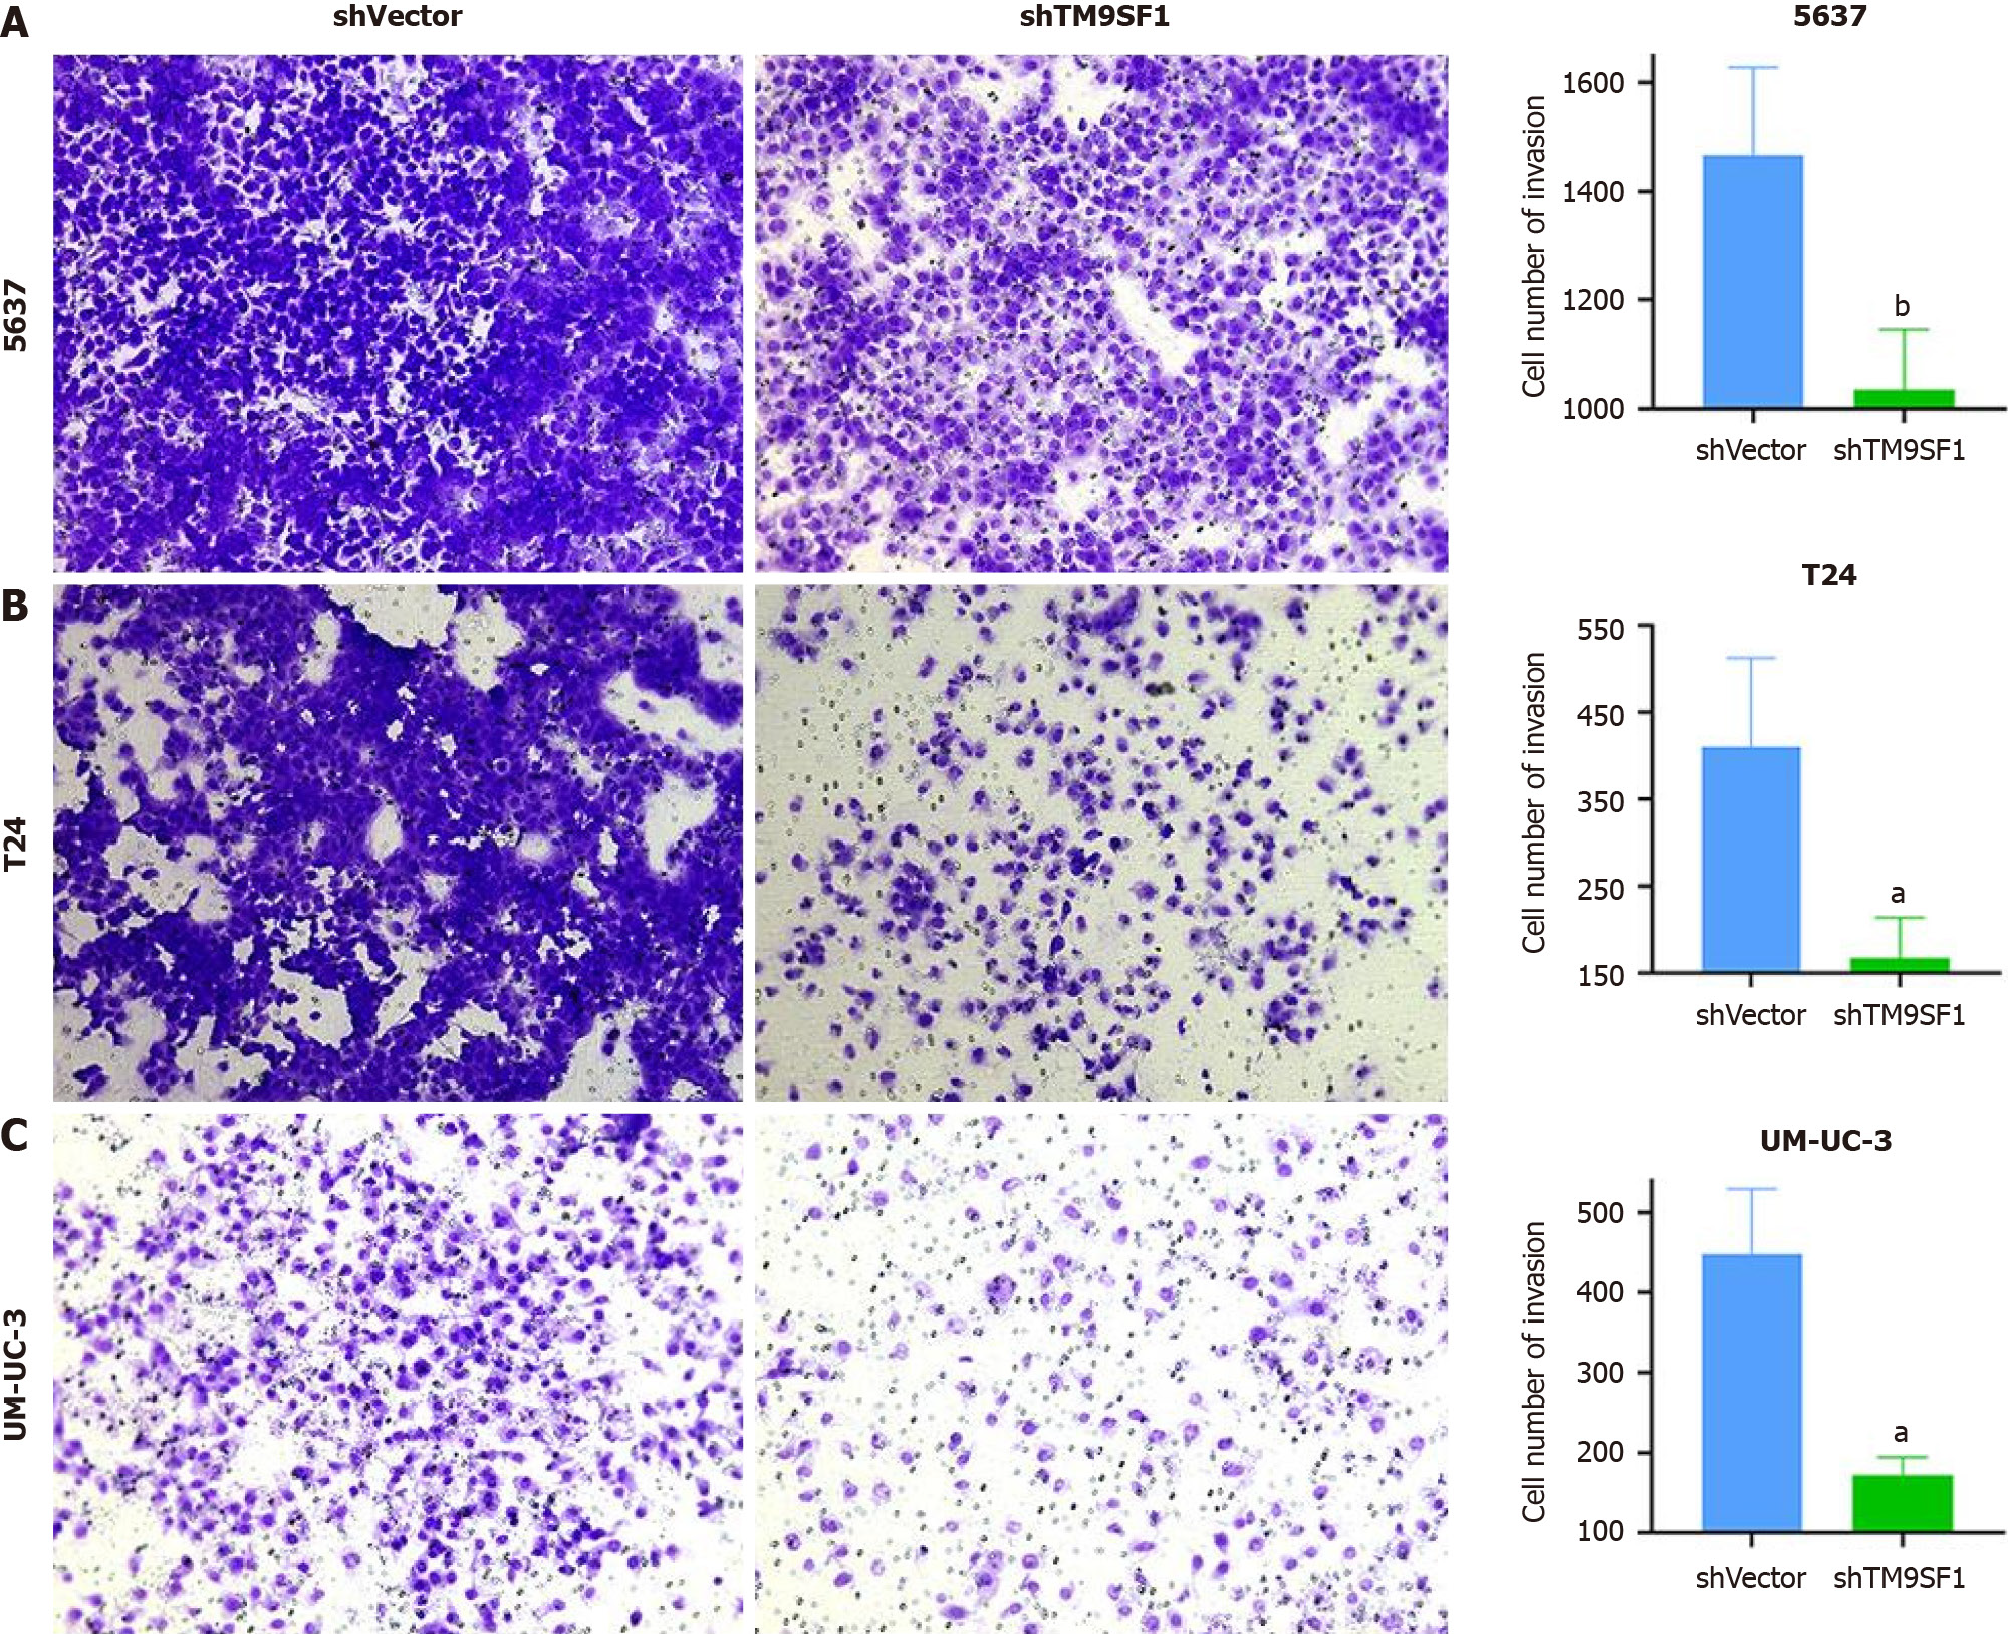
Figure 11 Effect of TM9SF1 knockdown on invasion of bladder cancer cells by transwell invasion assay (100 ×).
A-C: After 24 h for cell culture, the number of invasive 5637 (A), T24 (B), and UM-UC-3 (C) cells in the TM9SF1 knockdown (short hairpin TM9SF1) groups was significantly lower than that of the control (short hairpin vector) groups. aP < 0.05, bP < 0.01. shVector: Short hairpin vector; shTM9SF1: Short hairpin TM9SF1.
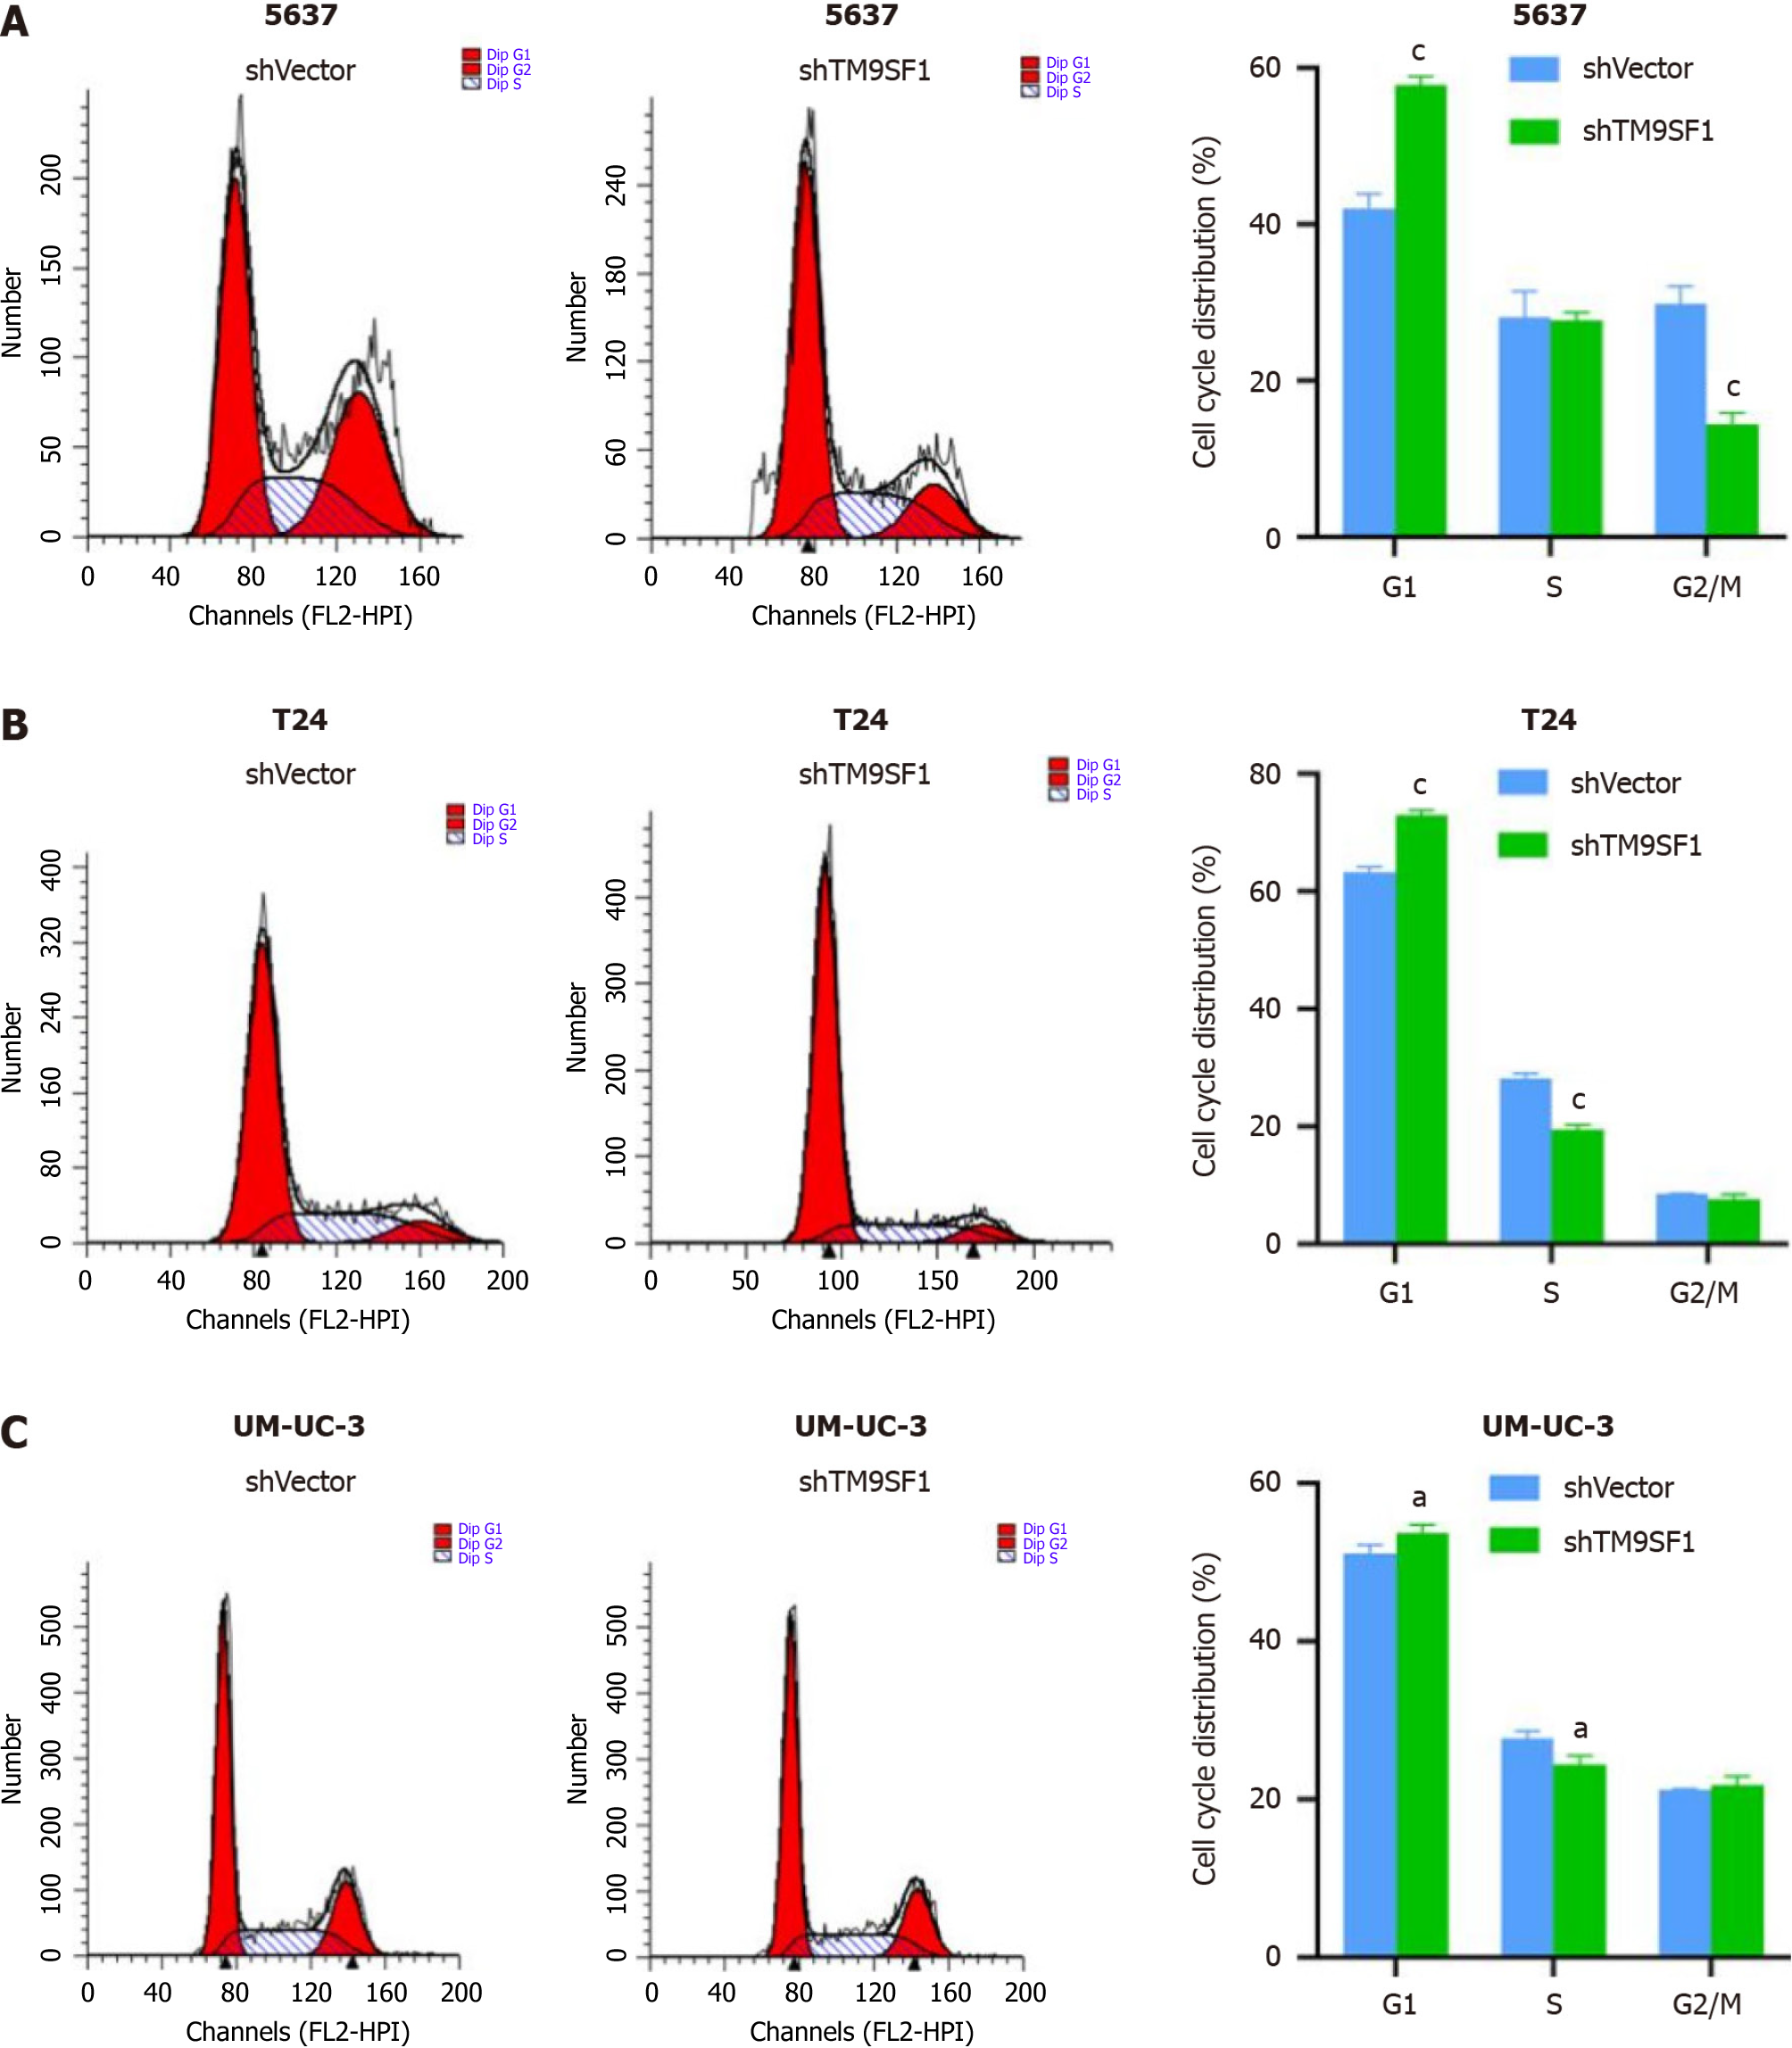
Figure 12 Effect of TM9SF1 knockdown on bladder cancer cell cycle progression.
A-C: Cell cycle results of TM9SF1 knockdown (short hairpin TM9SF1) and control (short hairpin vector) groups in (A) 5637, (B) T24, and (C) UMUC-3 cells. aP < 0.05, cP < 0.001. shVector: Short hairpin vector; shTM9SF1: Short hairpin TM9SF1.
- Citation: Wei L, Wang SS, Huang ZG, He RQ, Luo JY, Li B, Cheng JW, Wu KJ, Zhou YH, Liu S, Li SH, Chen G. TM9SF1 promotes bladder cancer cell growth and infiltration. World J Clin Oncol 2024; 15(2): 302-316
- URL: https://www.wjgnet.com/2218-4333/full/v15/i2/302.htm
- DOI: https://dx.doi.org/10.5306/wjco.v15.i2.302


