Copyright
©The Author(s) 2024.
World J Clin Oncol. Nov 24, 2024; 15(11): 1412-1427
Published online Nov 24, 2024. doi: 10.5306/wjco.v15.i11.1412
Published online Nov 24, 2024. doi: 10.5306/wjco.v15.i11.1412
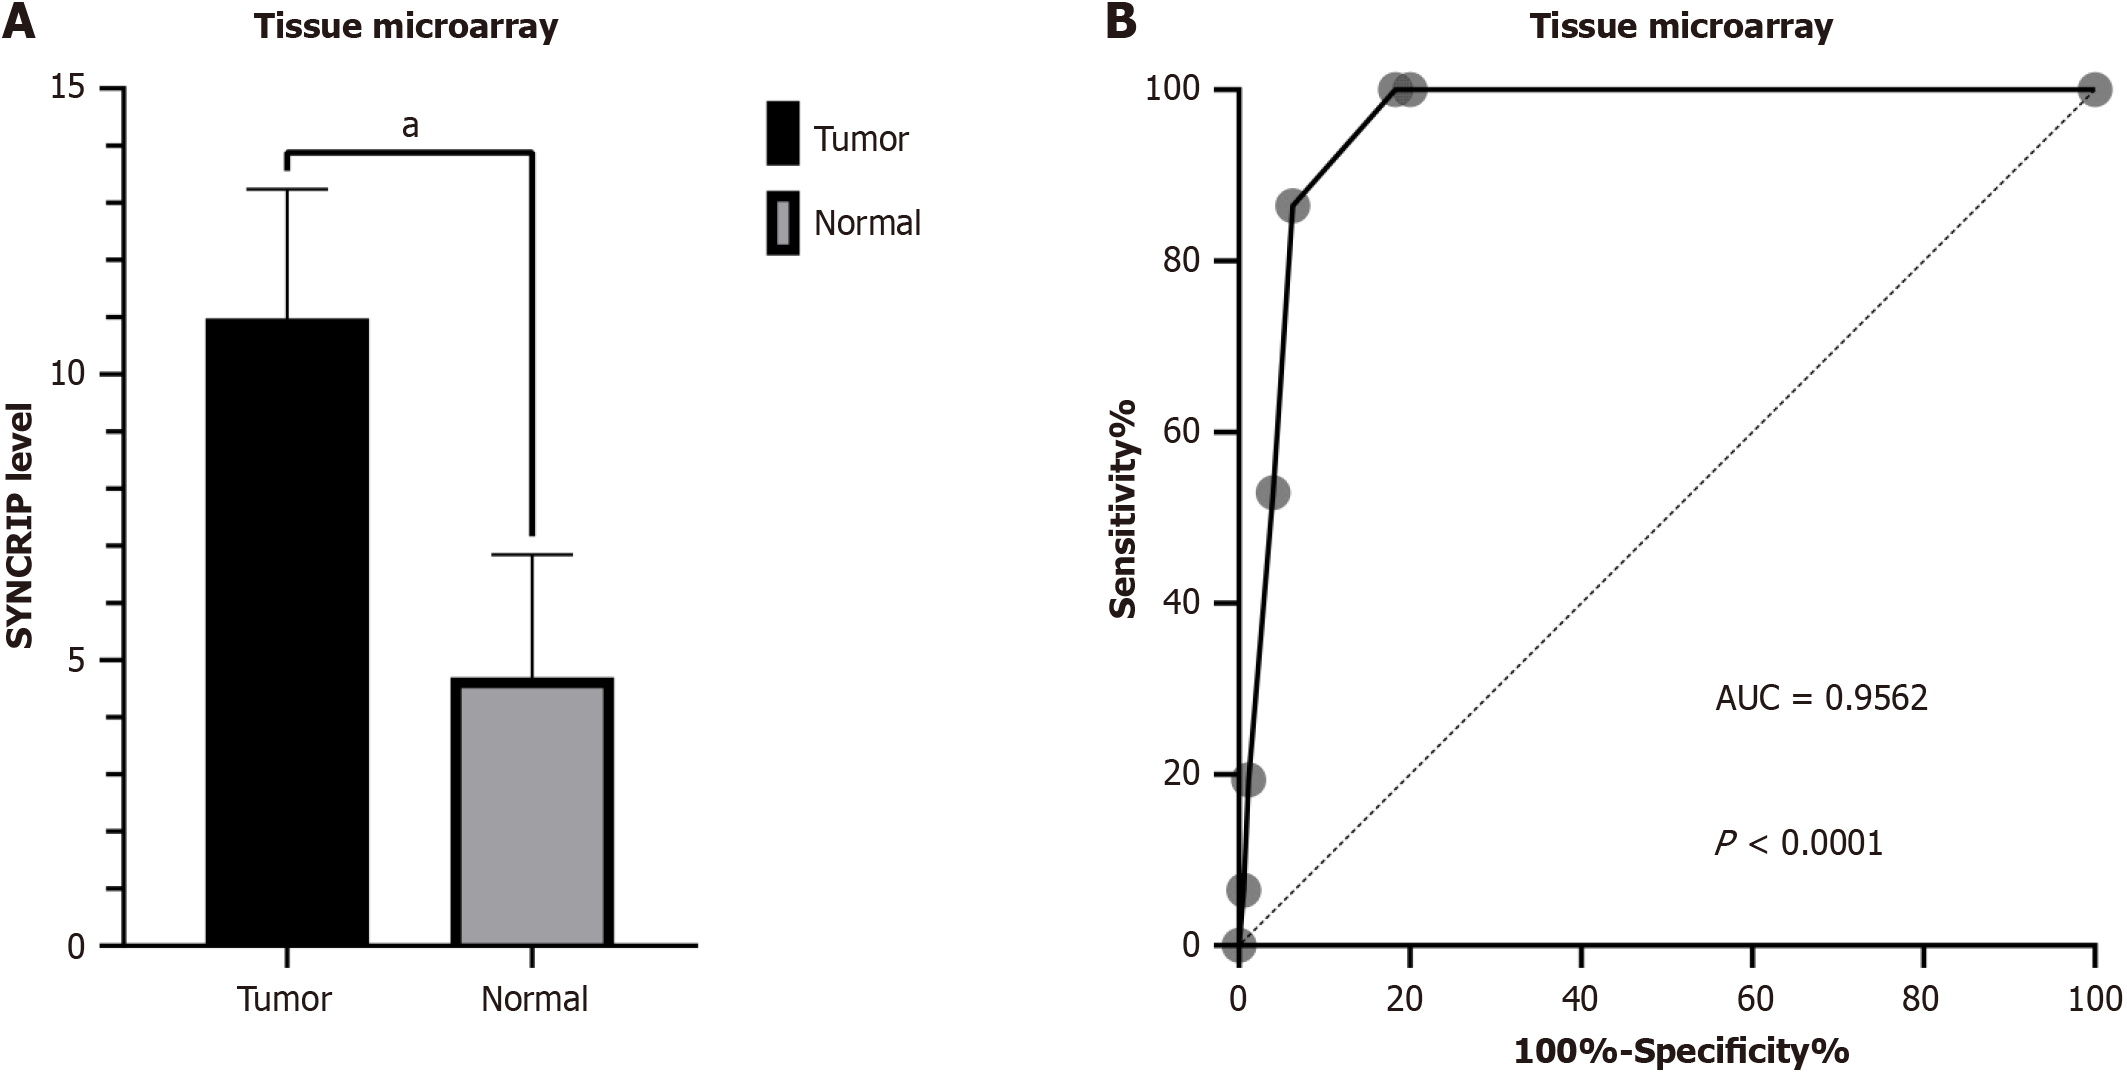
Figure 1 The protein level of synaptotagmin binding cytoplasmic RNA interacting protein in colorectal cancer based on staining scores.
A: The expression of synaptotagmin binding cytoplasmic RNA interacting protein (SYNCRIP) protein in colorectal cancer (CRC) samples (black bar) was higher than in non-tumorous tissues (gray bar) with P < 0.0001; B: SYNCRIP could satisfactorily distinguish the CRC and non-tumorous tissue. aP < 0.0001. SYNCRIP: Synaptotagmin binding cytoplasmic RNA interacting protein; AUC: Area under the curve.
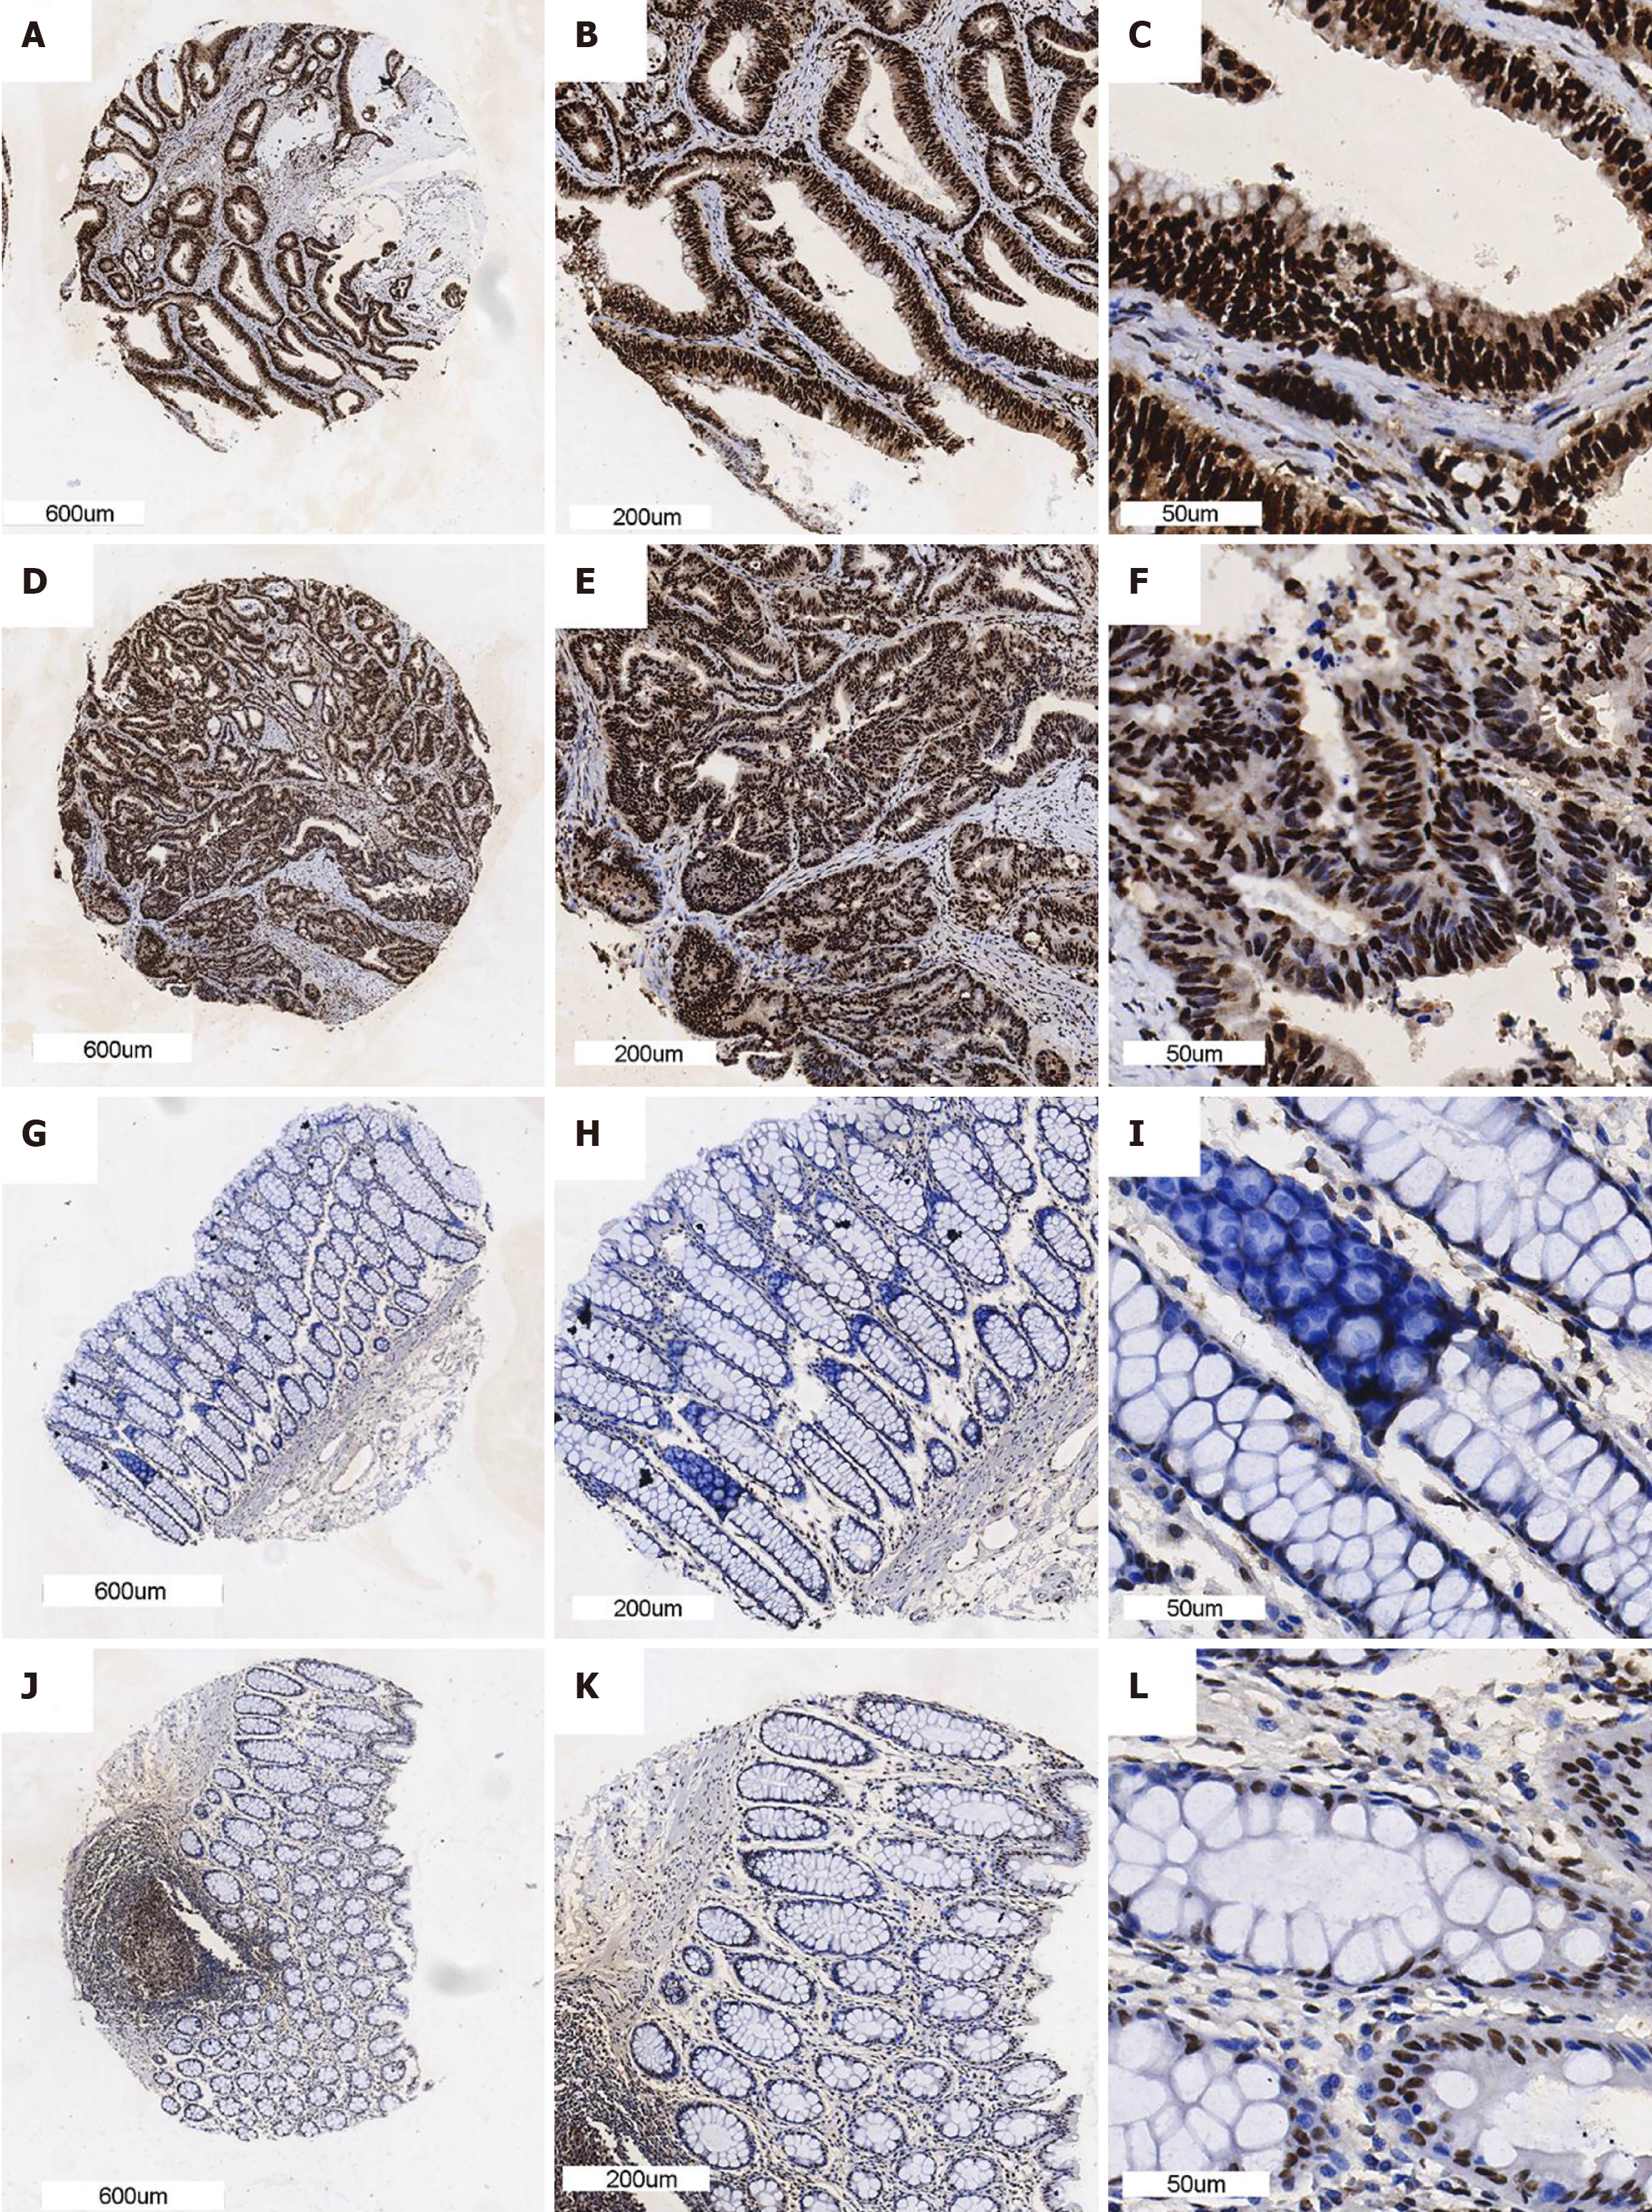
Figure 2 The protein level of synaptotagmin binding cytoplasmic RNA interacting protein in colorectal cancer is higher than in non-tumorous tissue.
We randomly select two colorectal cancer (CRC) tissue and non-cancerous tissue to show. A-C: CRC sample with the magnification is × 10, × 40 and × 100; D-F: Another CRC sample with the magnification is × 10, × 40 and × 100; G-I: Non-tumorous colorectal sample with the magnification is × 10, × 40 and × 100; J-L: The other non-tumorous colorectal sample with the magnification is × 10, × 40 and × 100.
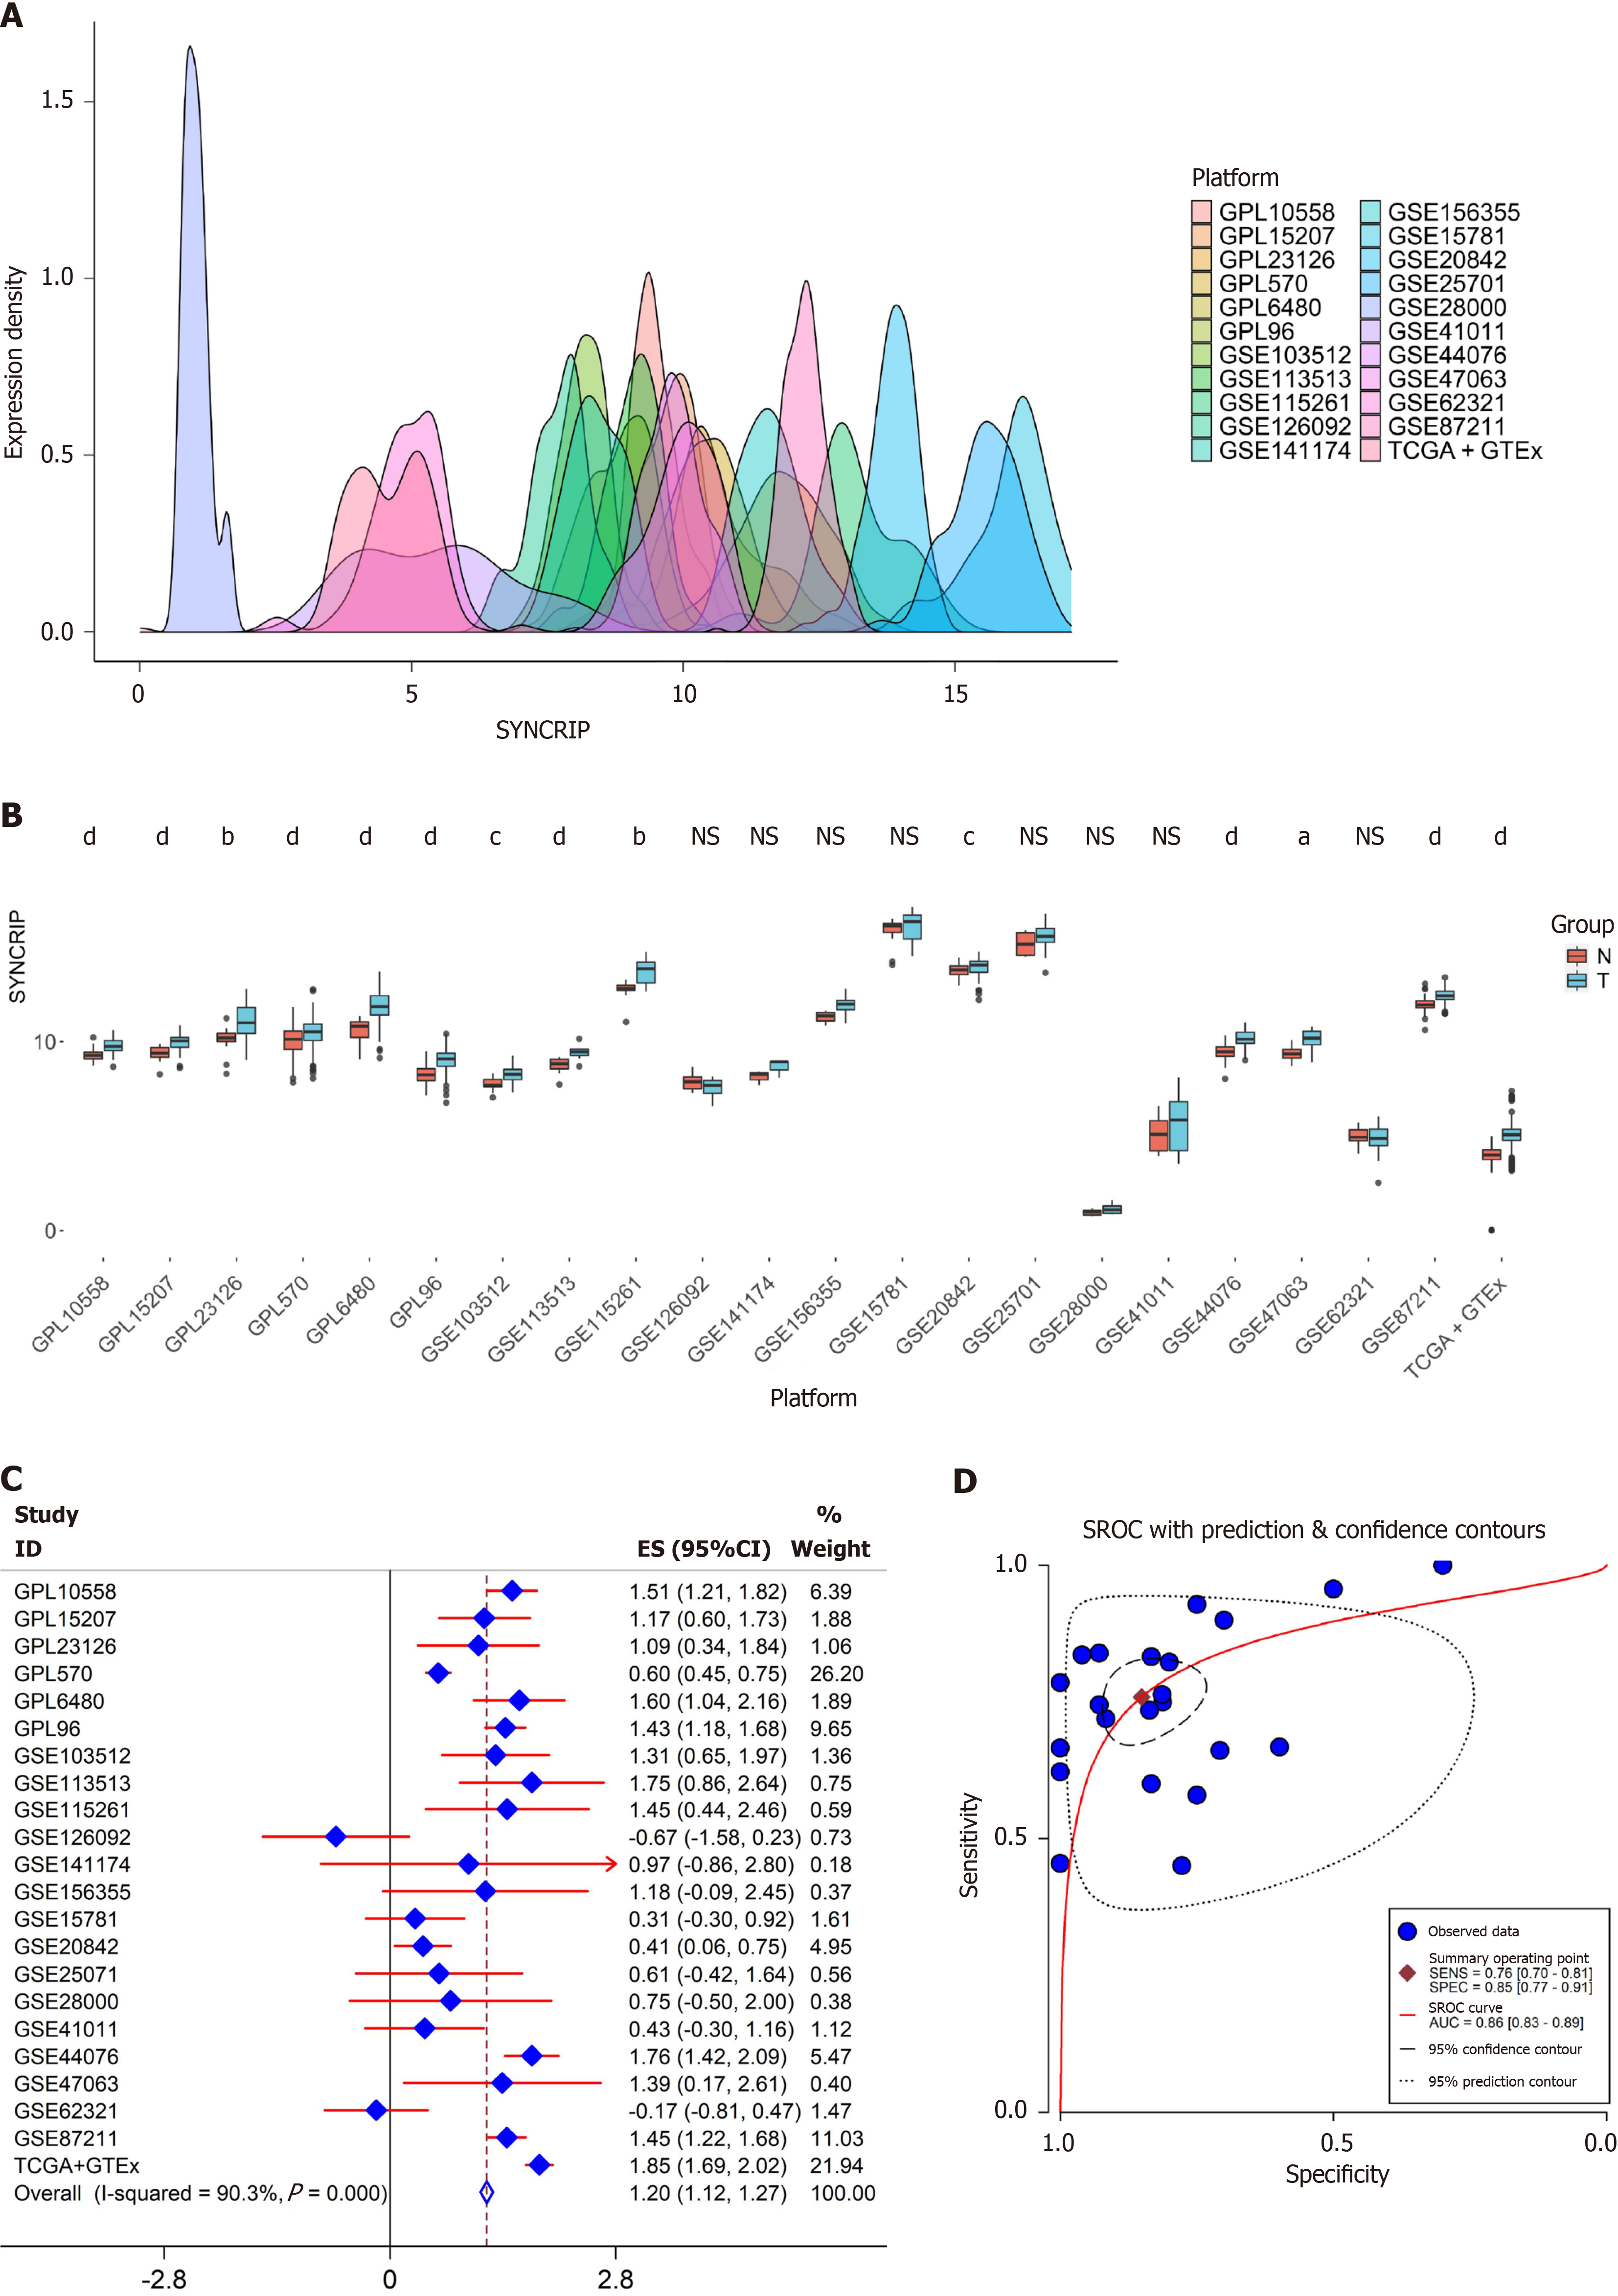
Figure 3 The expression of synaptotagmin binding cytoplasmic RNA interacting protein mRNA in colorectal cancer is higher than in non-tumorous tissue based on high-throughput array and sequence data.
A: 22 datasets were obtained and integrated. The expression distribution of each dataset was close to Gaussian distribution; B: The expression of synaptotagmin binding cytoplasmic RNA interacting protein (SYNCRIP) in each dataset was calculated, and the high expression tendency of SYNCRIP in colorectal cancer (CRC) with significant statistical value in 14 datasets. Blue boxes were the CRC samples and the red boxes were the normal samples. aP < 0.05; bP < 0.01; cP < 0.001; dP < 0.0001; C: According to the standard mean deviation (SMD) model, SYNCRIP was exactly up-regulated in CRC compared to non-cancerous tissue with SMD = 1.20 (95%CI: 1.12-1.27, I2 = 90.3%). The blue diamond represented the effect size of SYNCRIP in each dataset, and the red line was the error bar; D: The summary receiver operating characteristic curve and area under the curve (AUC) were calculated. Blue points were the datasets and the red curve were the boundary of AUC. SYNCRIP: Synaptotagmin binding cytoplasmic RNA interacting protein.
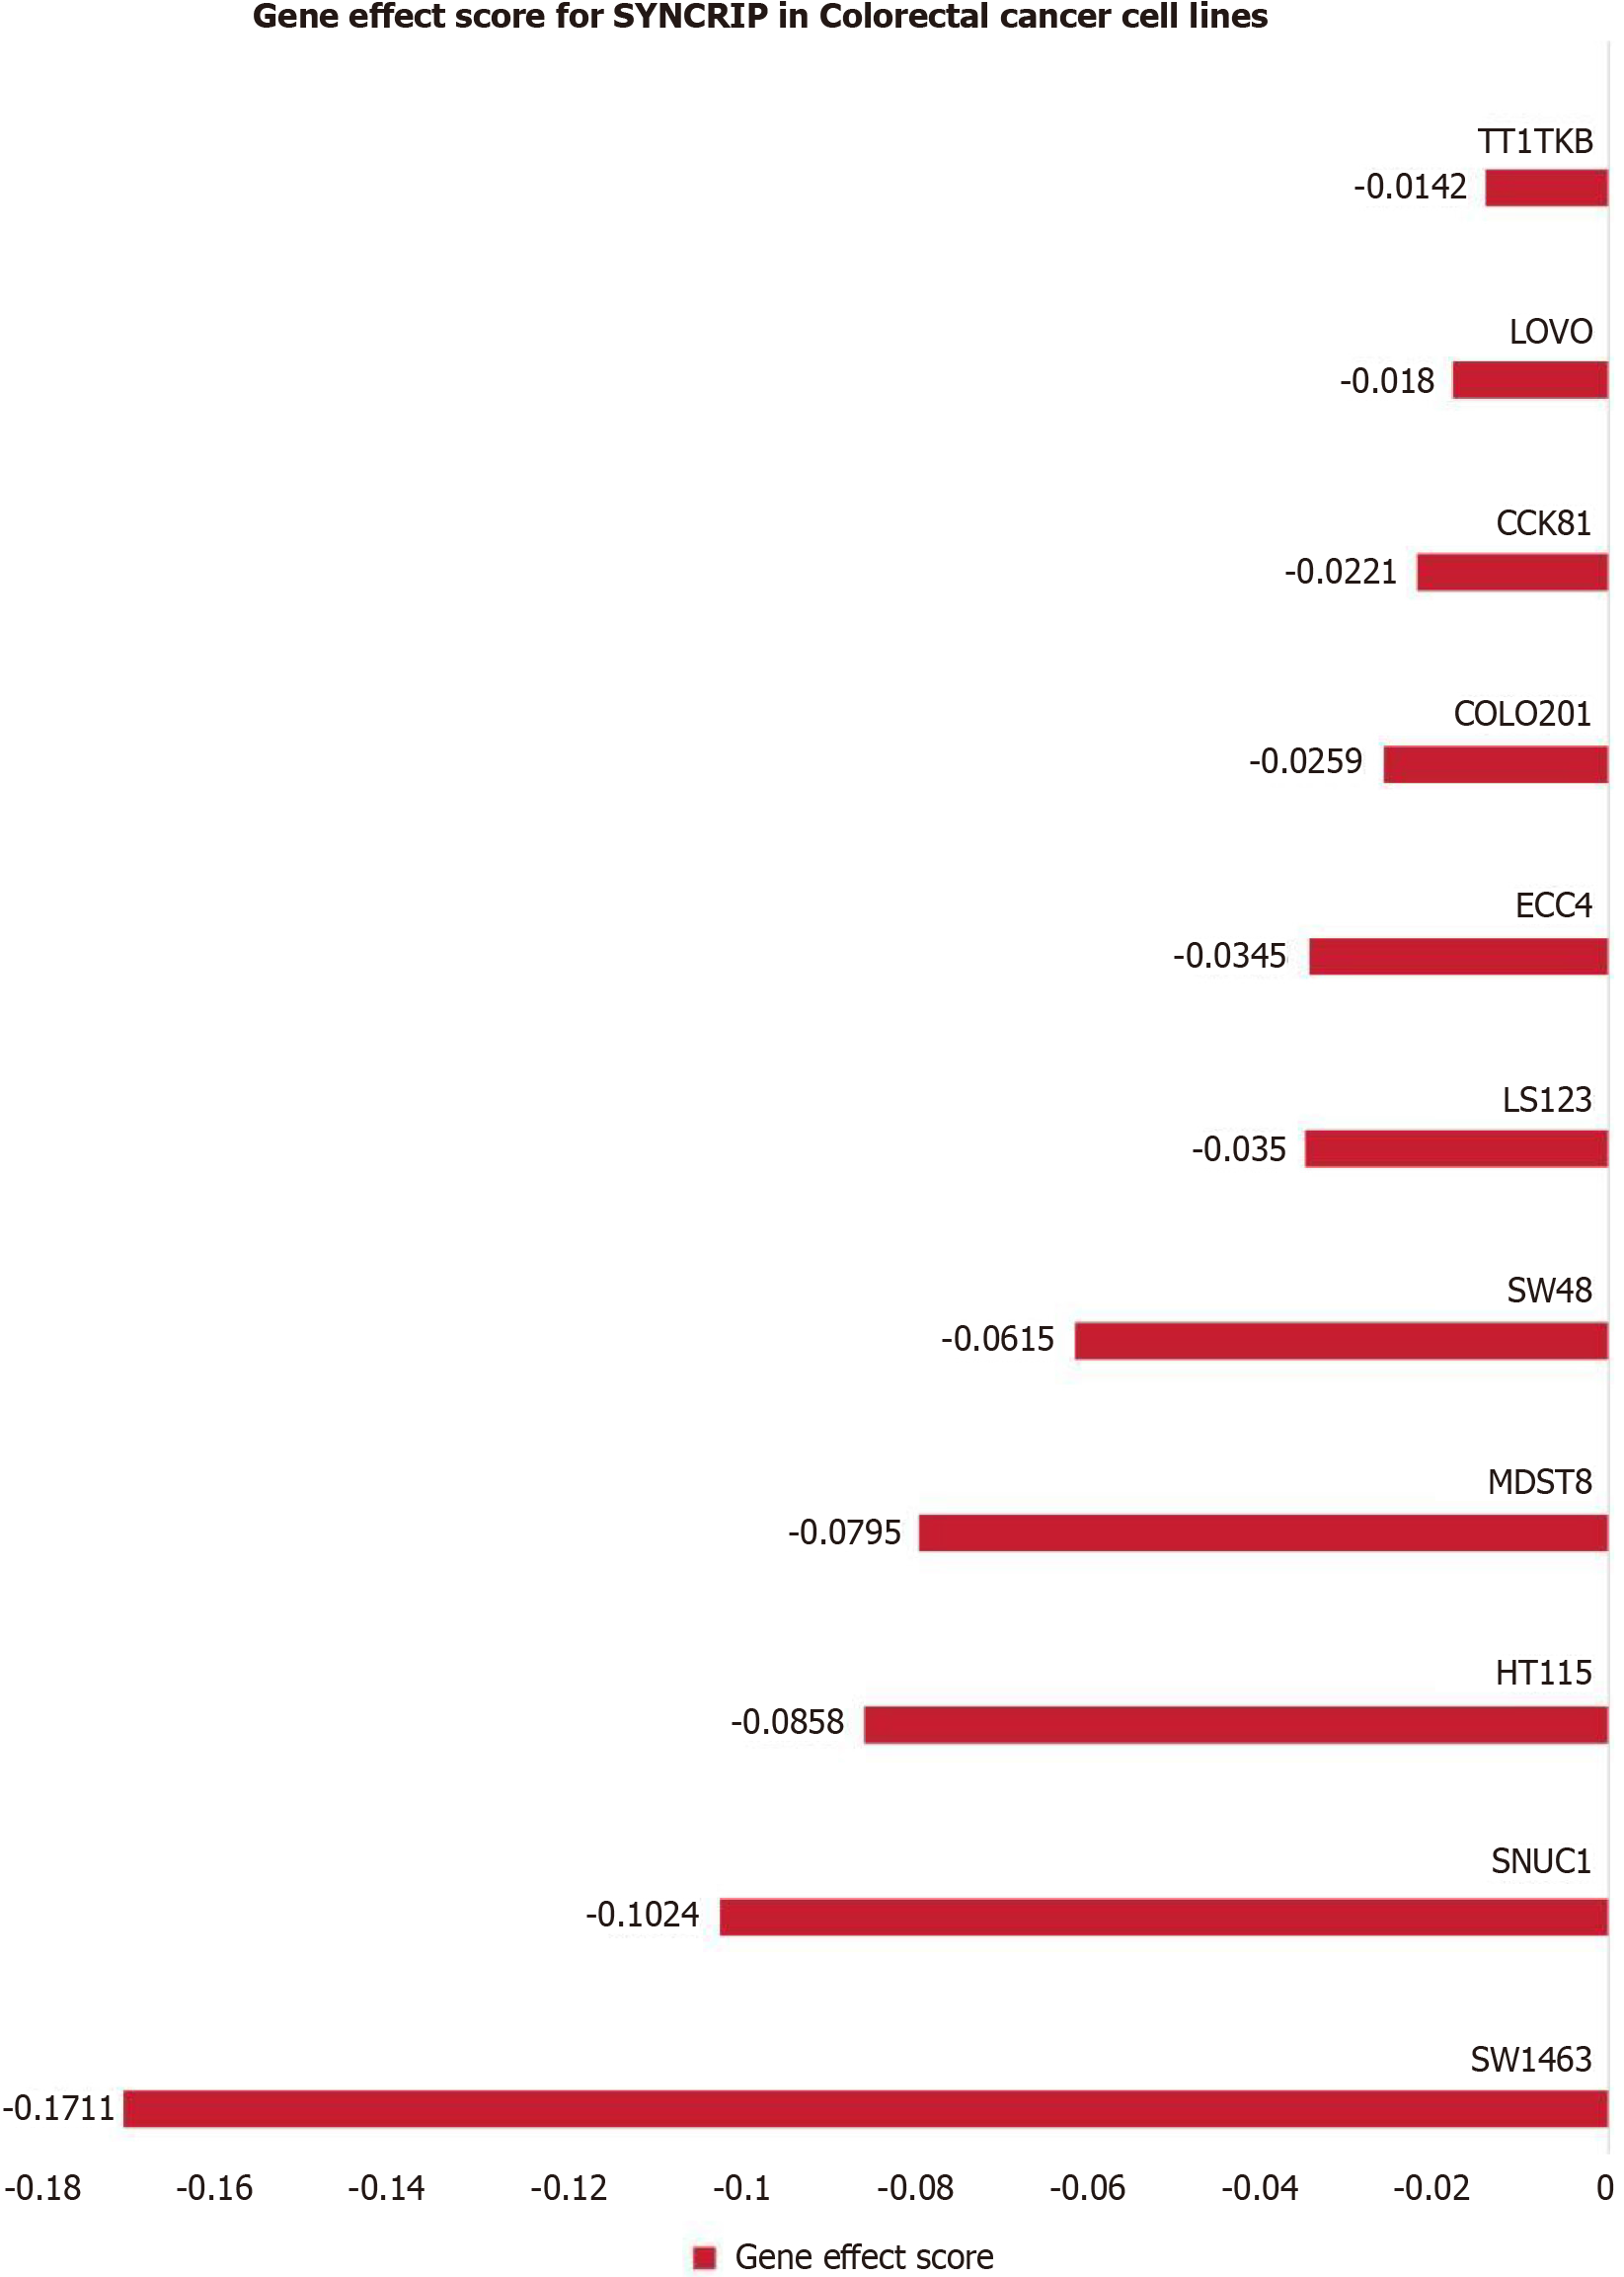
Figure 4
Gene effect score of synaptotagmin binding cytoplasmic RNA interacting protein mRNA gene in 11 colorectal cancer cell lines showed knockdown of synaptotagmin binding cytoplasmic RNA interacting protein mRNA gene colorectal cancer cell growth was inhibited.
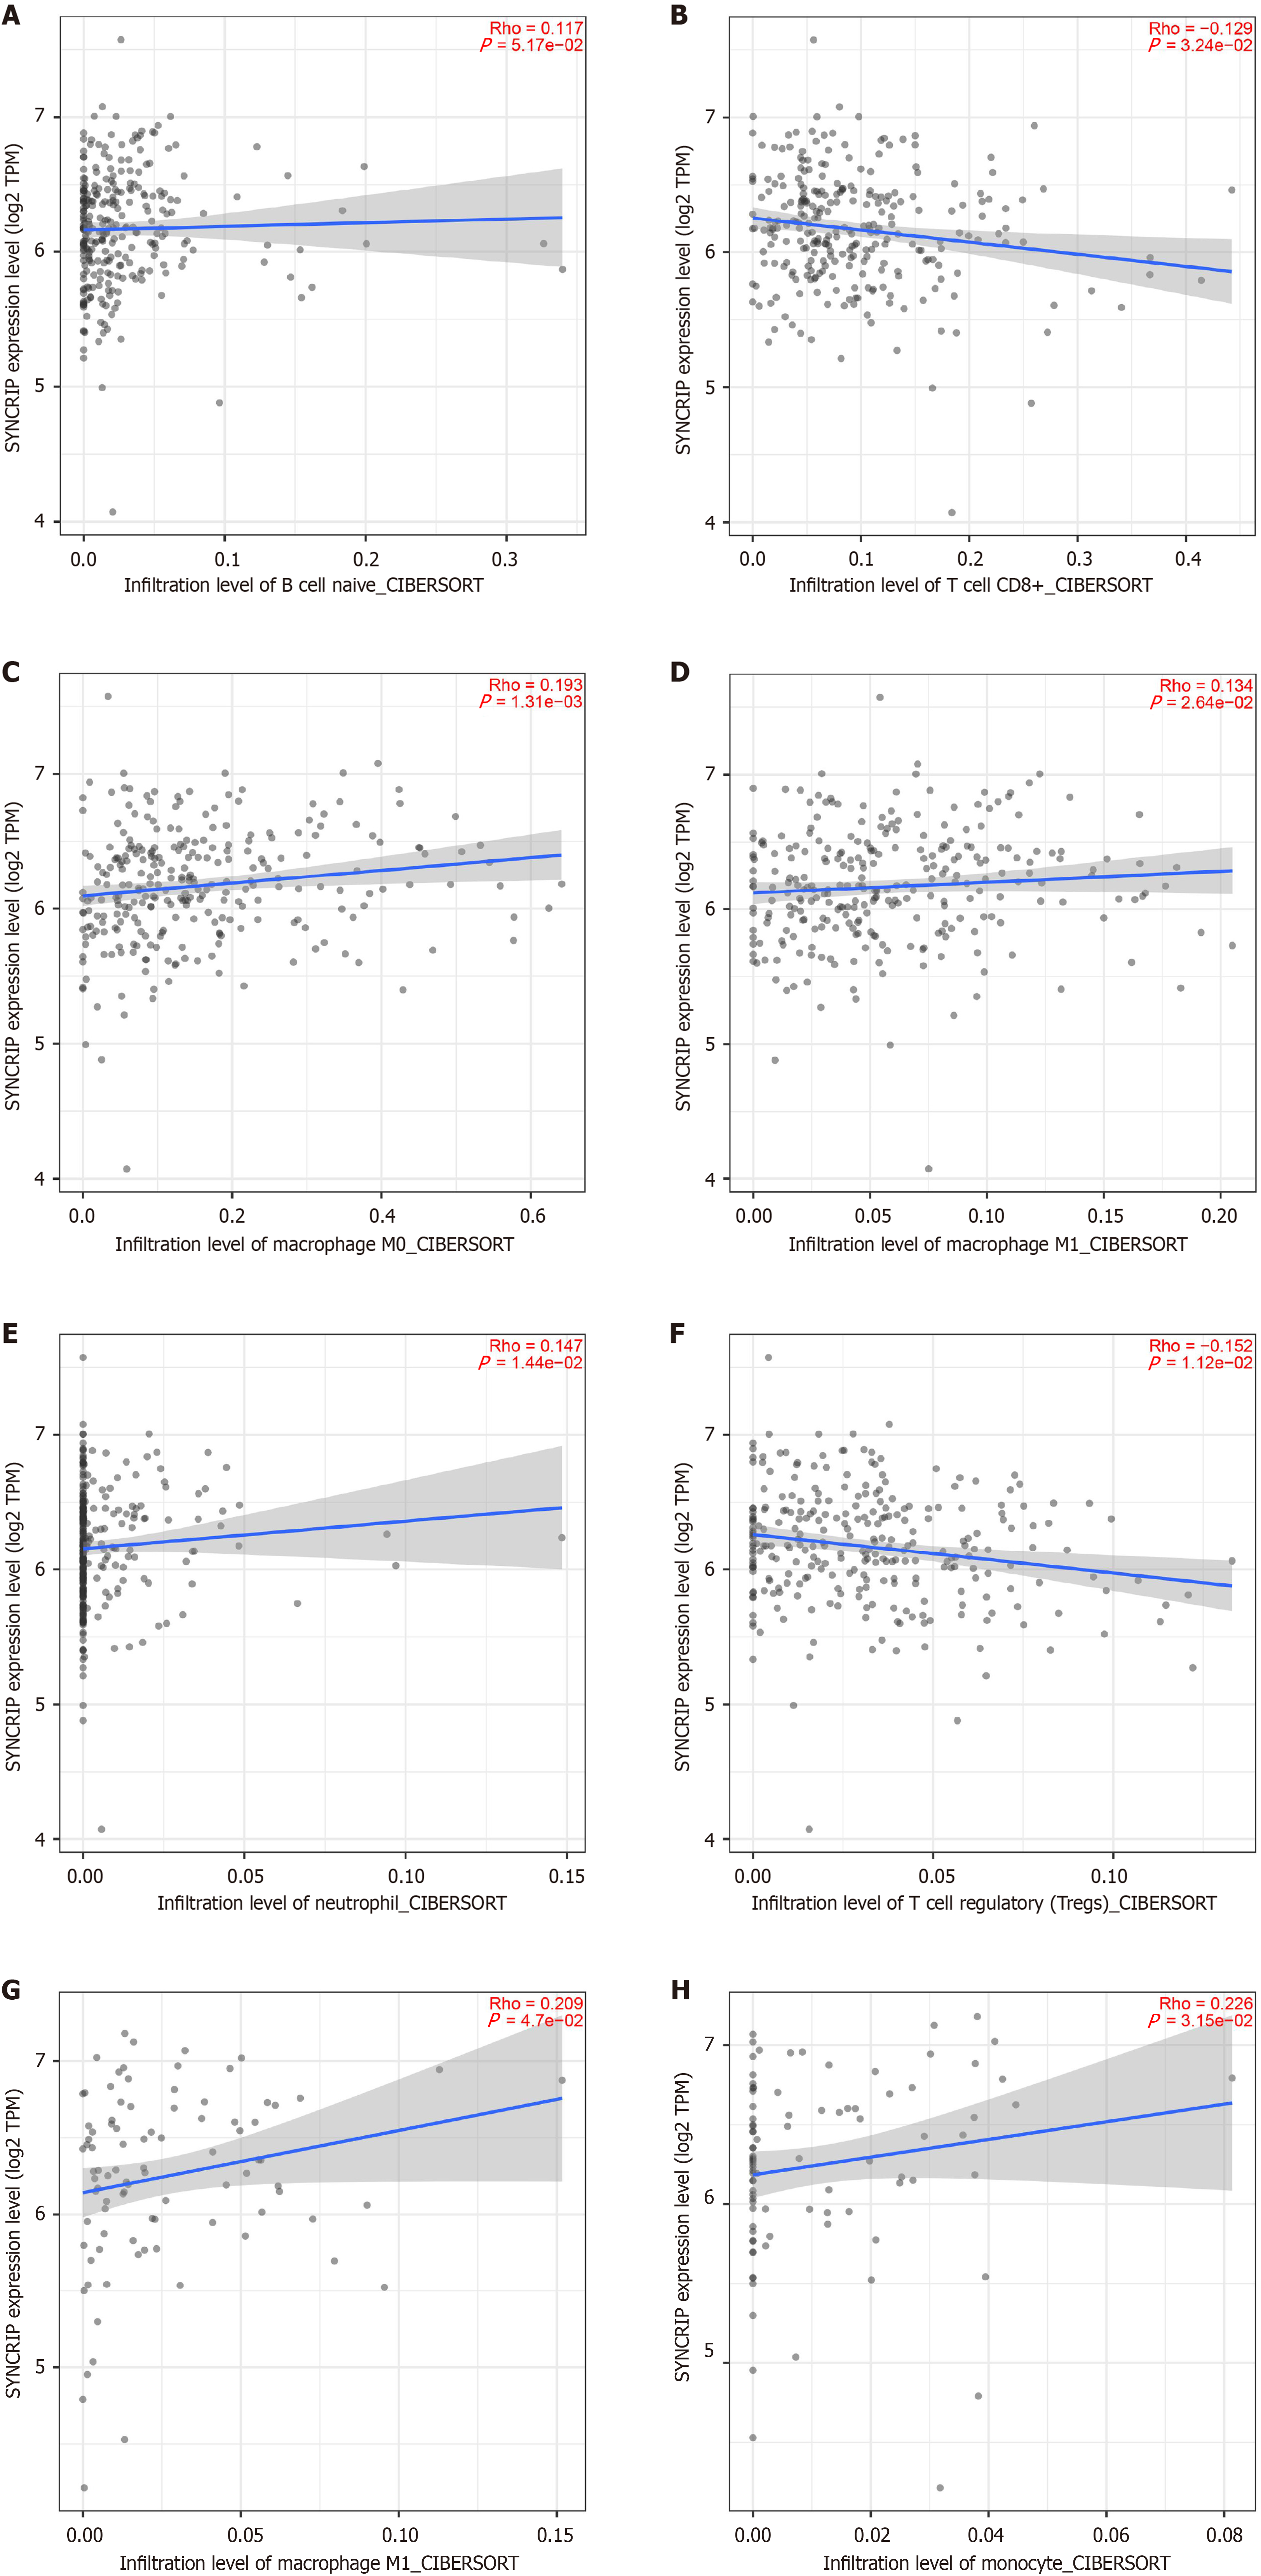
Figure 5 The relationship between synaptotagmin binding cytoplasmic RNA interacting protein mRNA and immune microenvironments in colorectal cancer.
The blue line was the fit line and the gray region was the 95% error range. In colon adenocarcinoma: A: Positively correlated to naive B cell; B: Negatively correlated to CD8+ T cell; C: Positively correlated to M0 macrophage; D: Positively correlated to M1 macrophage; E: Positively correlated to neutrophil; F: Negatively correlated to regulatory T cell, in rectum adenocarcinoma; G: Positively correlated to M1 macrophage; H: Positively correlated to monocyte.
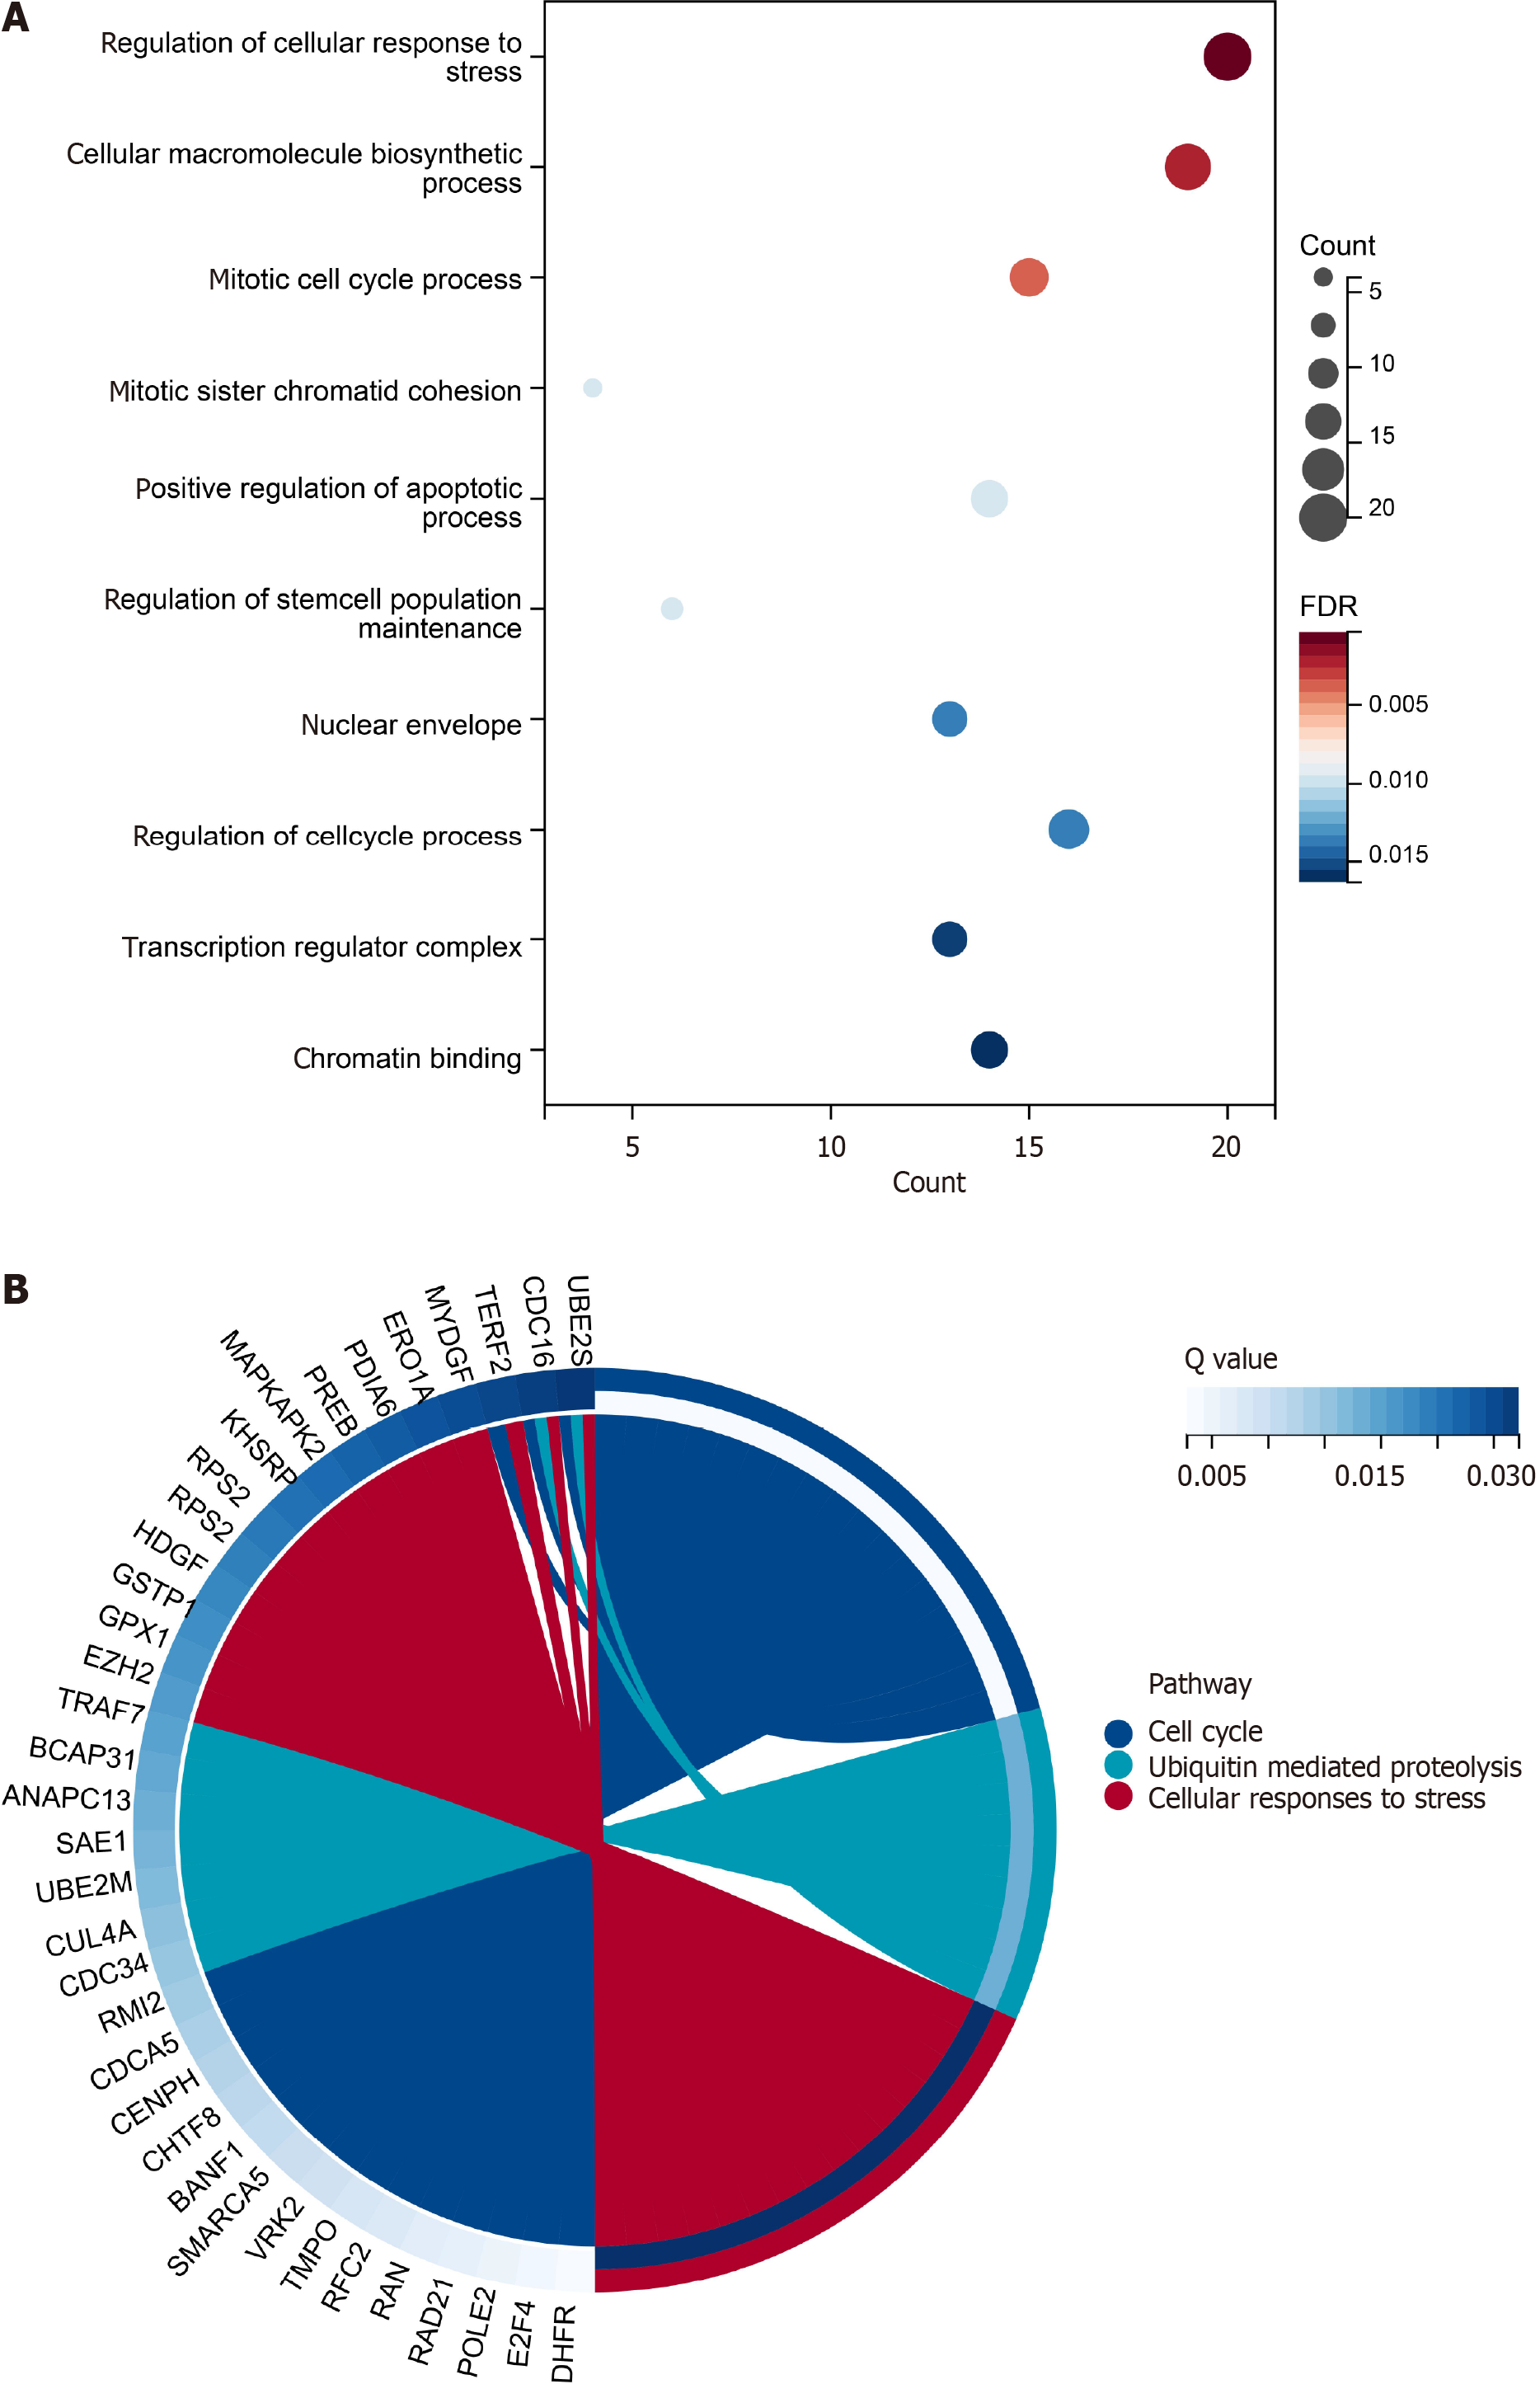
Figure 6 Enrichment analyses based on gene ontology and the Kyoto Encyclopedia of Genes and Genomes items.
A: Gene ontology (GO) enrichment analysis. The size was the genes enriched in the items and the red color meant high statistical significance. The top ten items in GO database were displayed in the bubble chart; B: The left semicircle was the genes enriched in the pathways in the chord diagram. Only three pathways had the statistical significance.
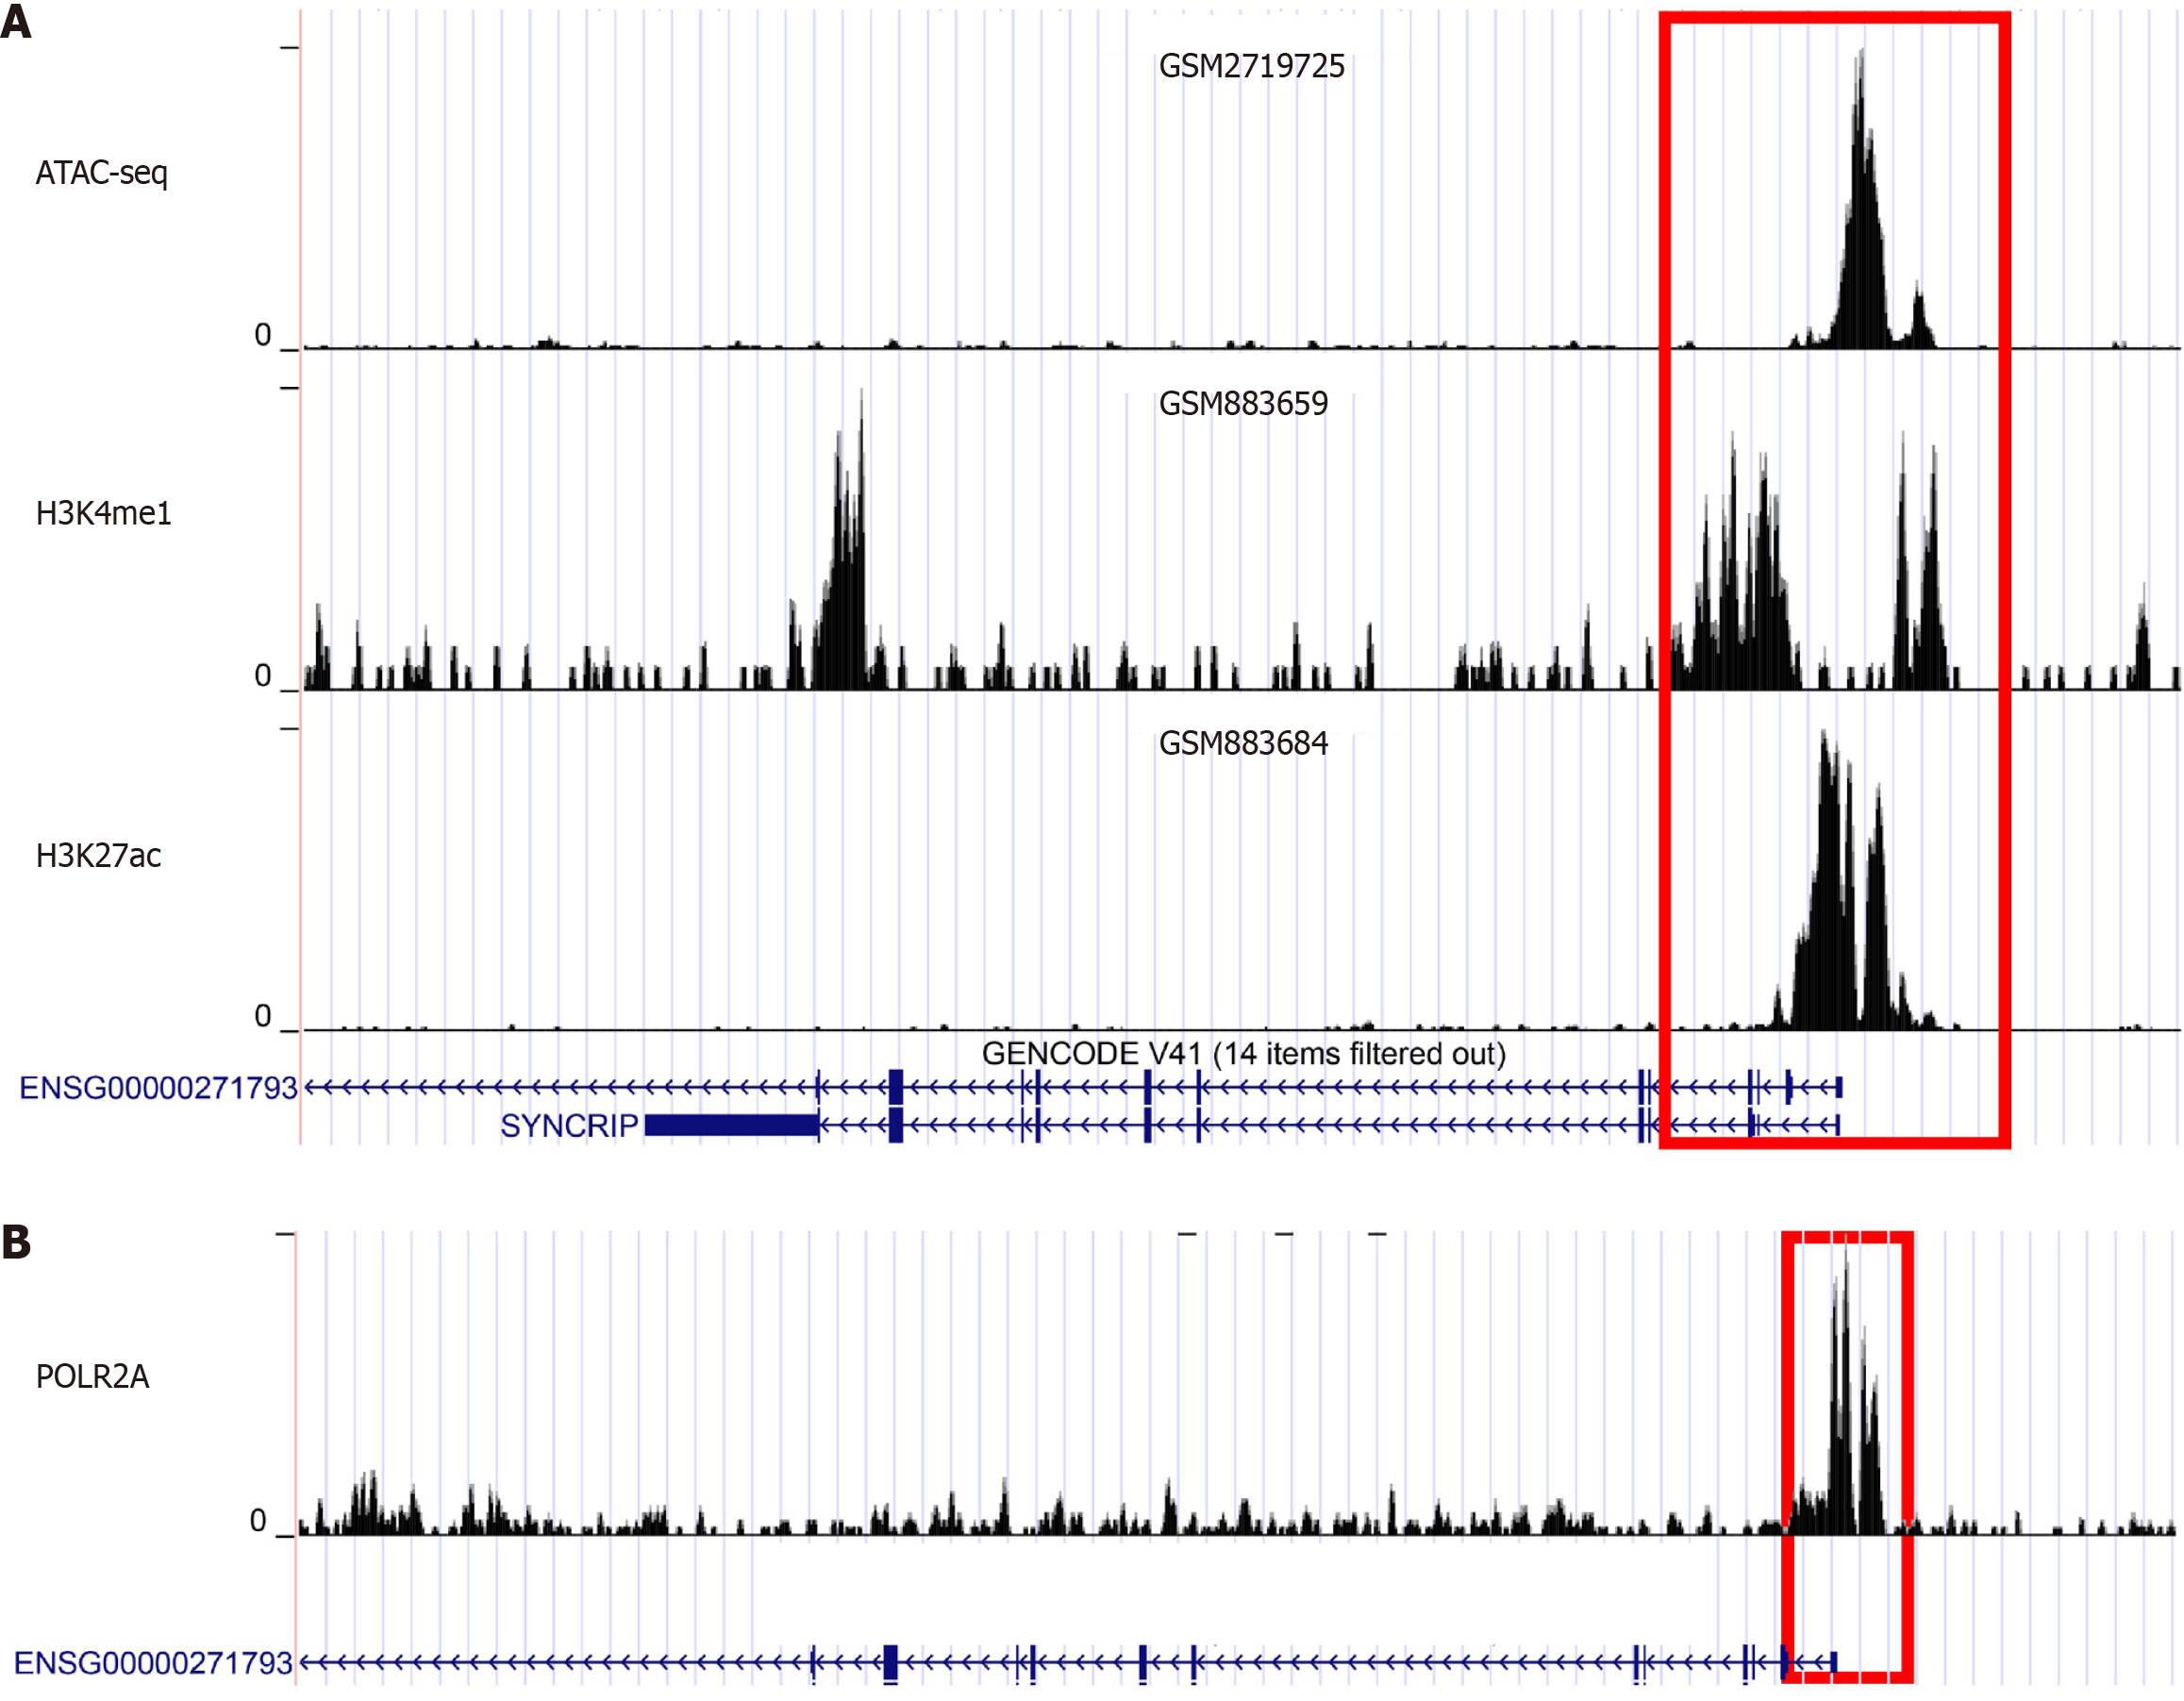
Figure 7 The regulatory mechanism of synaptotagmin binding cytoplasmic RNA interacting protein mRNA in colorectal cancer were explored based on assay for transposase-accessible chromatin-seq and chromatin immunoprecipitation-seq.
A: Assay for transposase-accessible chromatin-seq showed the prominent enrichment in the promotor region of synaptotagmin binding cytoplasmic RNA interacting protein mRNA (SYNCRIP). And the promotor region of SYNCRIP were also enriched in chromatin immunoprecipitation-seq (ChIP-seq) with H3K4me1 and H3K27ac marked samples; B: In the POLR2A marked ChIP-seq data, the promotor region of SYNCRIP were also enriched and SYNCRIP might be regulated by POLR2A.
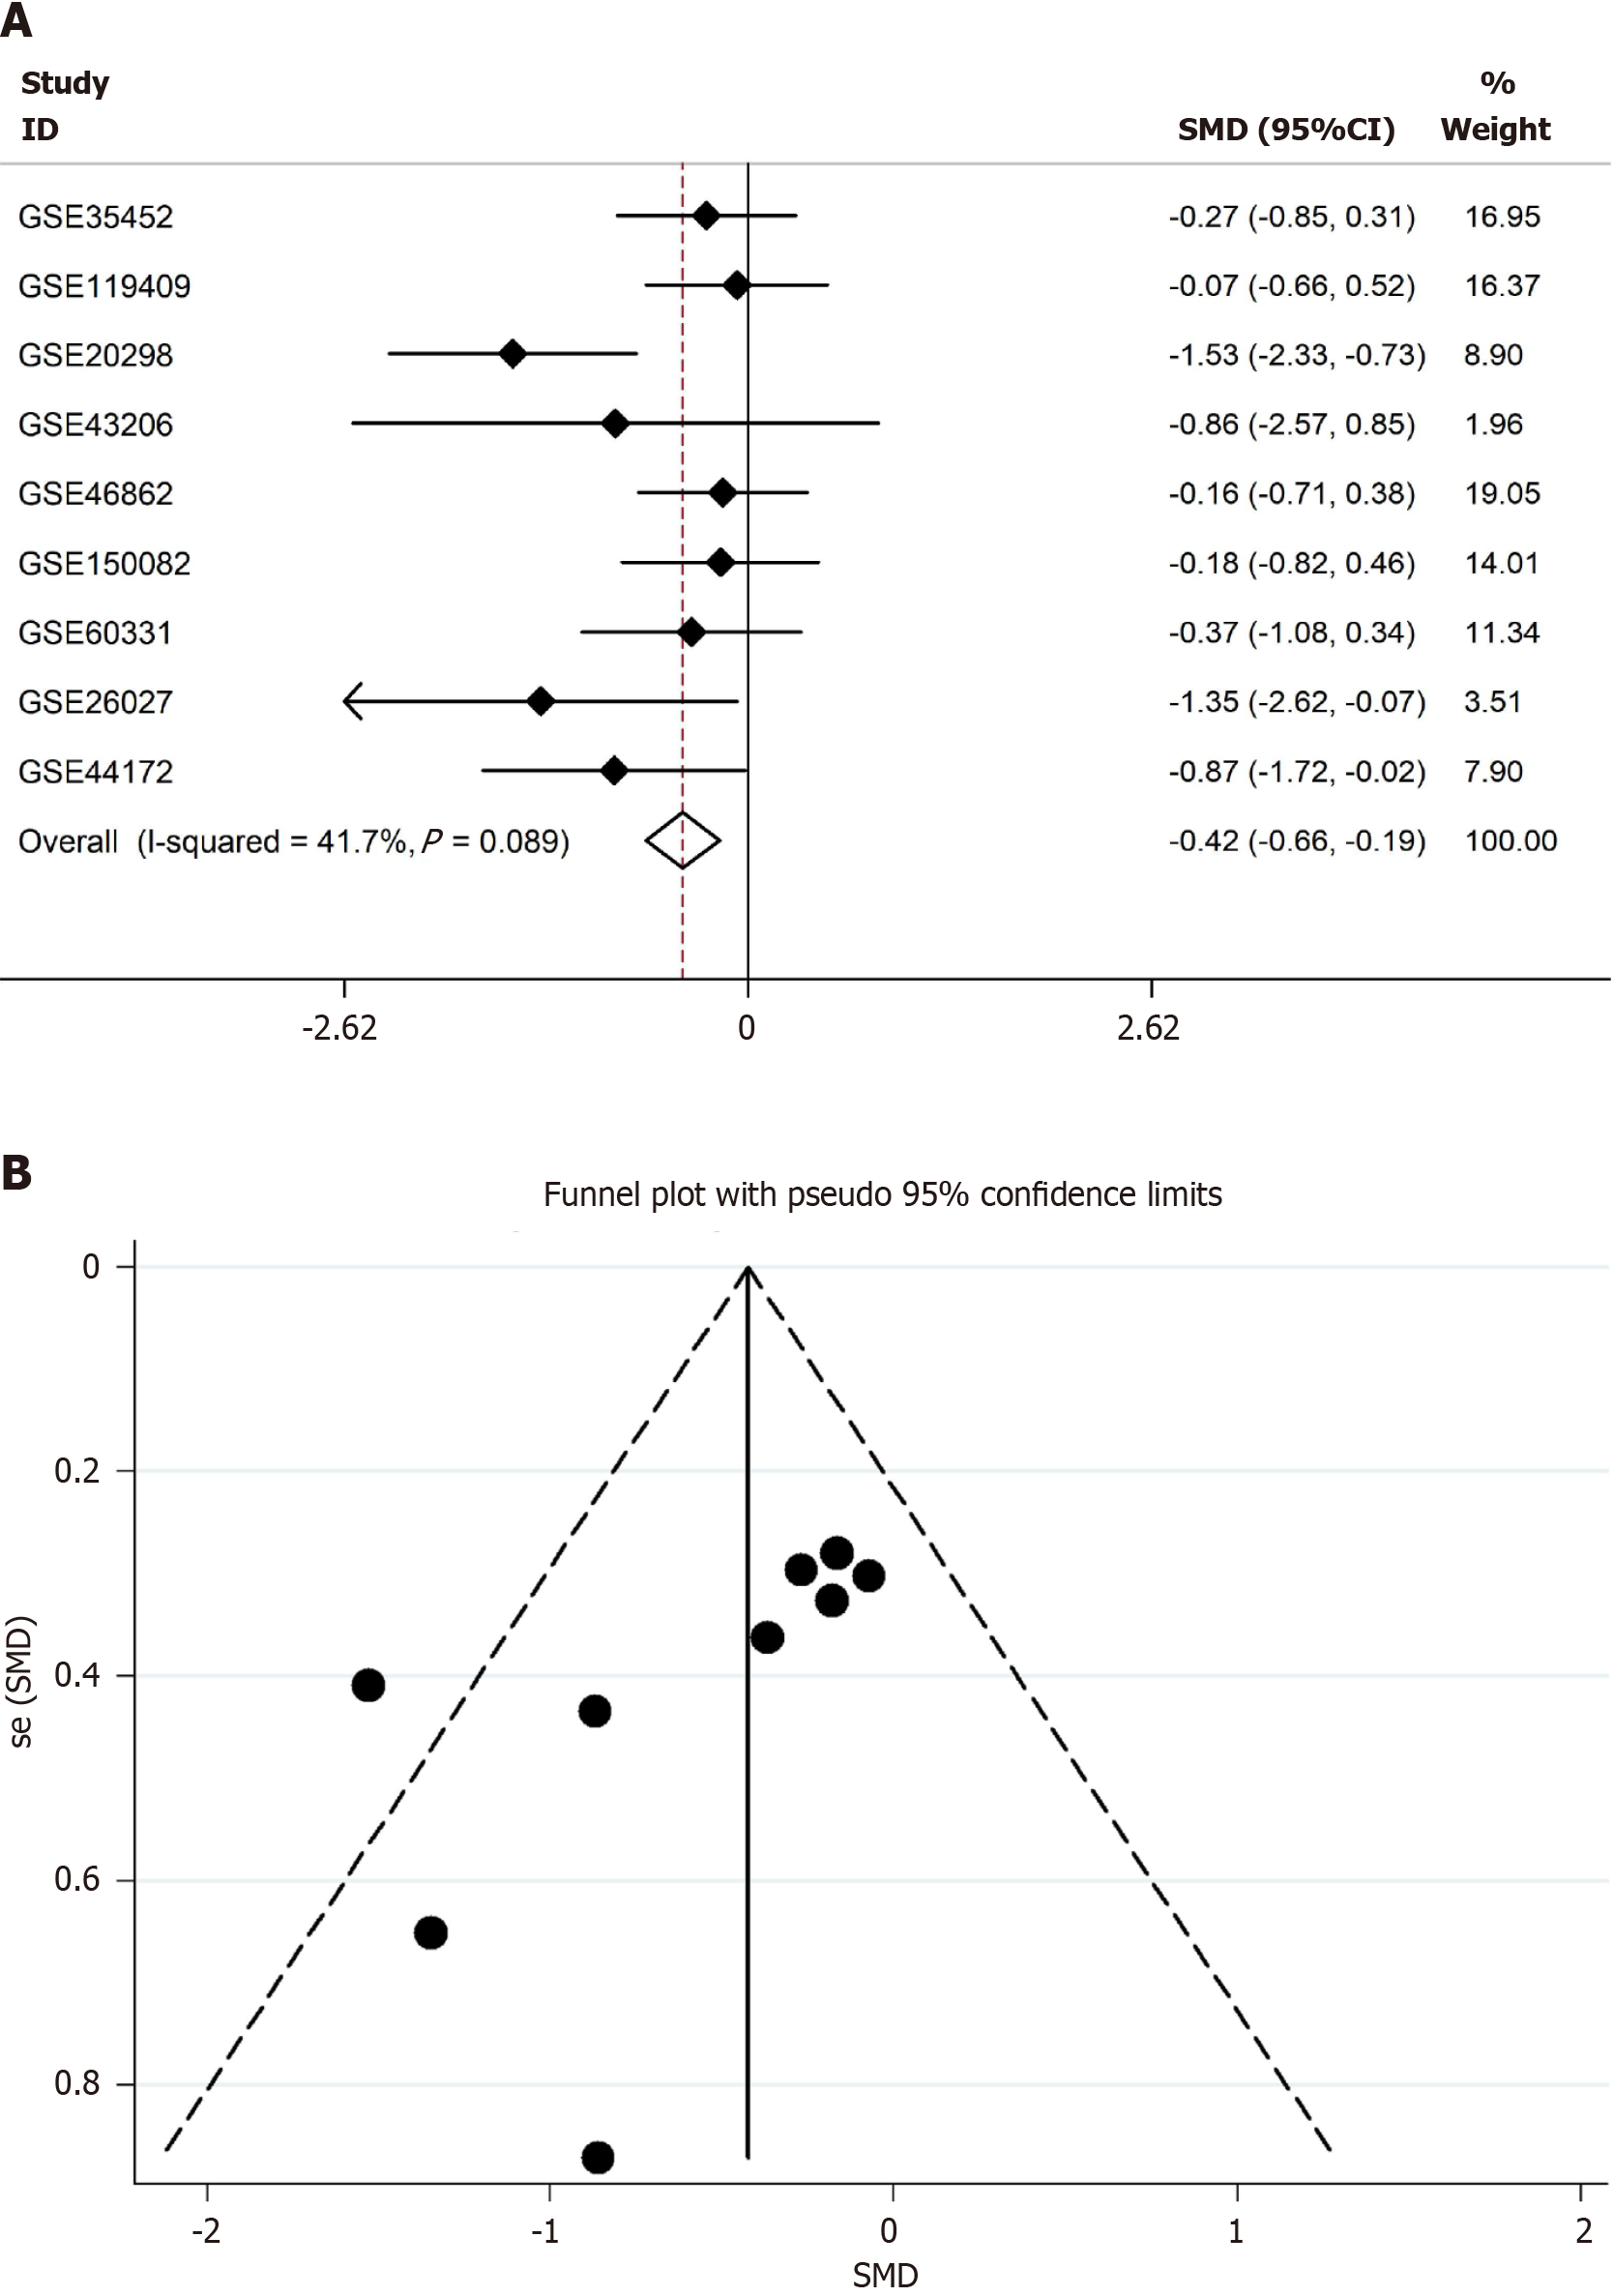
Figure 8 Synaptotagmin binding cytoplasmic RNA interacting protein mRNA was highly expressed in radio-sensitivity colorectal cancer samples according to the standard mean deviation model.
A: Based on evidence-based medicine, total nine datasets including radiotherapy information were enrolled and calculated the expression of synaptotagmin binding cytoplasmic RNA interacting protein mRNA (SYNCRIP). SYNCRIP was highly expressed in radio-sensitivity group compared to radio-resistance group; B: Funnel plot showed no public bias in the standard mean deviation model. SMD: Standard mean deviation.
- Citation: Li H, Huang HQ, Huang ZG, He RQ, Fang YY, Song R, Luo JY, Zeng DT, Qin K, Wei DM, Chen G. Potential regulatory mechanism and clinical significance of synaptotagmin binding cytoplasmic RNA interacting protein in colorectal cancer. World J Clin Oncol 2024; 15(11): 1412-1427
- URL: https://www.wjgnet.com/2218-4333/full/v15/i11/1412.htm
- DOI: https://dx.doi.org/10.5306/wjco.v15.i11.1412


