Copyright
©The Author(s) 2024.
World J Clin Oncol. Oct 24, 2024; 15(10): 1366-1375
Published online Oct 24, 2024. doi: 10.5306/wjco.v15.i10.1366
Published online Oct 24, 2024. doi: 10.5306/wjco.v15.i10.1366
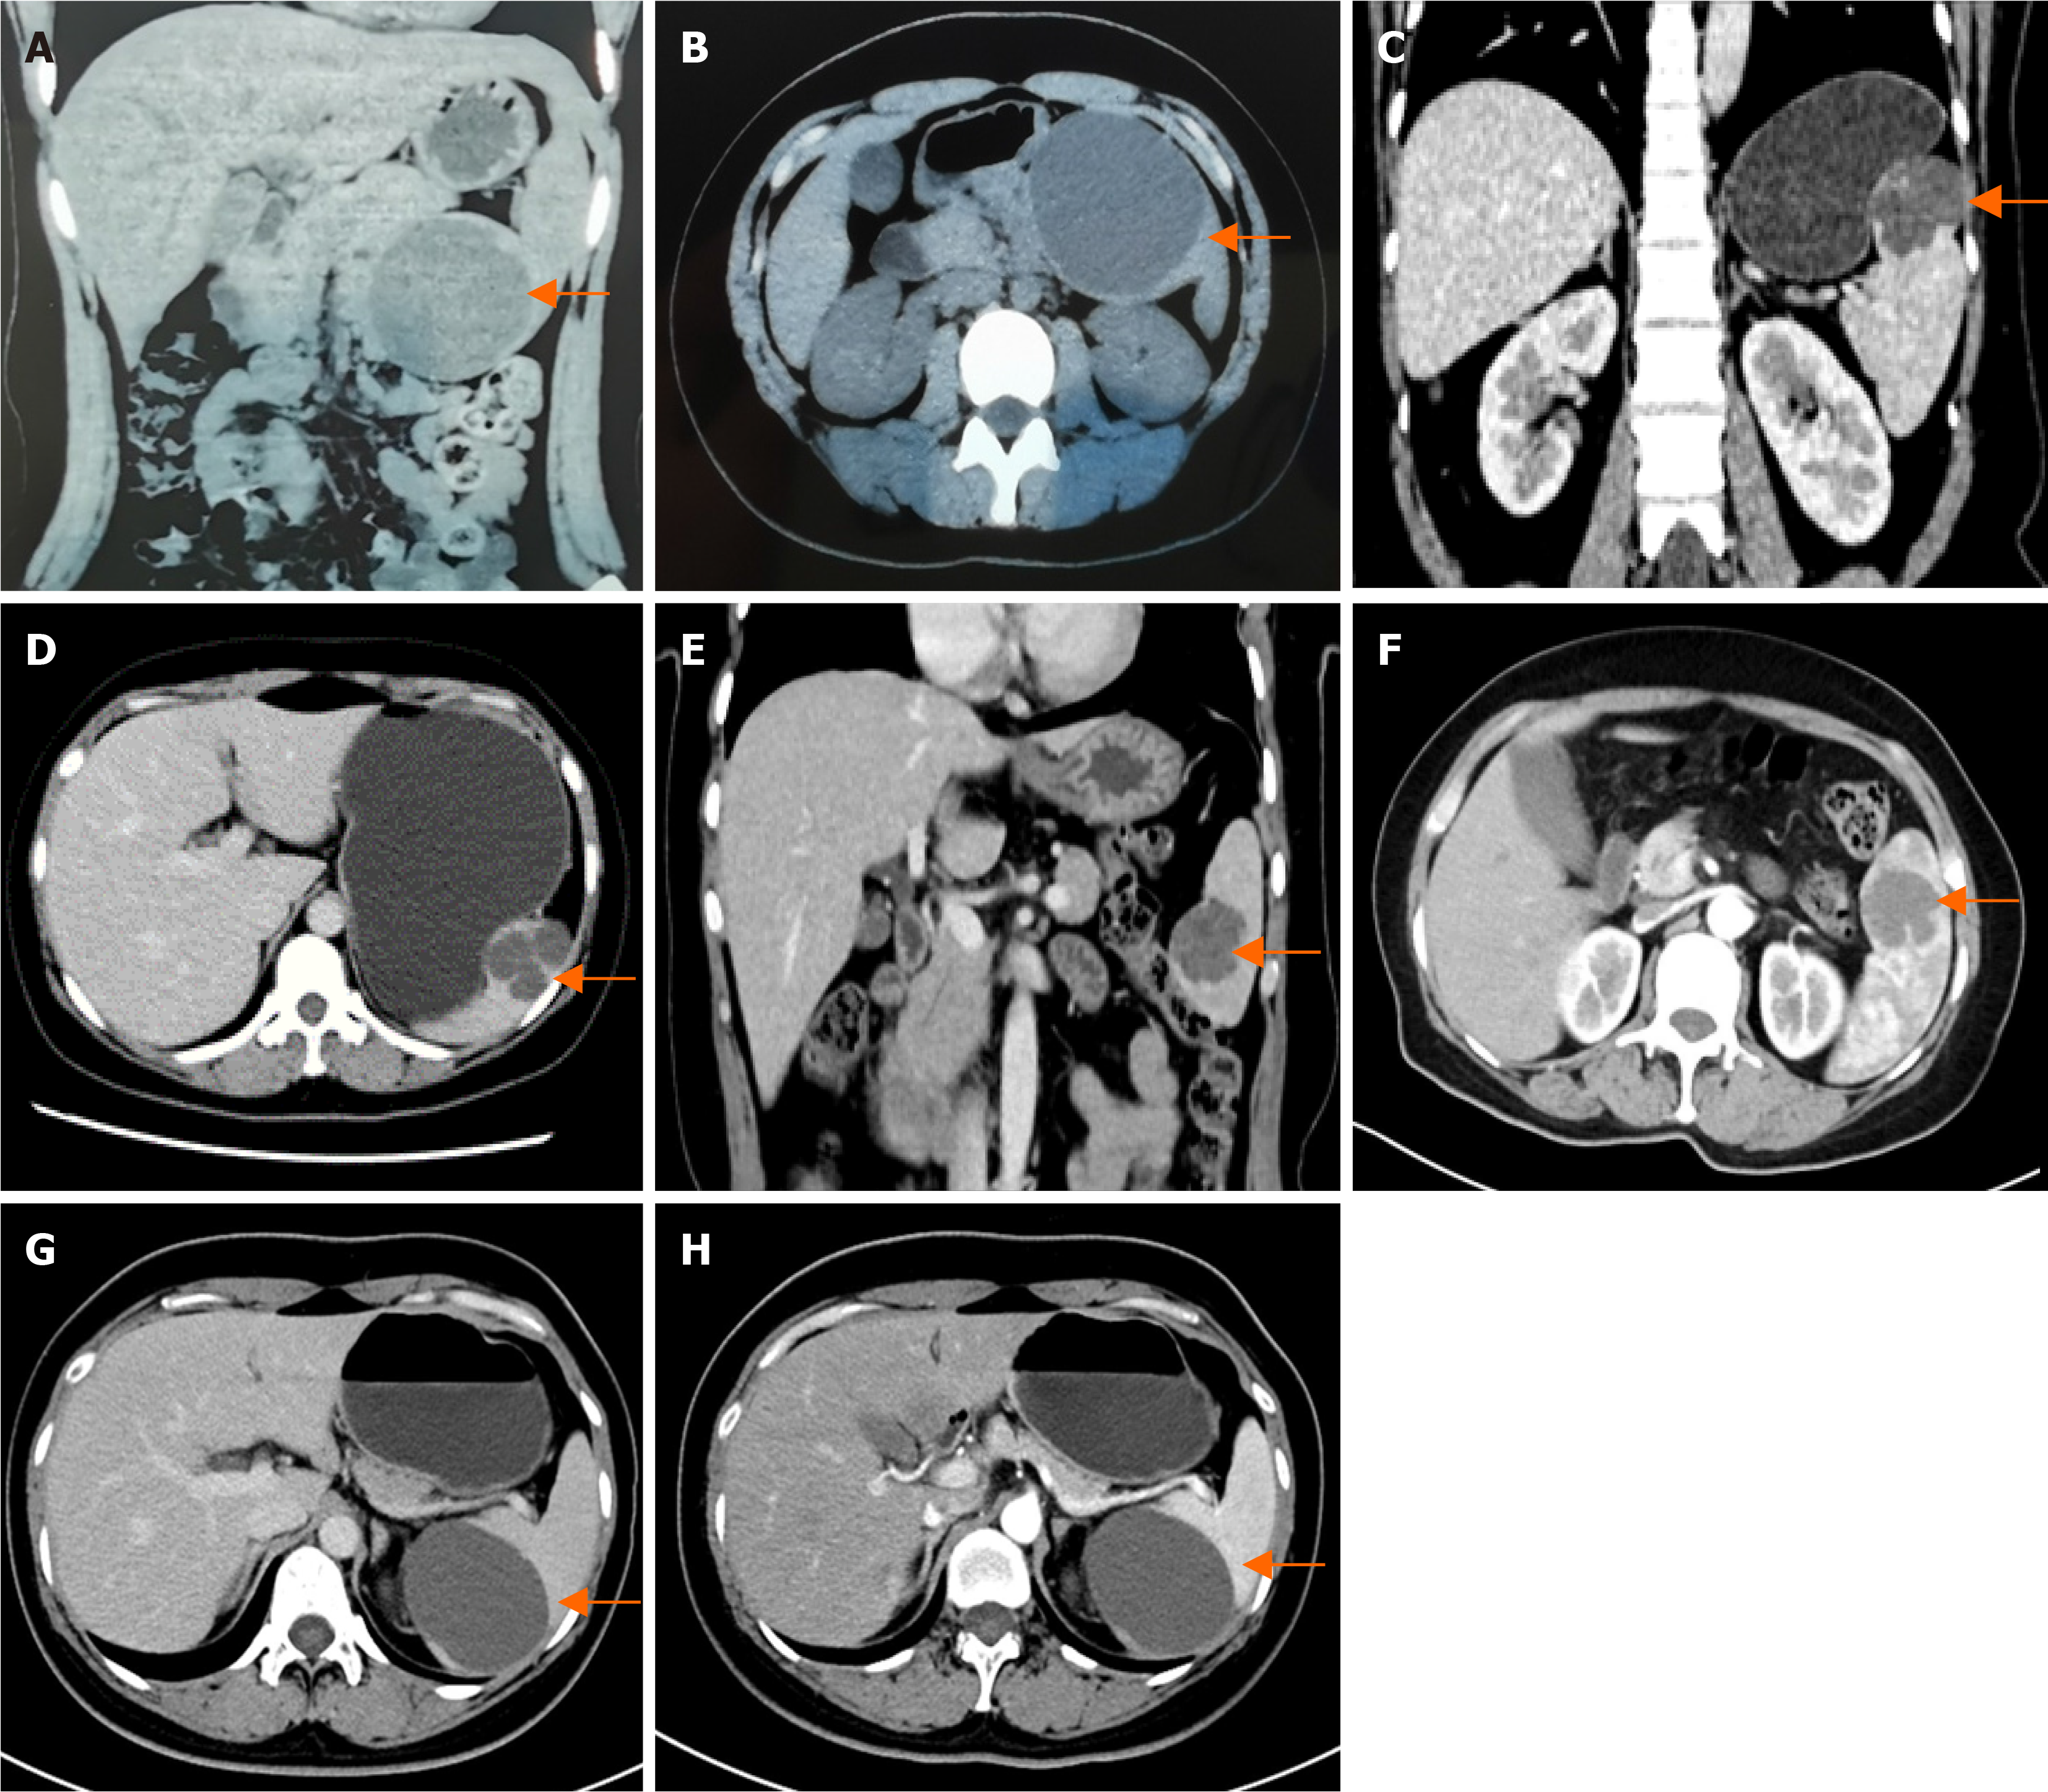
Figure 1 Imaging examinations of four patients.
A and B: Computed tomography (CT) revealed a round, non-enhancing low-density lesion measuring approximately 90 mm in the lower pole of the spleen (arrows), which was consistent with a splenic cyst; C and D: CT revealed multiple oval-shaped low-density lesions in the upper segment of the spleen (arrows), with the largest measuring approximately 52 mm; E and F: Magnetic resonance imaging revealed a 40 mm well-defined mass in the lower pole of the spleen (arrows), which appears as a low signal on T1 weight and a high signal on T2 weight; G and H: CT revealed a round, non-enhancing low-density lesion measuring approximately 73 mm in the lower pole of the spleen (arrows).
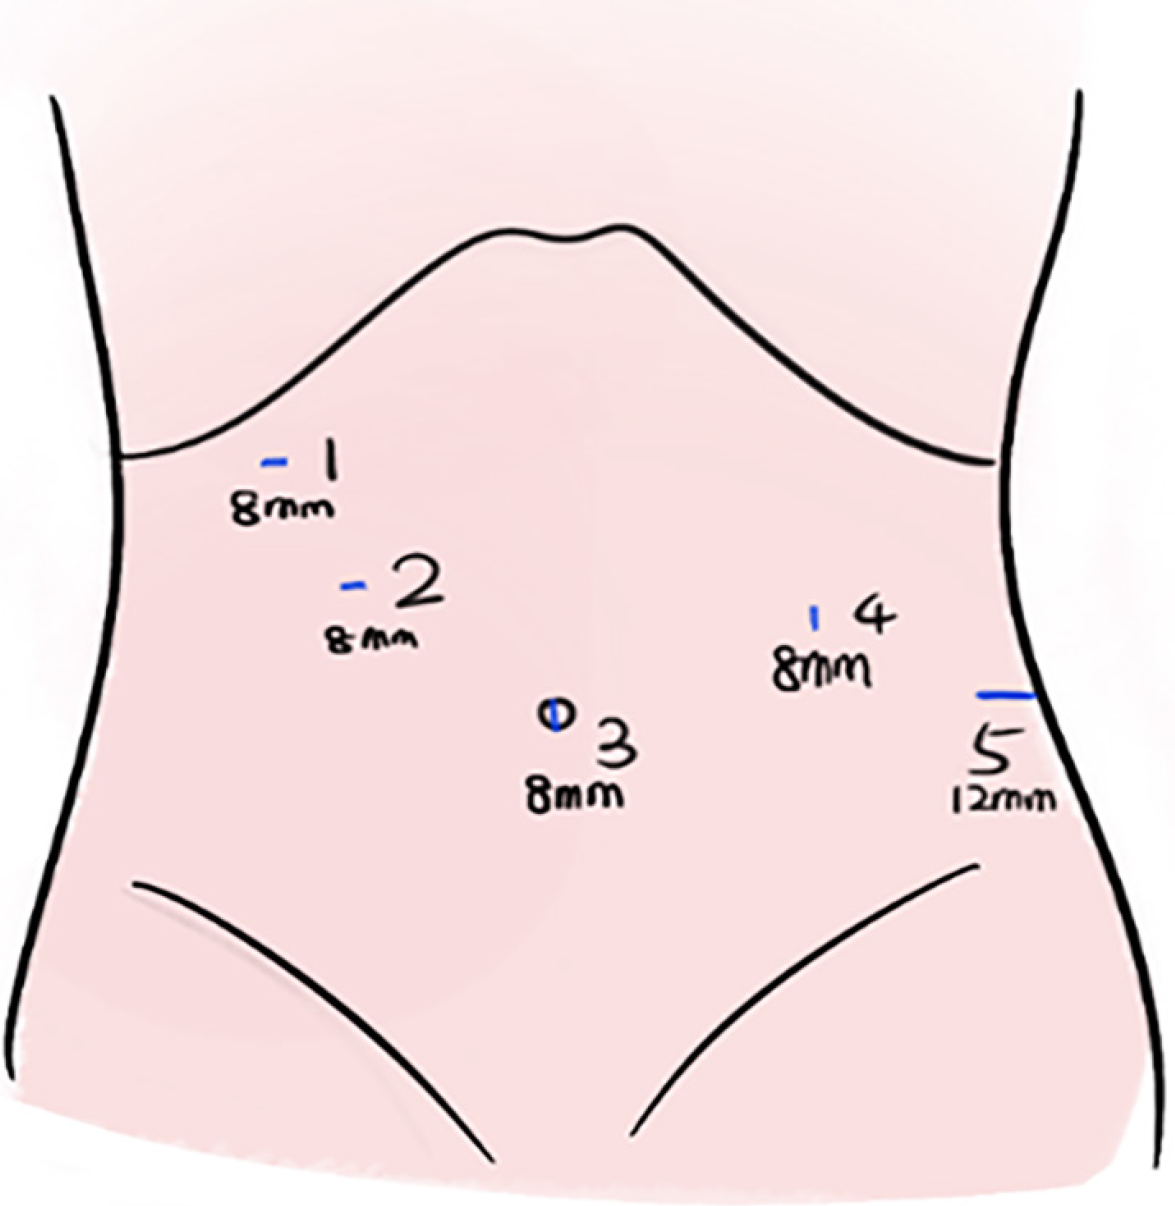
Figure 2 Schematic illustration of the port positions.
Port 1 is for the Cadiere forceps; Port 2 is for the Maryland bipolar forceps; Port 3 is for the laparoscope; Port 4 is for an ultrasonic scalpel or permanent cautery hook; and Port 5 is a port for assistance.
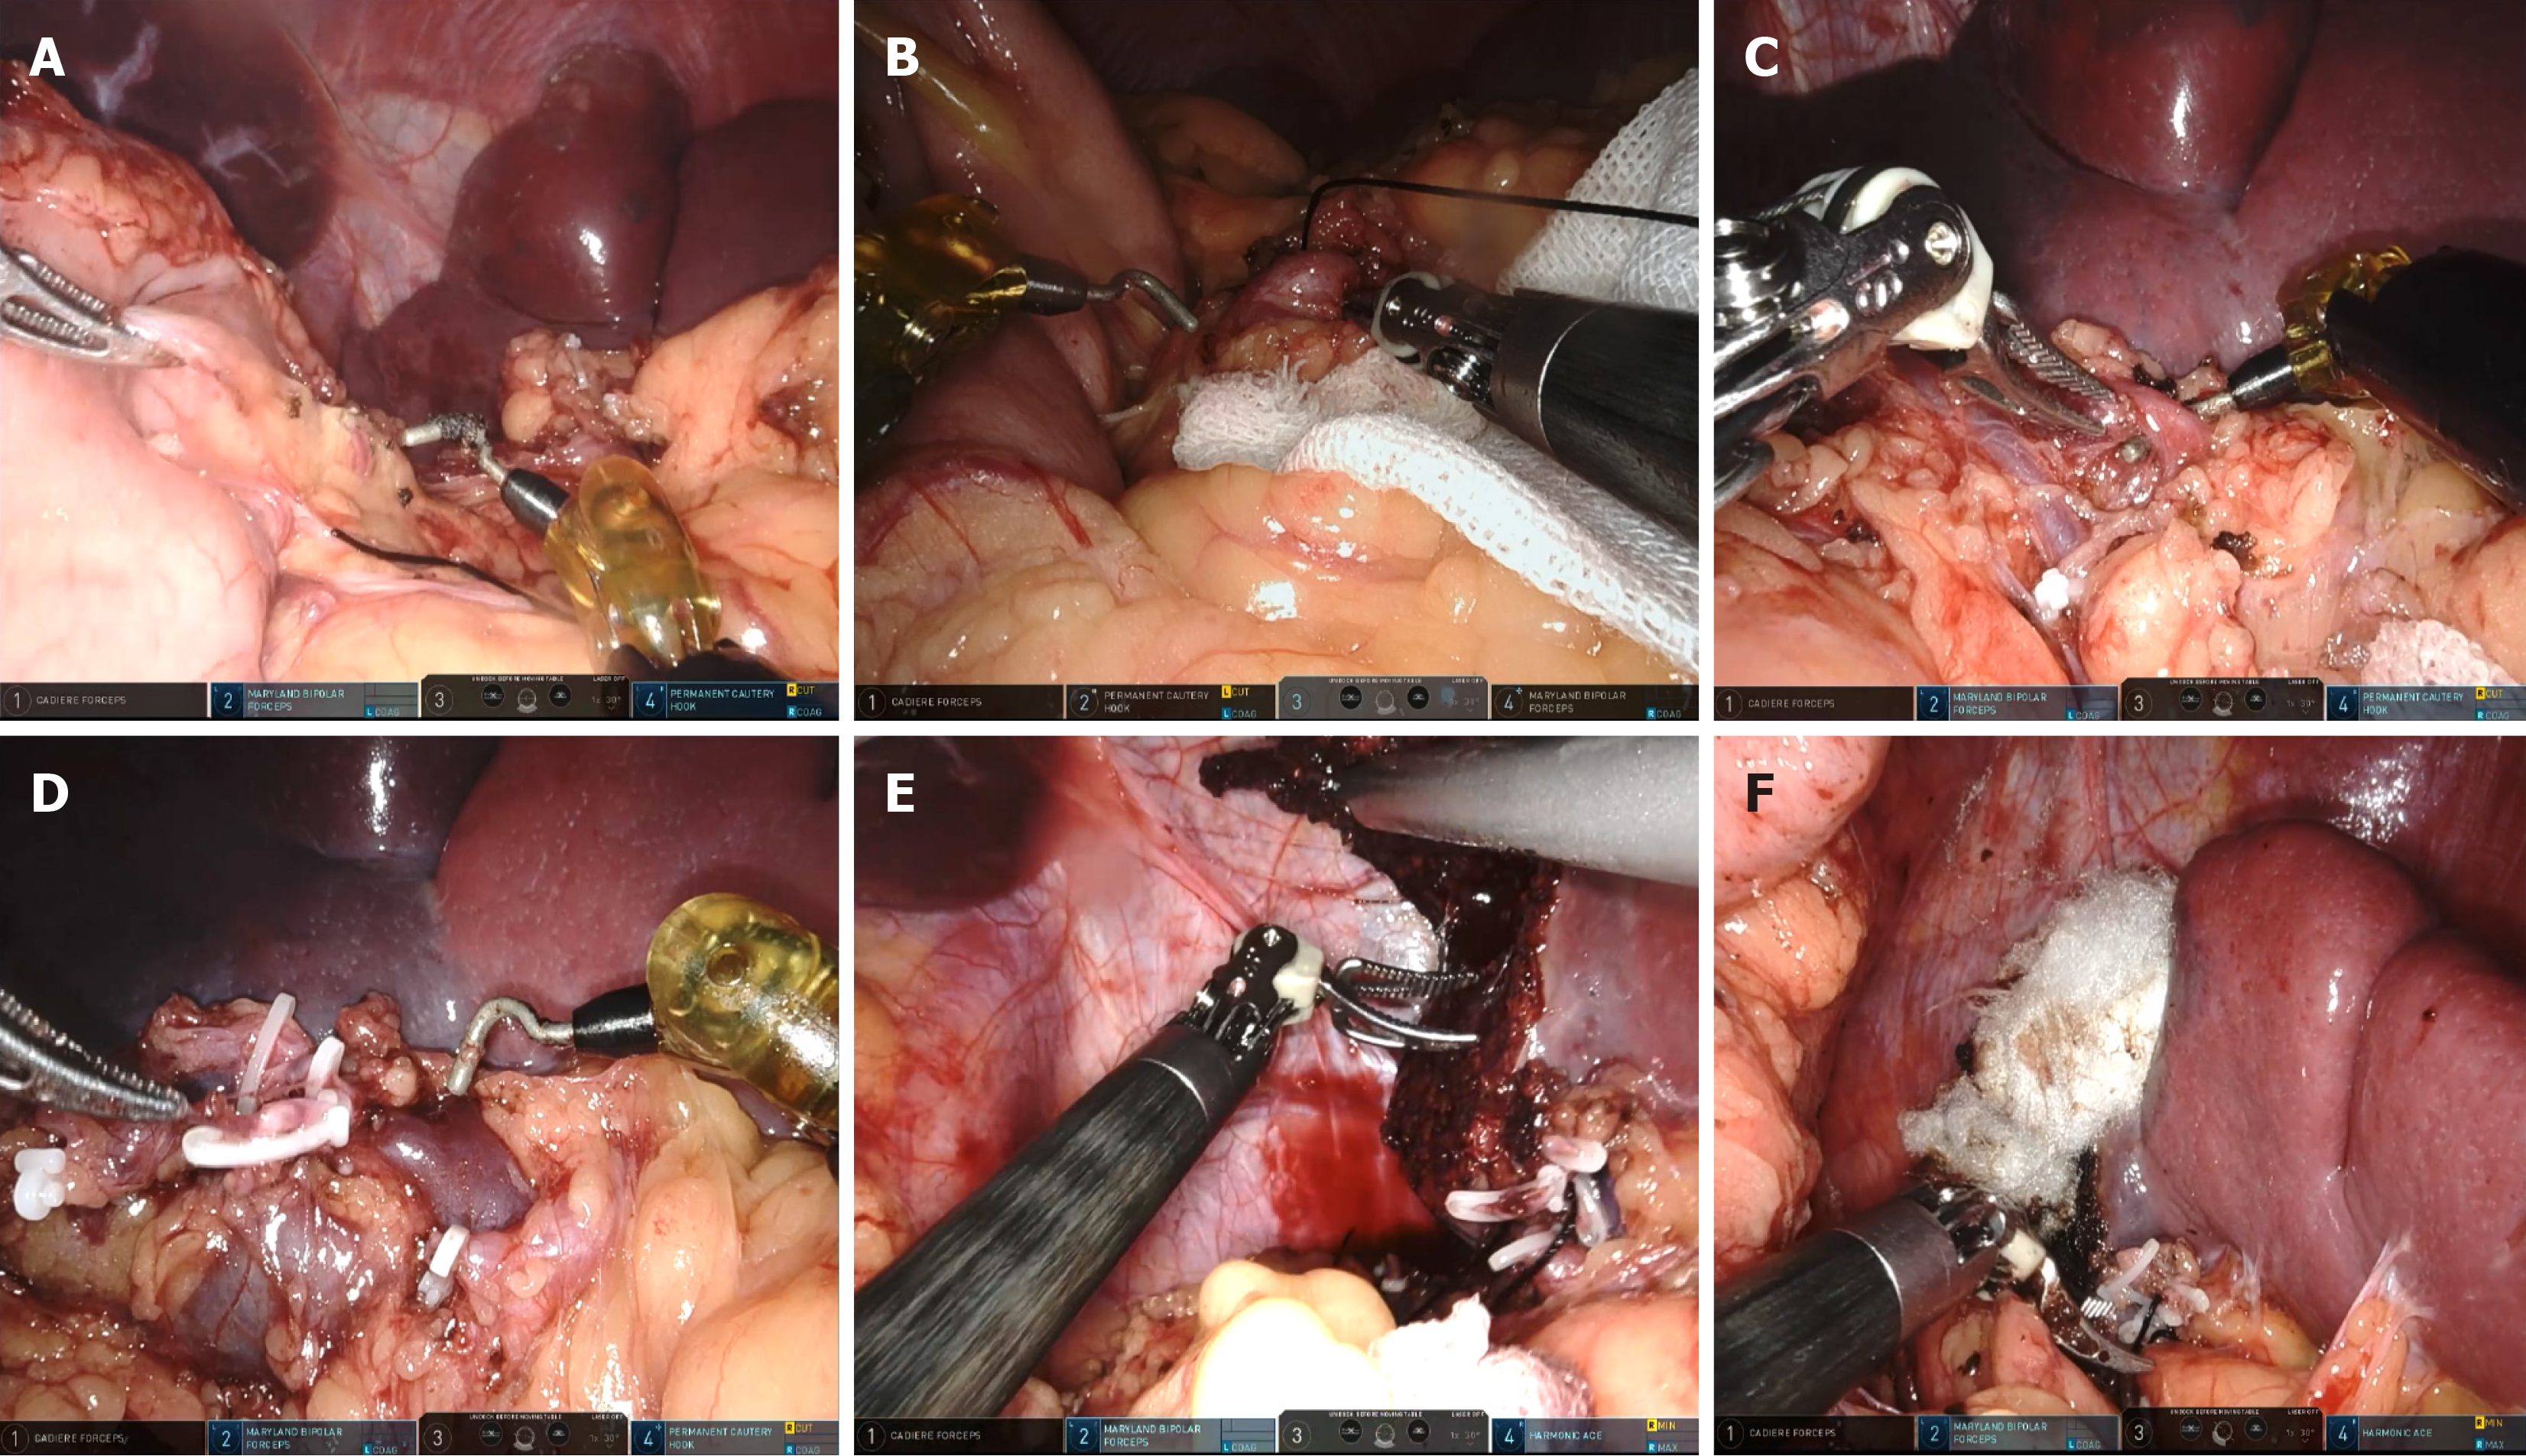
Figure 3 The detailed surgical procedure of robotic-assisted partial splenectomy.
A: The gastrocolic ligament was incised to expose the pancreas and spleen; B: The splenic artery was slung with nylon tape; C and D: The splenic hilum was exposed, and the segment vessels of the pre-resected segment were cut; E: Bleeding points on the cut surface were cauterized using a permanent cautery hook; F: Hemostatic gauze was used on the splenic edge.
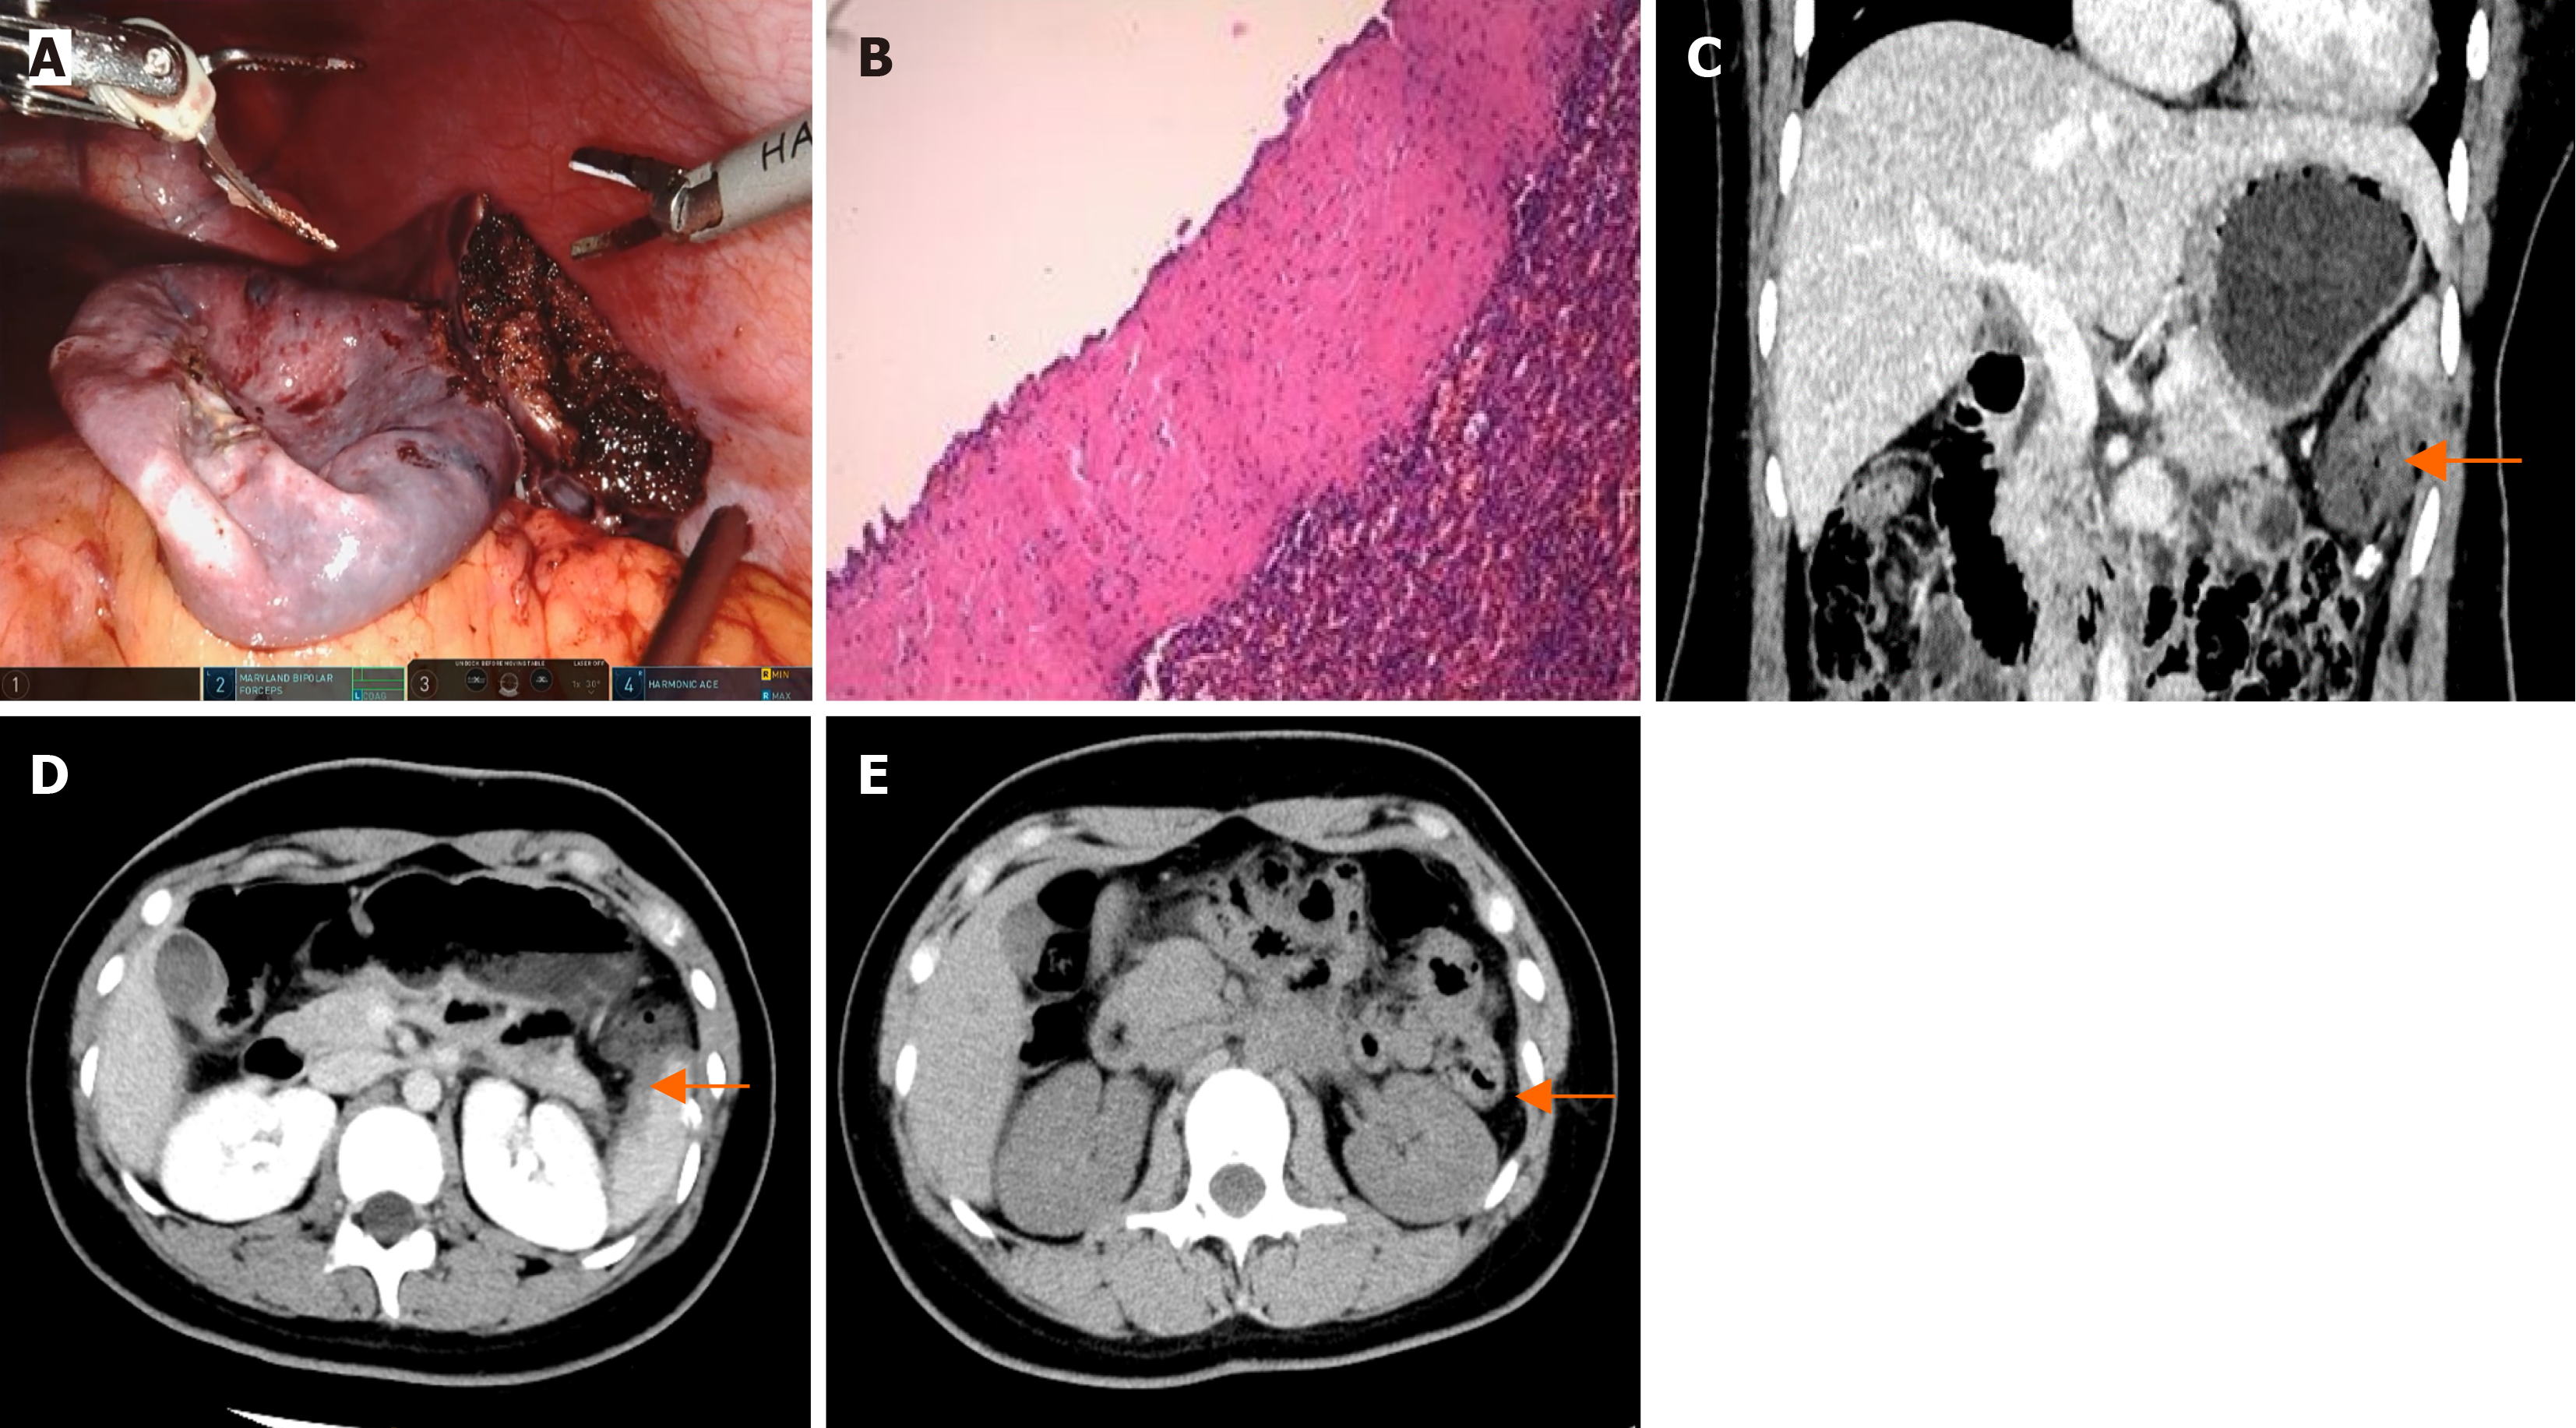
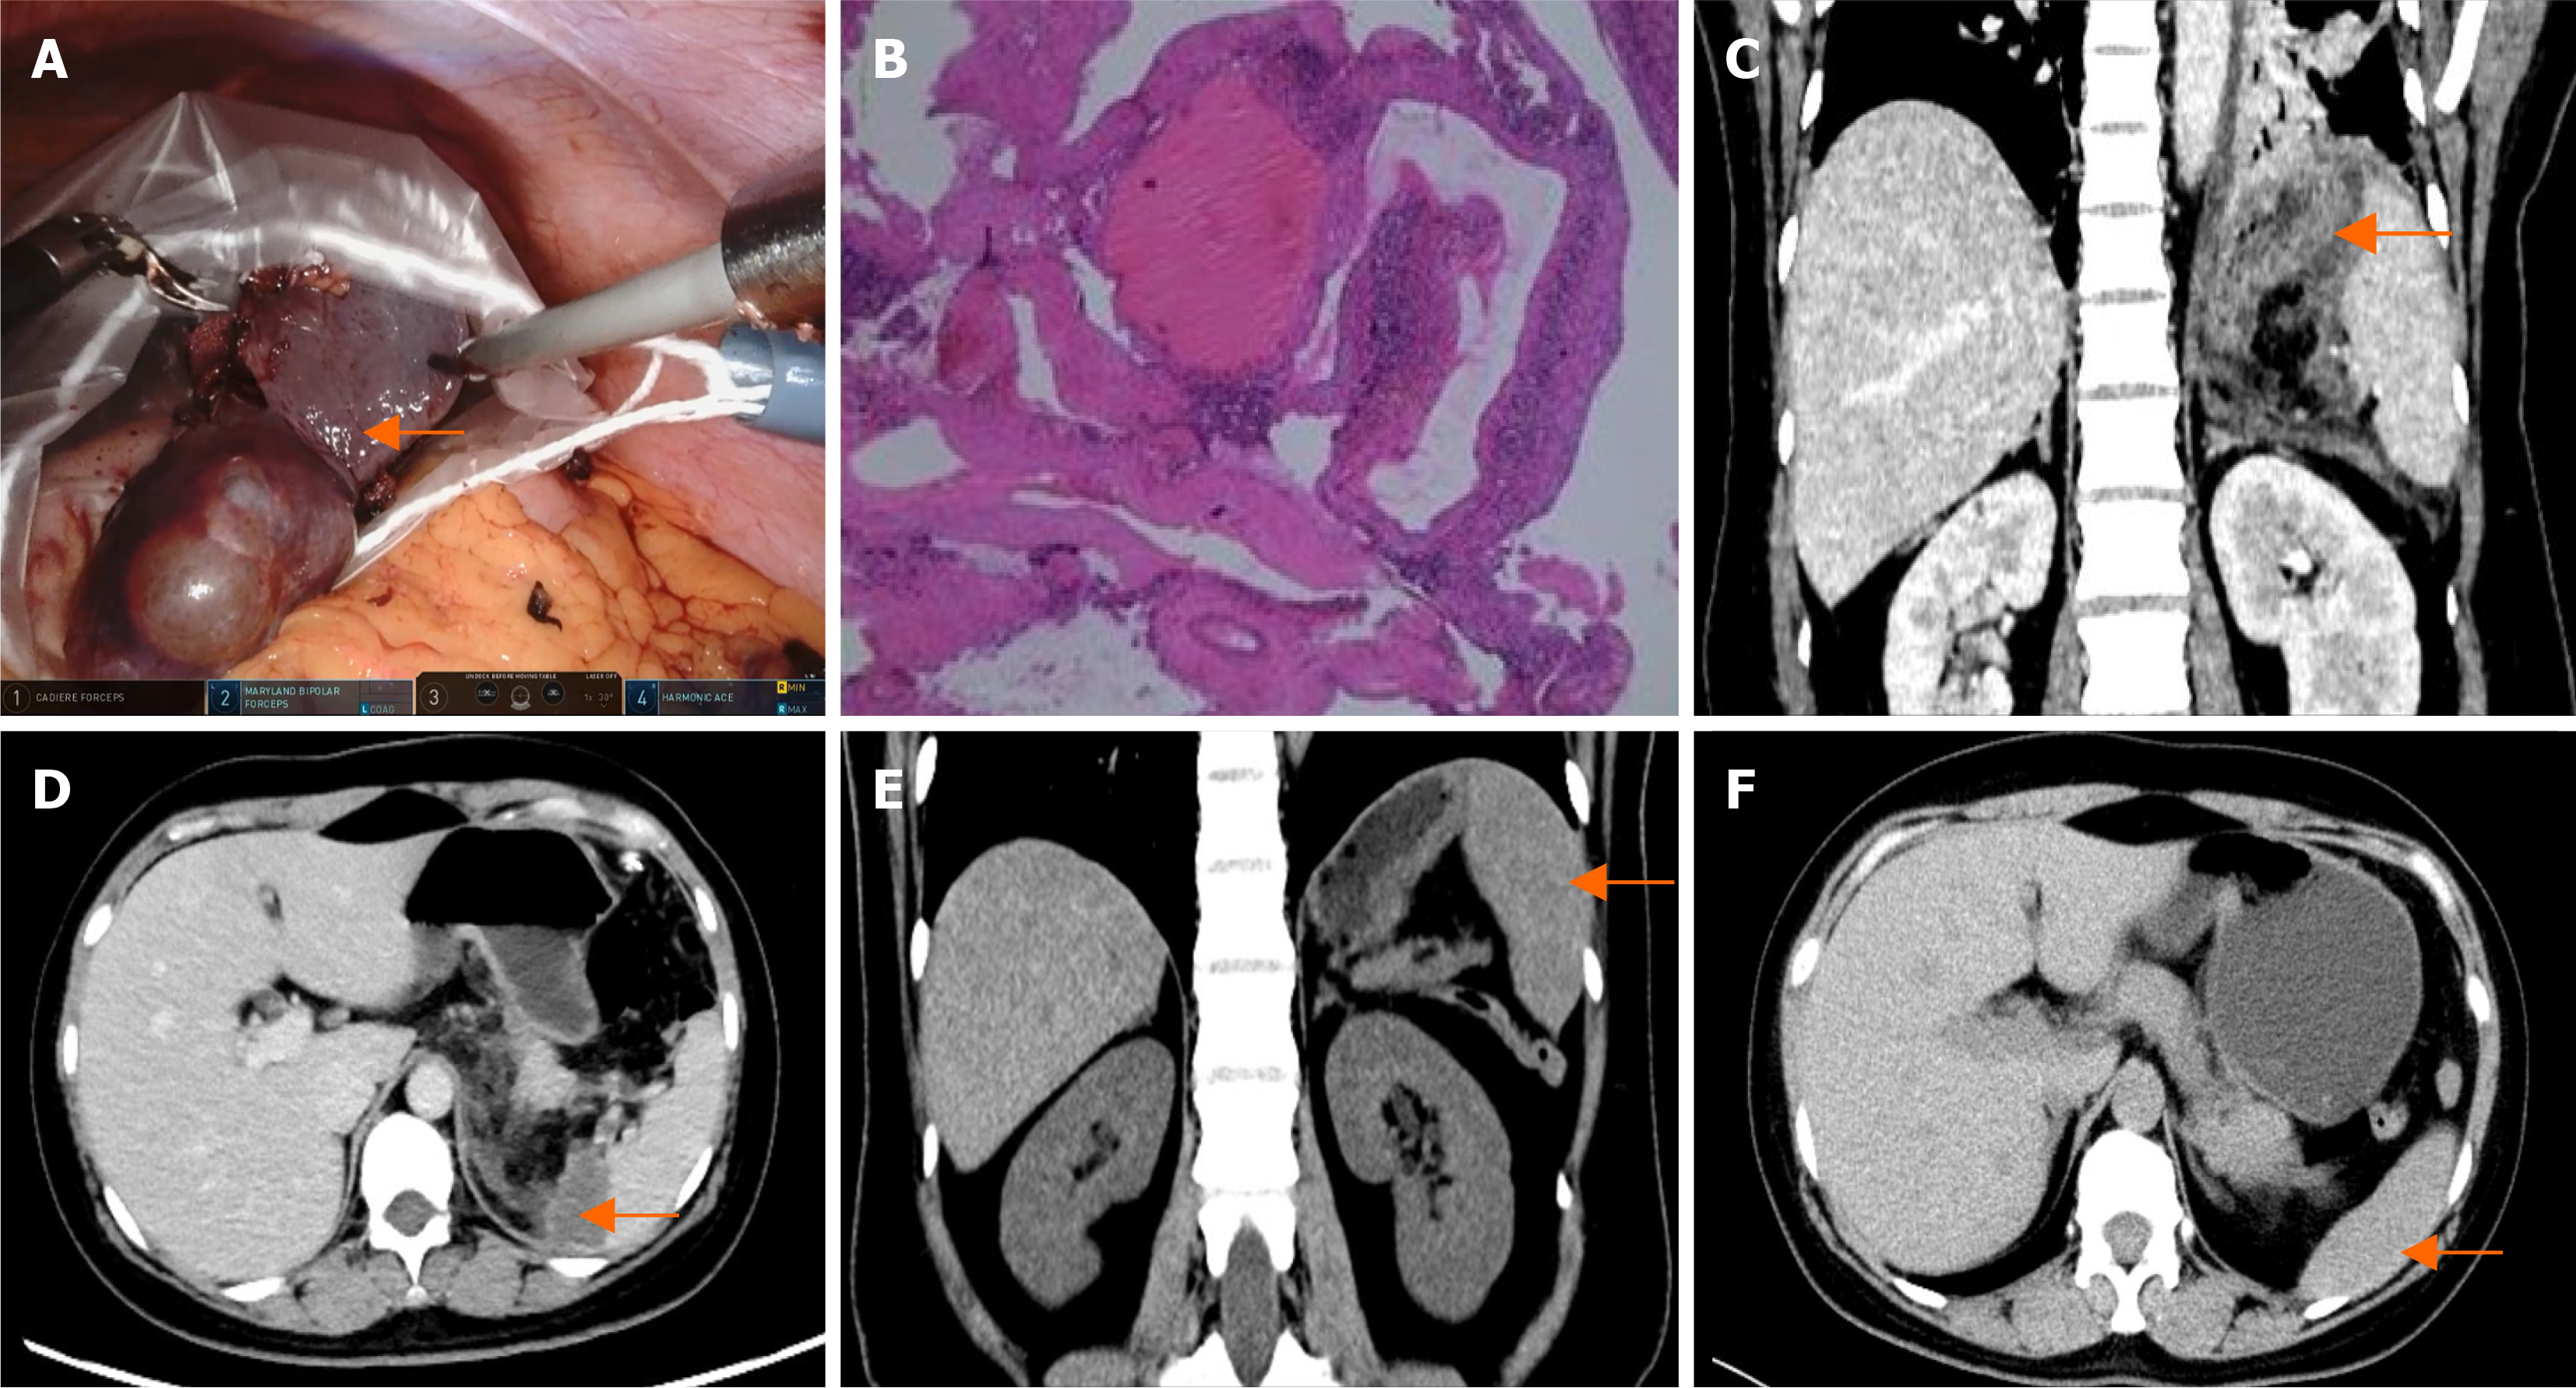
Figure 4 The patient 1's pathology result and postoperative computed tomography images.
A: Resected specimen from patient 1. The contents of the cyst had already leaked out; B: Histopathological analysis and immunohistochemical examination of the resected specimen: Primary splenic cyst; C and D: Computed tomography (CT) images of patient 1 on the third day after surgery. There was some effusion around the spleen (arrows); E: A follow-up CT scan of patient 1 at six months post-surgery revealed that there was no tumor in the spleen.
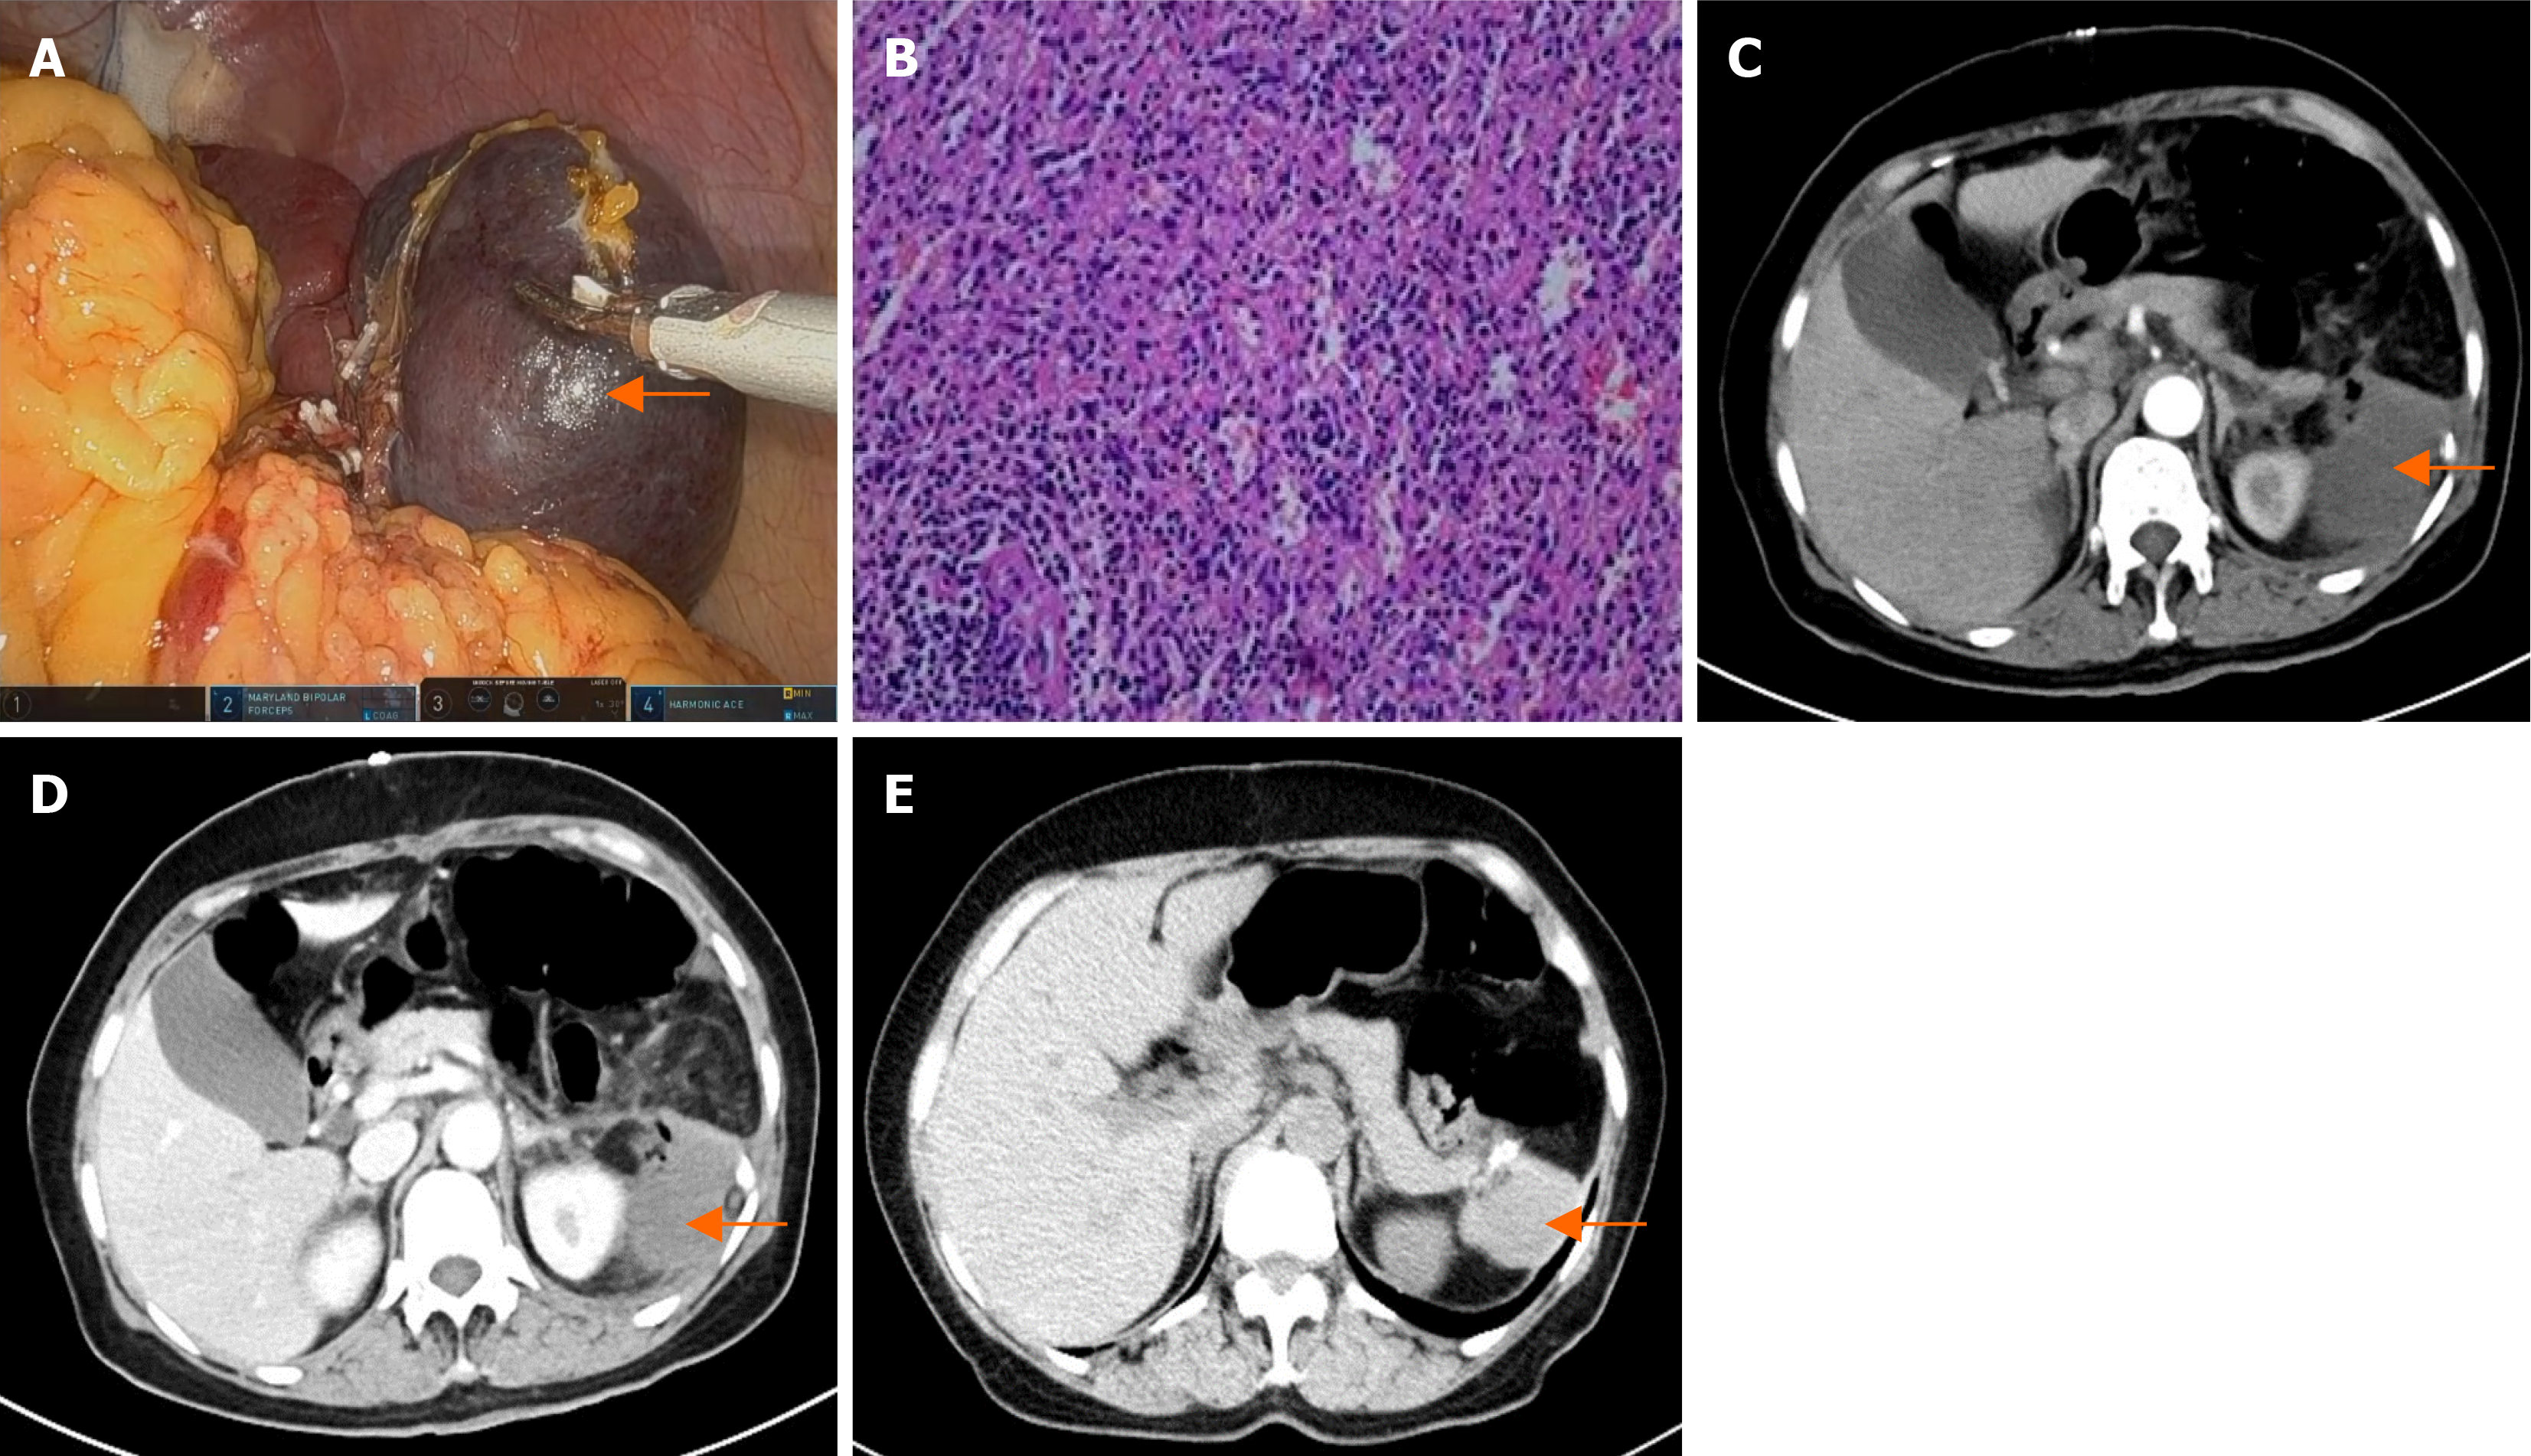
Figure 5 The patient 2's pathology result and postoperative computed tomography images.
A: Resected specimen from patient 2; B: Histopathological analysis and immunohistochemical examination of the resected specimen: Splenic hemangiomas; C and D: Computed tomography (CT) images of patient 2 on the third day after surgery. There was some effusion above the spleen (arrows); E and F: A follow-up CT scan of patient 2 at six months post-surgery indicated that there were no tumors in the spleen (arrows).
Figure 6 The patient 3's pathology result and postoperative computed tomography images.
A: Resected specimen from patient 3; B: Histopathological analysis and immunohistochemical examination of the resected specimen: Splenic hemangiomas; C and D: Computed tomography (CT) images of patient 3 on the third day after surgery. There was some effusion above the spleen (arrows); E and F: A follow-up CT scan of patient 3 at six months post-surgery indicated that there was no tumor in the spleen (arrows).
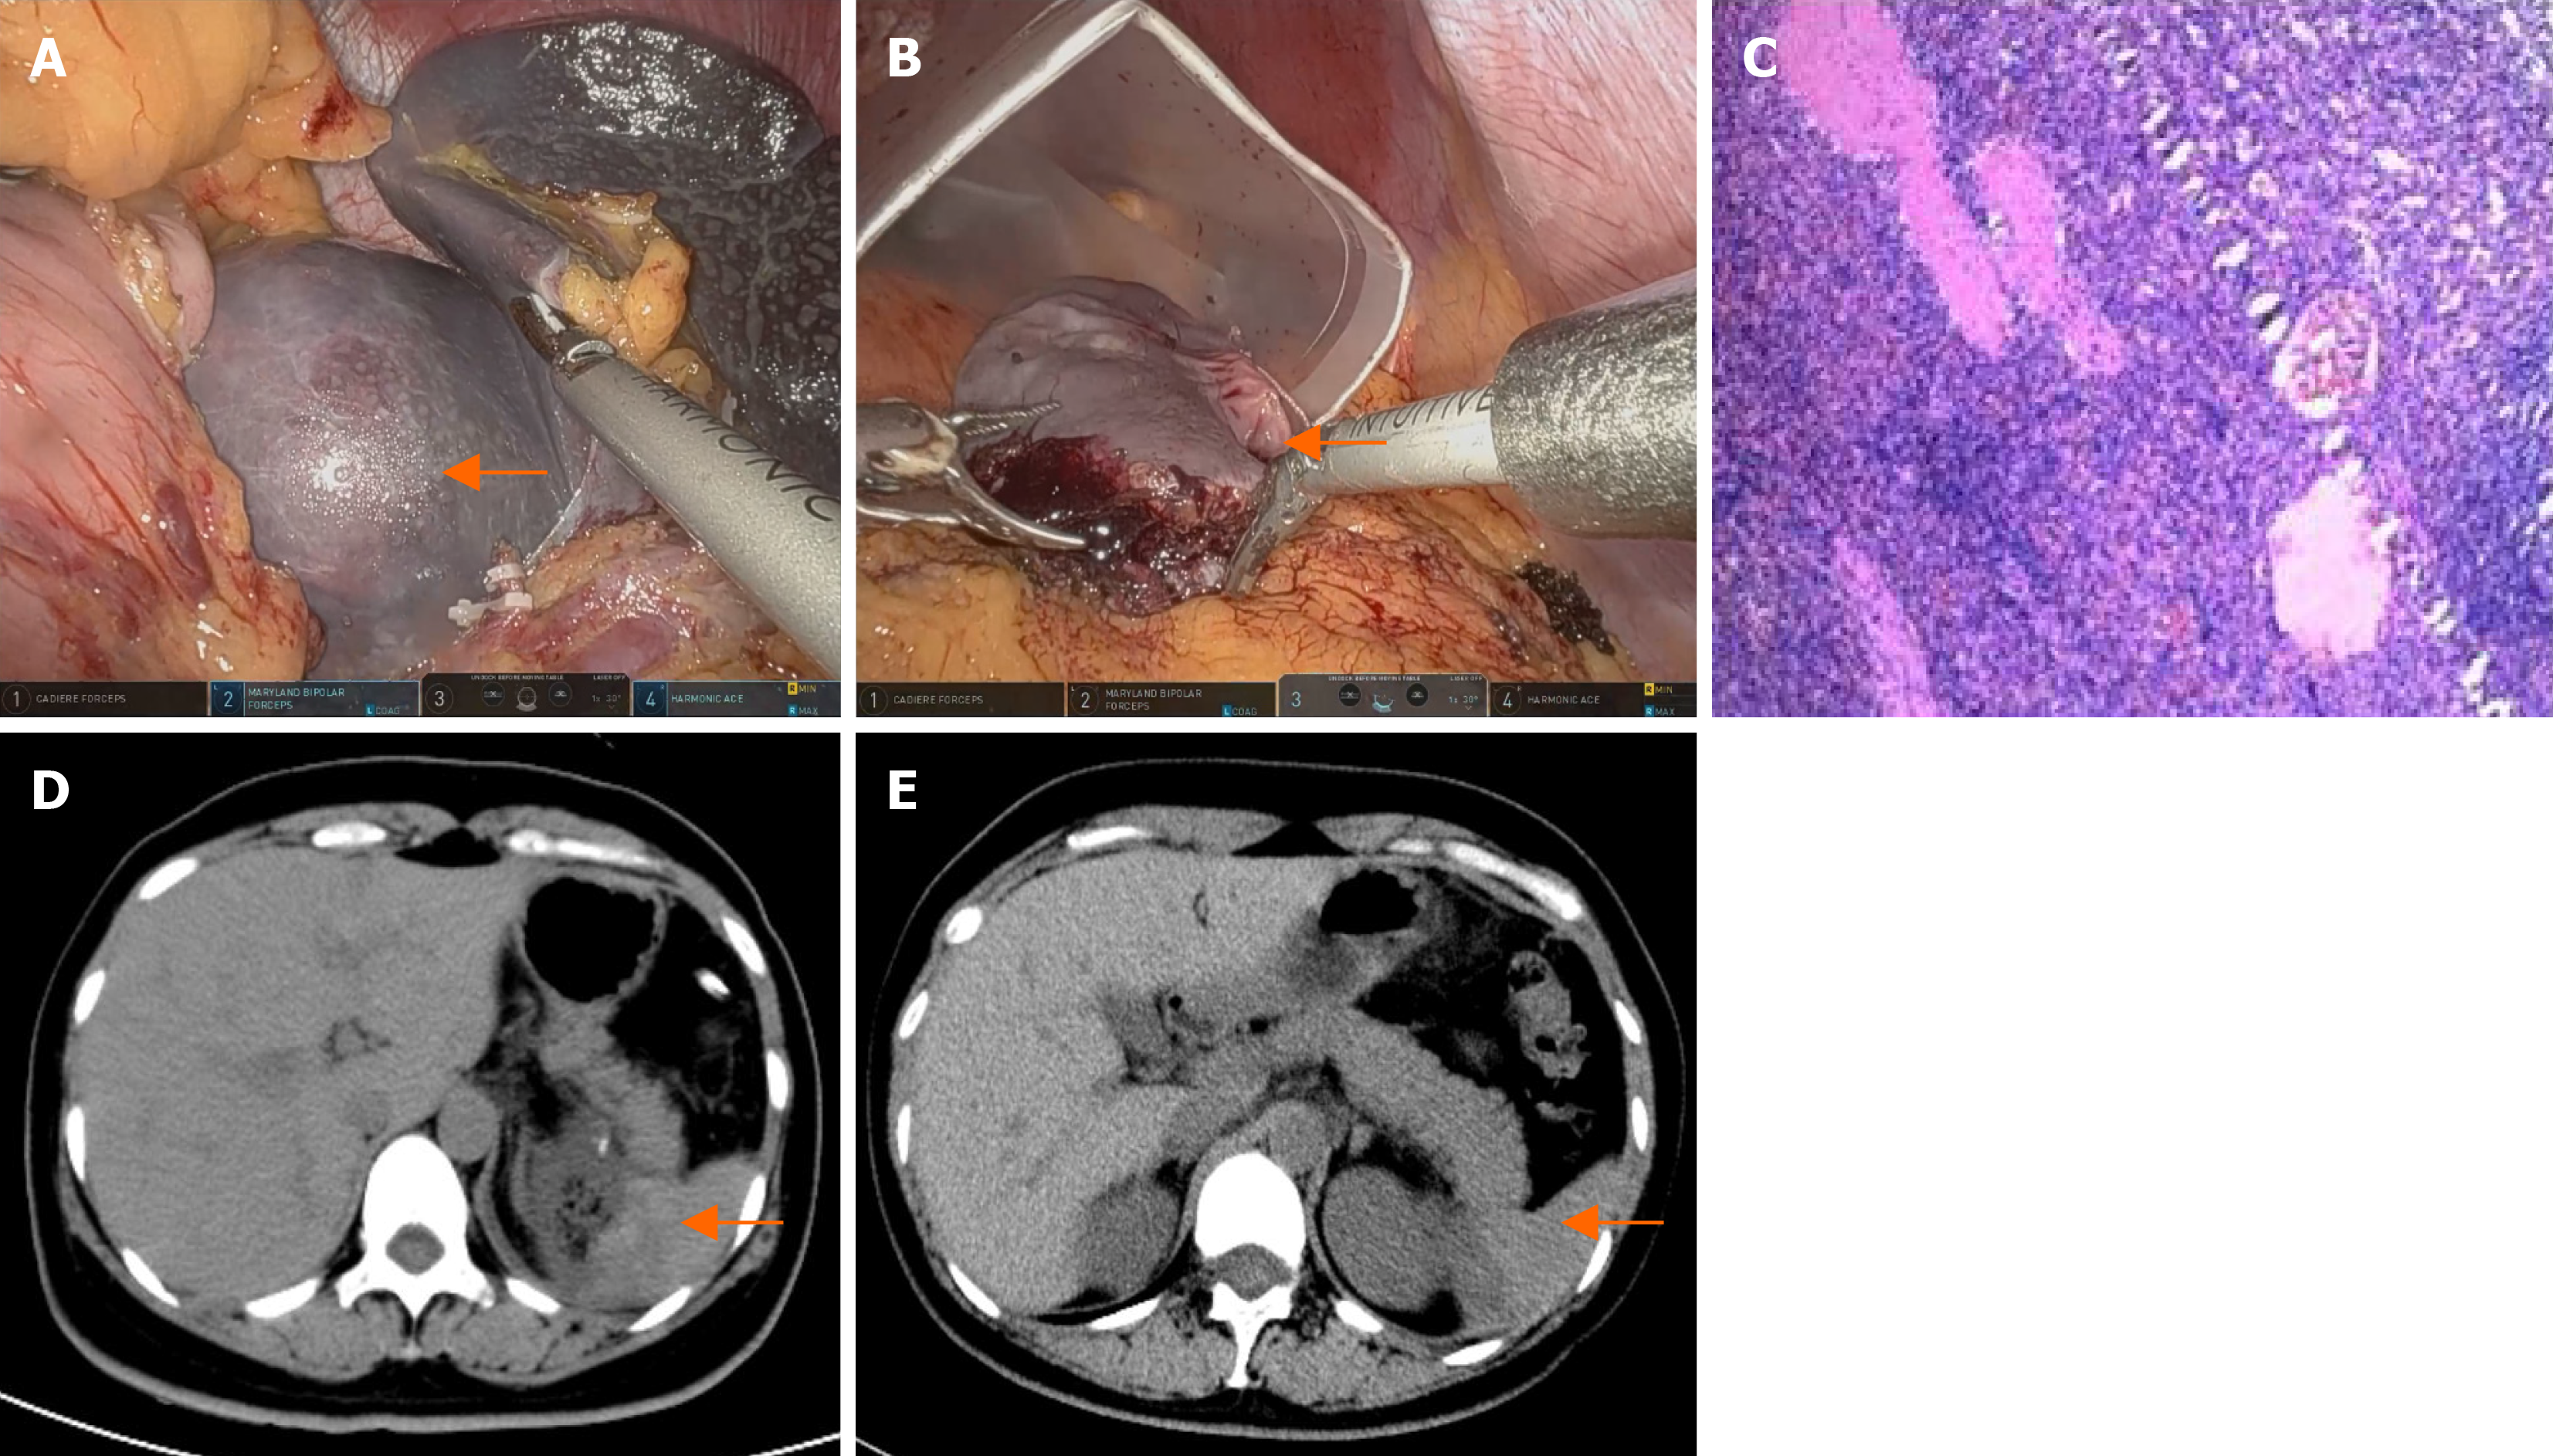
Figure 7 The patient 4's pathology result and postoperative computed tomography images.
A and B: Resected specimen from patient 4; C: Histopathological analysis and immunohistochemical examination of the resected specimen: Splenic cyst; D: Computed tomography (CT) images of patient 4 on the third day after surgery. There was some effusion above the spleen (arrows); E: A follow-up CT scan of patient 4 at six months post-surgery indicated that there was no tumor in the spleen (arrows).
- Citation: Xue HM, Chen P, Zhu XJ, Jiao JY, Wang P. Robot-assisted partial splenectomy for benign splenic tumors: Four case reports. World J Clin Oncol 2024; 15(10): 1366-1375
- URL: https://www.wjgnet.com/2218-4333/full/v15/i10/1366.htm
- DOI: https://dx.doi.org/10.5306/wjco.v15.i10.1366


