Copyright
©The Author(s) 2024.
World J Clin Oncol. Oct 24, 2024; 15(10): 1324-1332
Published online Oct 24, 2024. doi: 10.5306/wjco.v15.i10.1324
Published online Oct 24, 2024. doi: 10.5306/wjco.v15.i10.1324
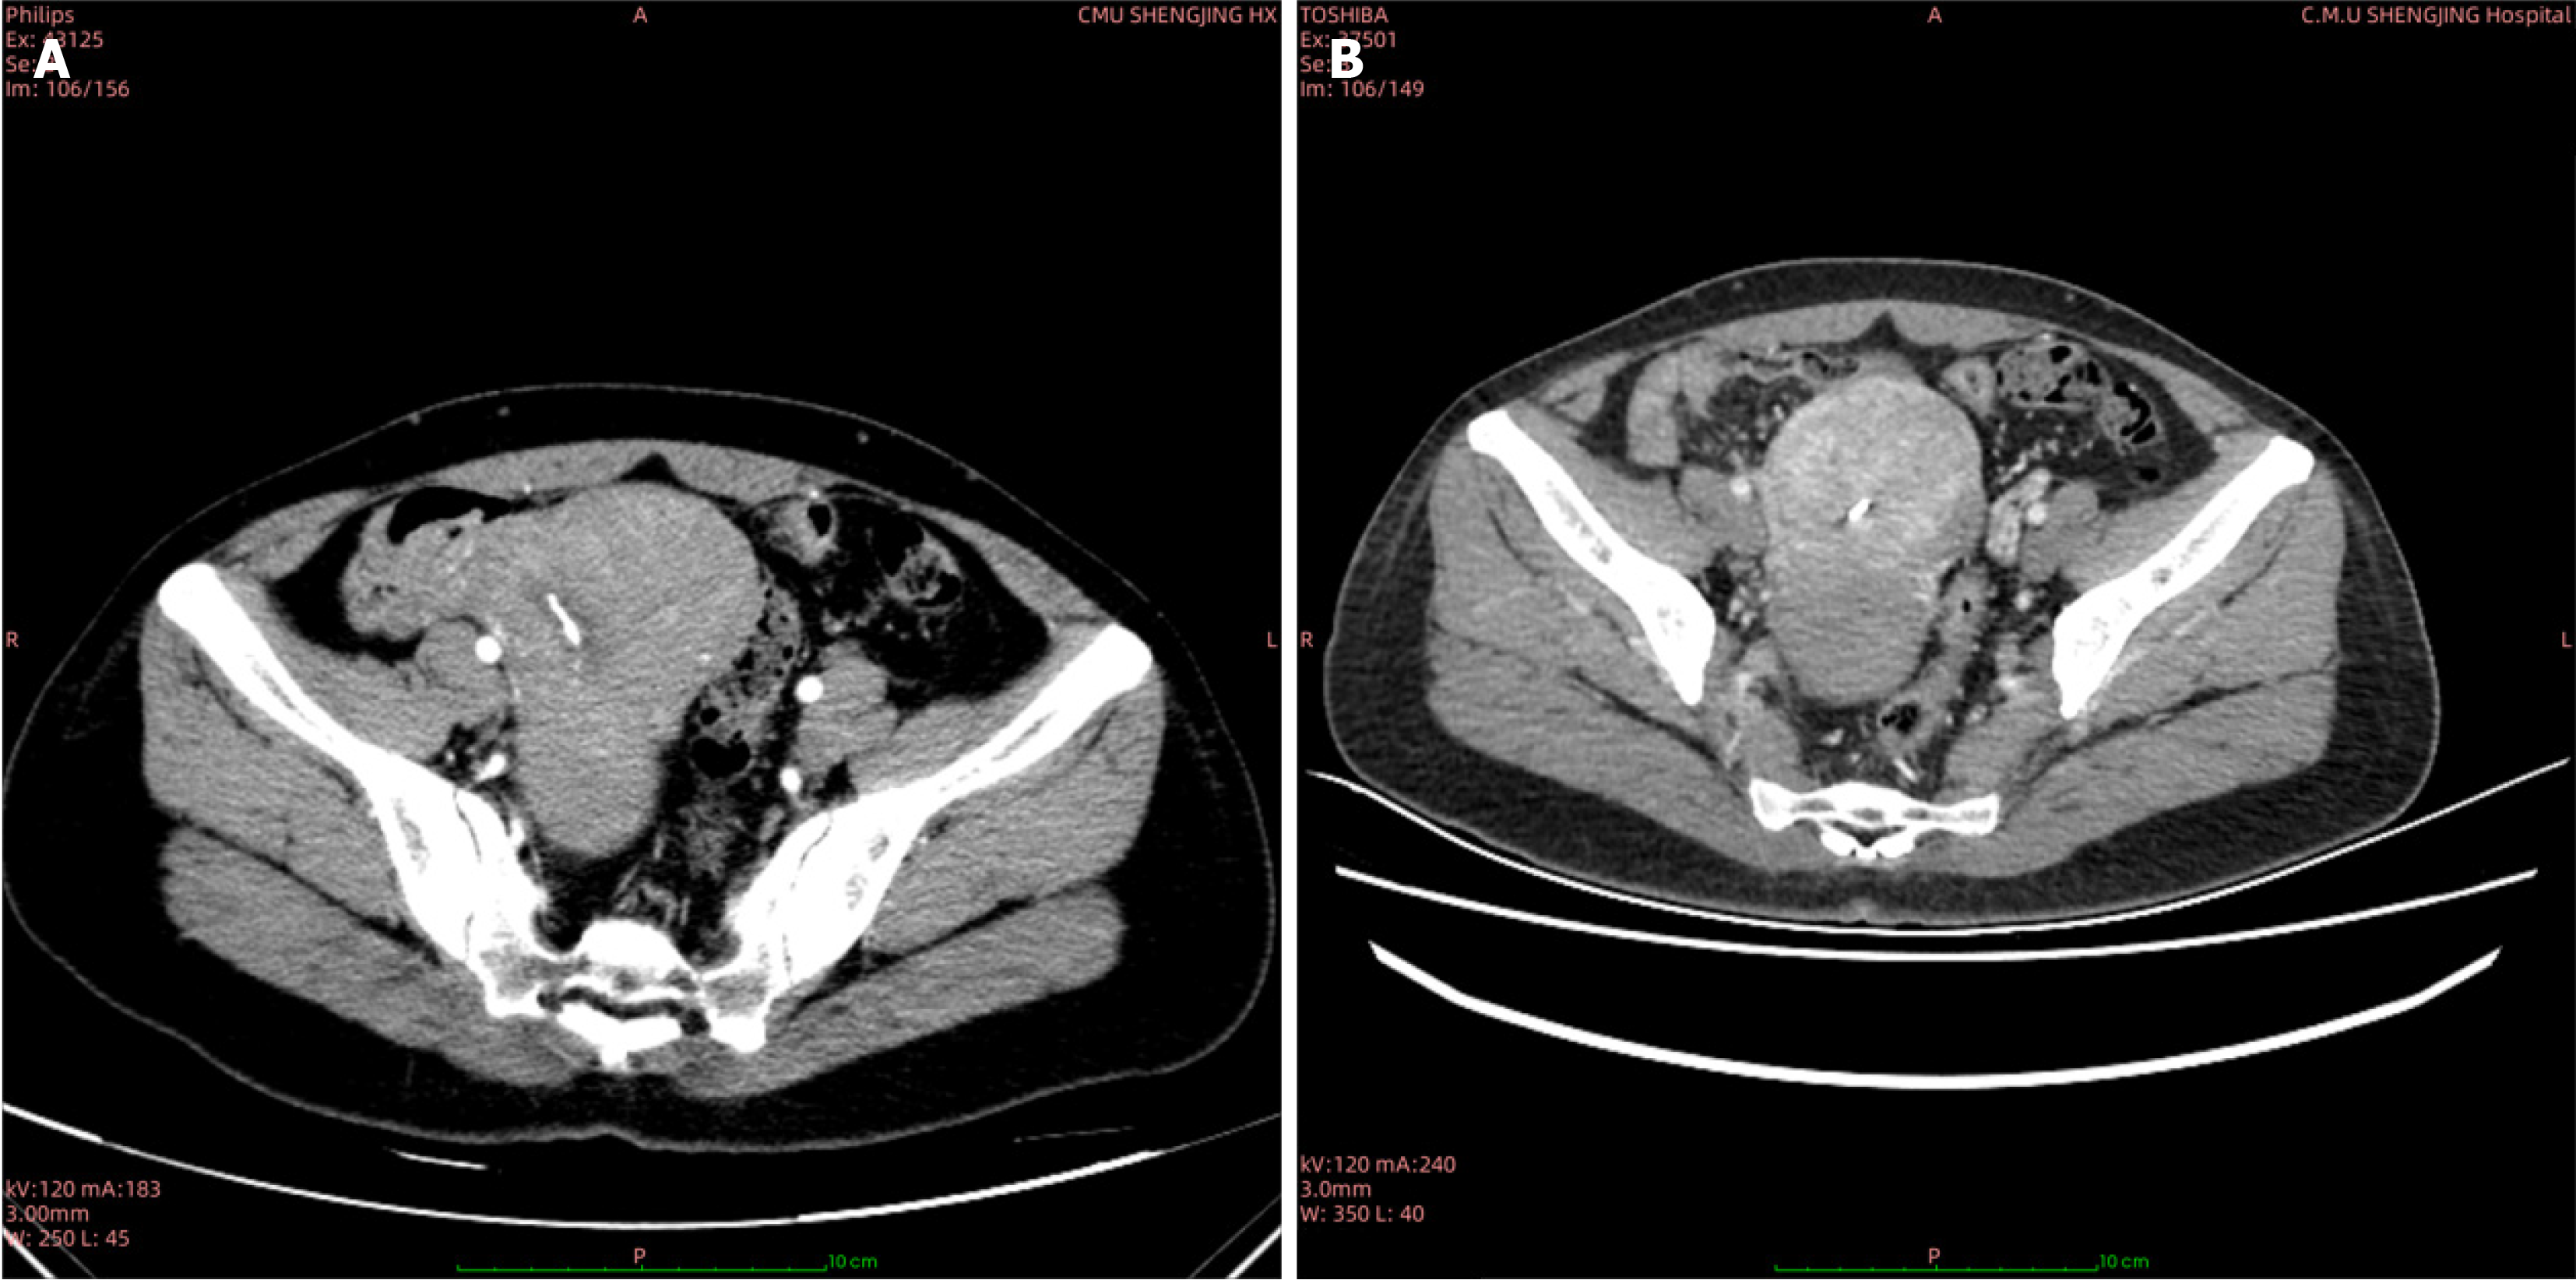
Figure 1 Computed tomography imaging.
A: Computed tomography (CT) image prior to treatment; B: CT image following initial chemotherapy session, showing a reduction in the lesions.
Figure 2 Pathological examination microscopy images revealed medium-sized tumor cells with irregular nuclei and frequent mitotic figures.
A: Hematoxylin-eosin staining at × 200 magnification; B: Hematoxylin-eosin staining at × 400 magnification.
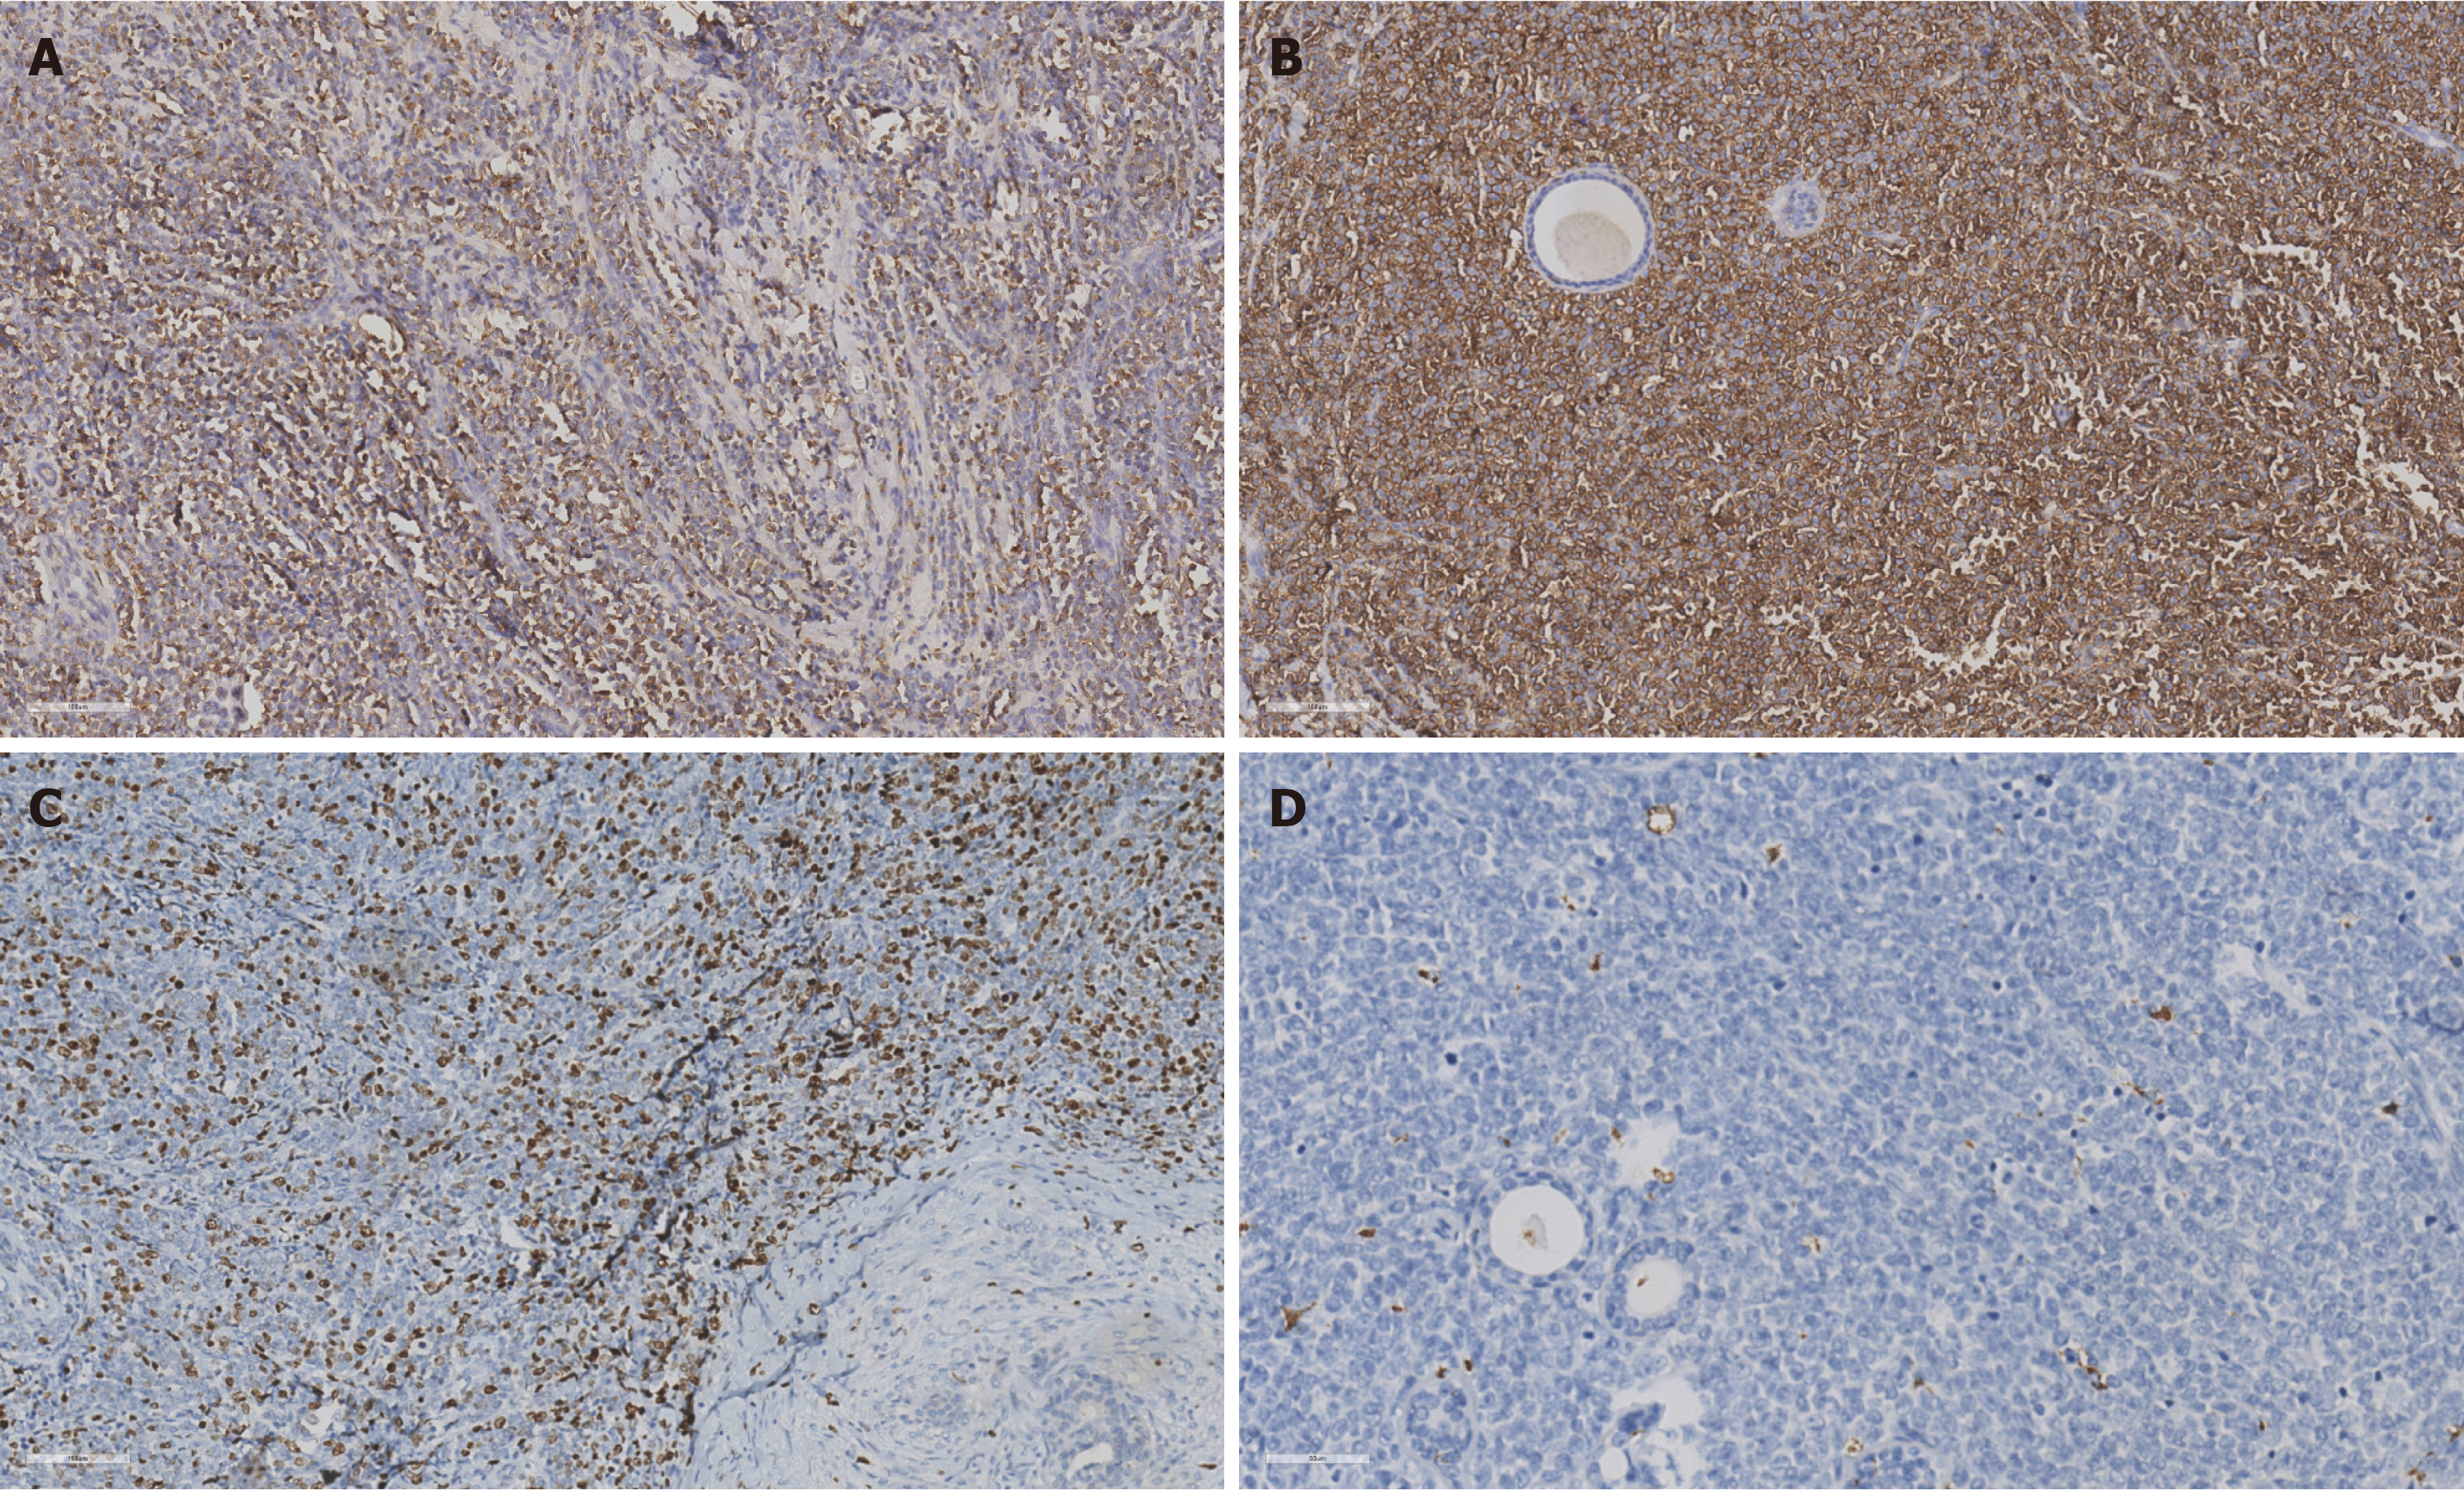
Figure 3 Immunohistochemical staining of cervical myeloid sarcoma.
A: Myeloperoxidase (70% +); B: Cluster of differentiation (CD) 43 (100% +); C: Ki-67 (50% +); D: CD34 (-).
- Citation: Li JK, Wang XX, Fu JJ, Zhang DD. Cervical myeloid sarcoma as an initial clinical manifestation: Four case reports. World J Clin Oncol 2024; 15(10): 1324-1332
- URL: https://www.wjgnet.com/2218-4333/full/v15/i10/1324.htm
- DOI: https://dx.doi.org/10.5306/wjco.v15.i10.1324


