Copyright
©The Author(s) 2024.
World J Clin Oncol. Jan 24, 2024; 15(1): 89-114
Published online Jan 24, 2024. doi: 10.5306/wjco.v15.i1.89
Published online Jan 24, 2024. doi: 10.5306/wjco.v15.i1.89
Figure 1 Prognostic features of disulfidaptosis-related lncRNAs in colorectal cancer.
A: Sankey diagram showing the relationship between disulfidaptosis-related genes and disulfidaptosis-related lncRNAs (DRLs); B: Forest plot of prognostic genes associated with DRLs; C: The least absolute shrinkage and selection operator (LASSO) coefficients of DRLs obtained via LASSO analysis; D: Cross-validation of DRLs in LASSO regression; E: Multivariable Cox regression analysis and correlation between disulfidaptosis genes and DRLs. aP < 0.05; bP < 0.01; cP < 0.001.
Figure 2 Establishment of a risk prediction model for predicting overall survival in colorectal cancer patients.
A-C: Distribution of patients in the training, testing, and combined sets with increasing risk scores; D-F: Survival time and risk scores of patients in the three groups; G-I: Risk score heatmaps for eight key disulfidaptosis-related lncRNAs in the three groups; J-L: Kaplan–Meier survival analysis of overall survival in the three groups of colorectal cancer patients; M: Progression-free survival analysis of the combined dataset.
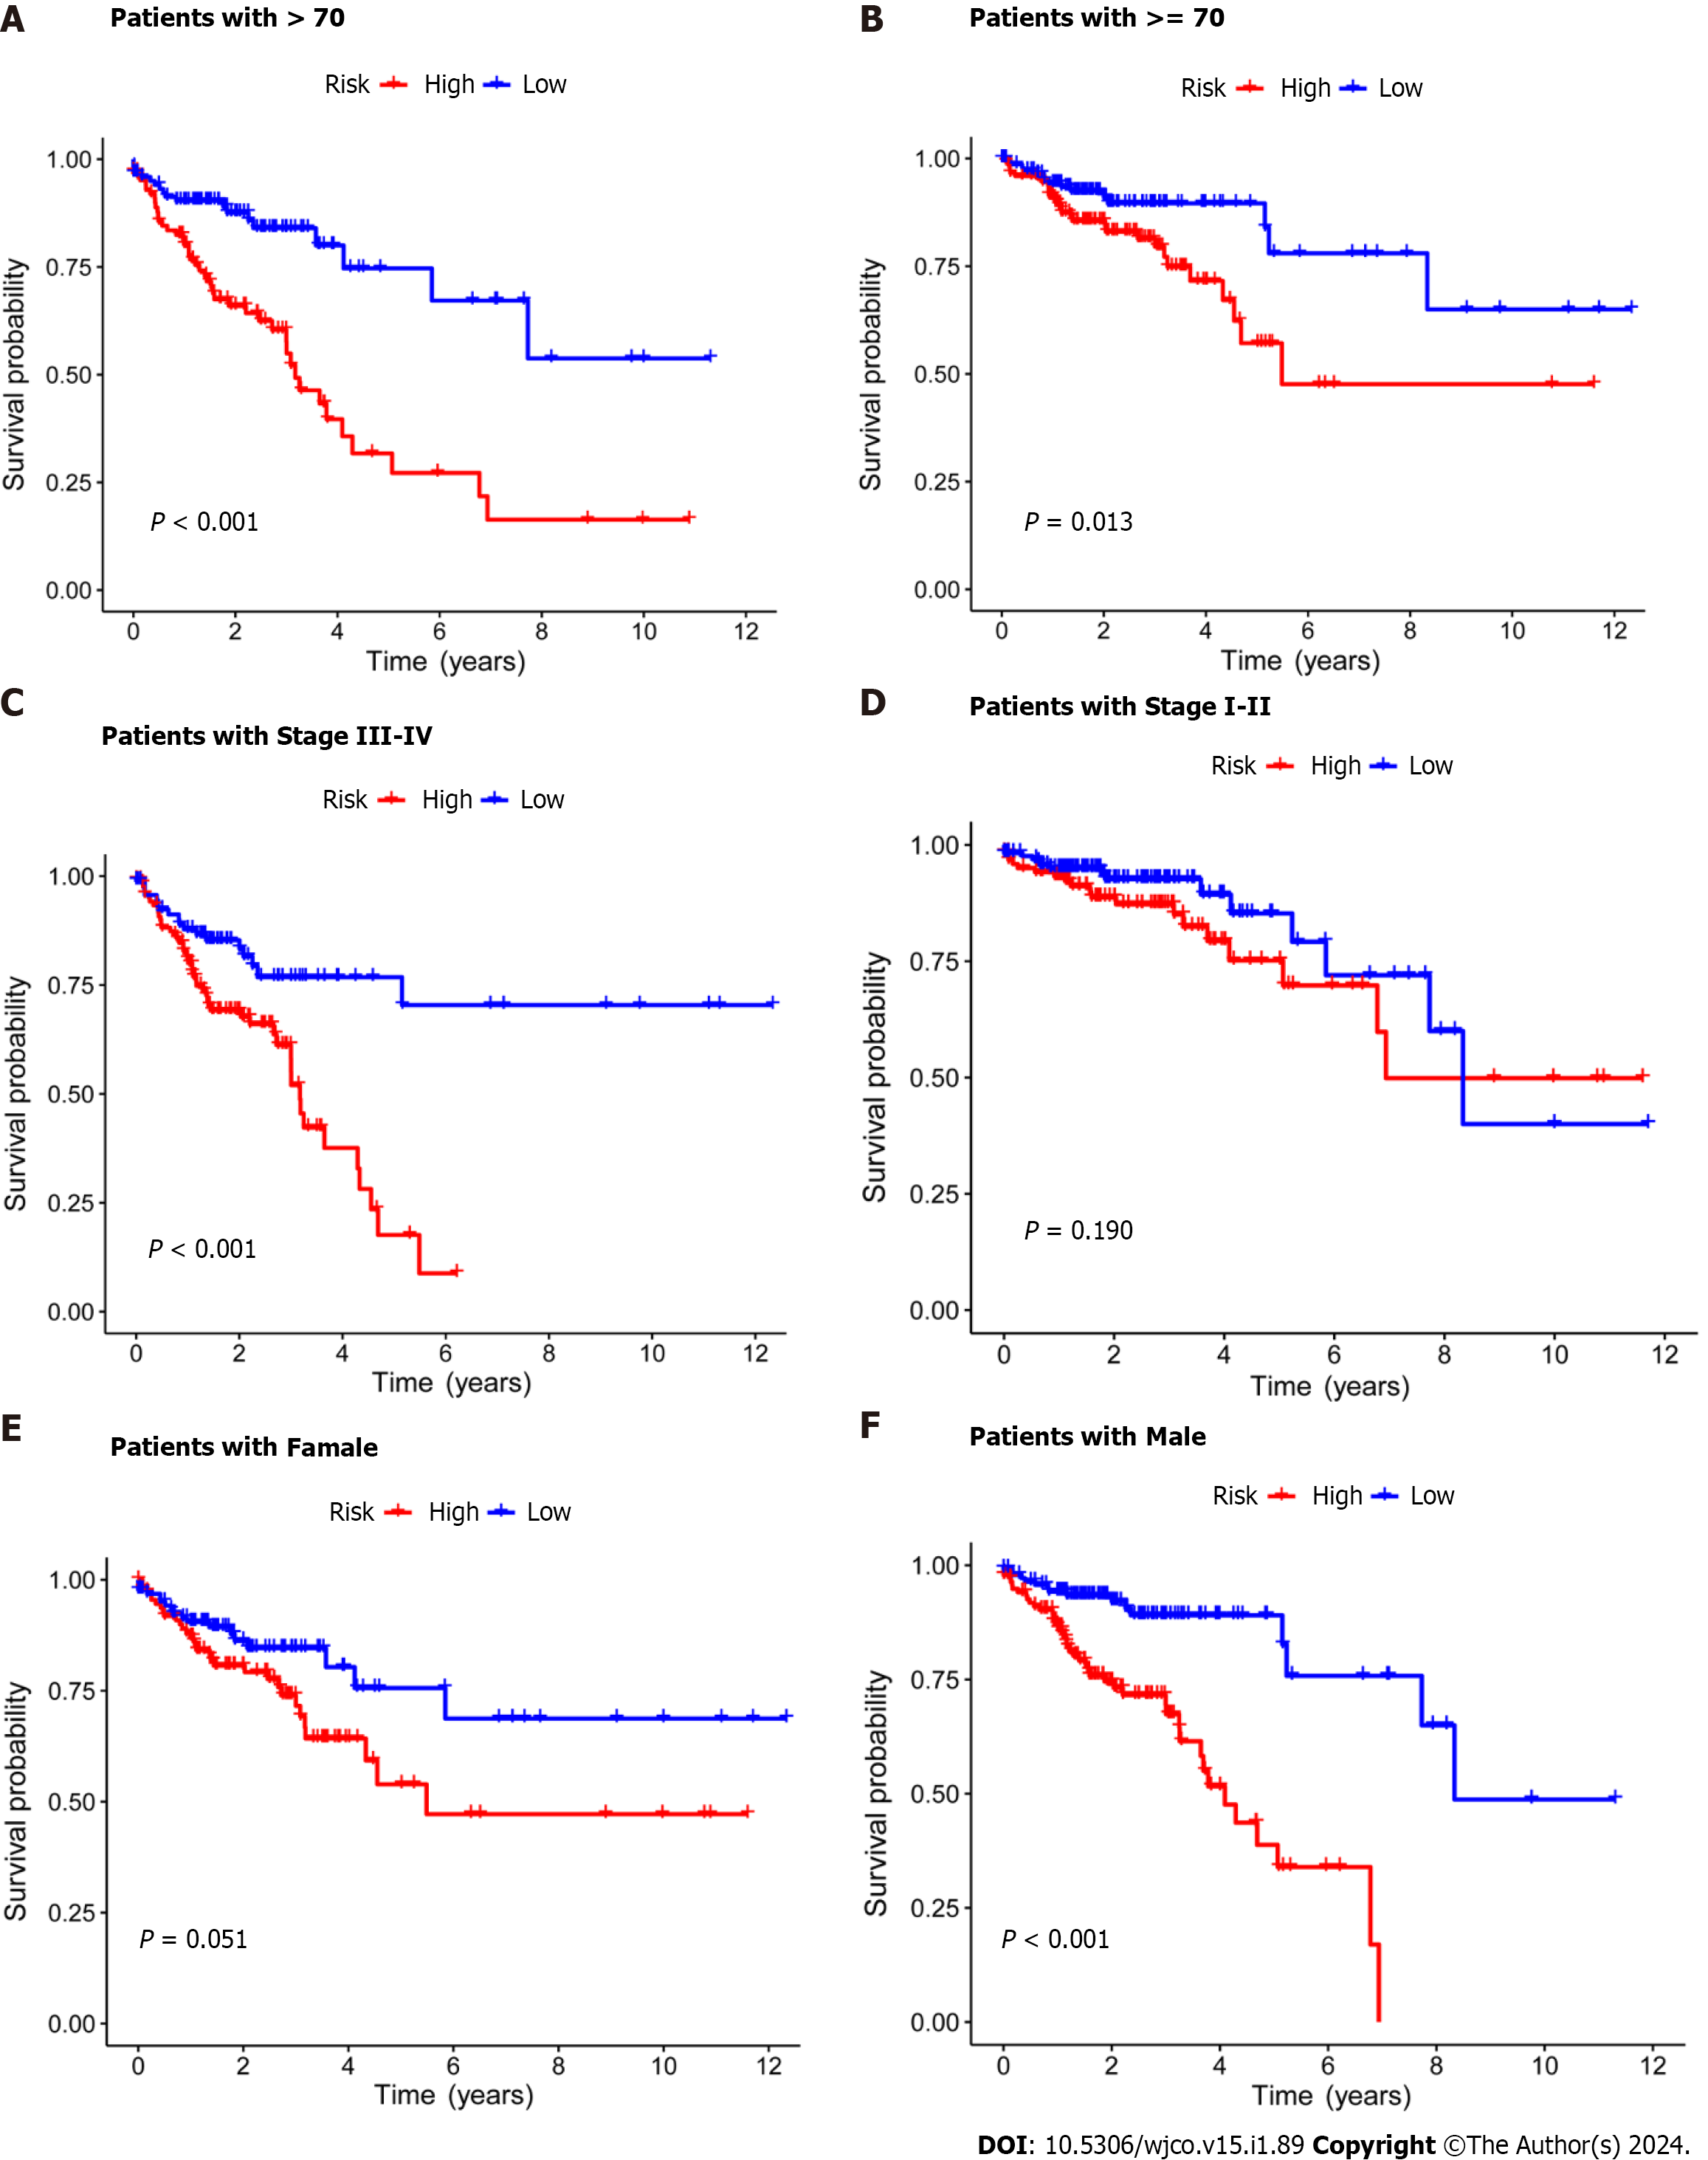
Figure 3 Kaplan–Meier survival analysis of high- and low-risk patients based on different clinical variables.
A and B: Age; C and D: Stage; E and F: Gender.
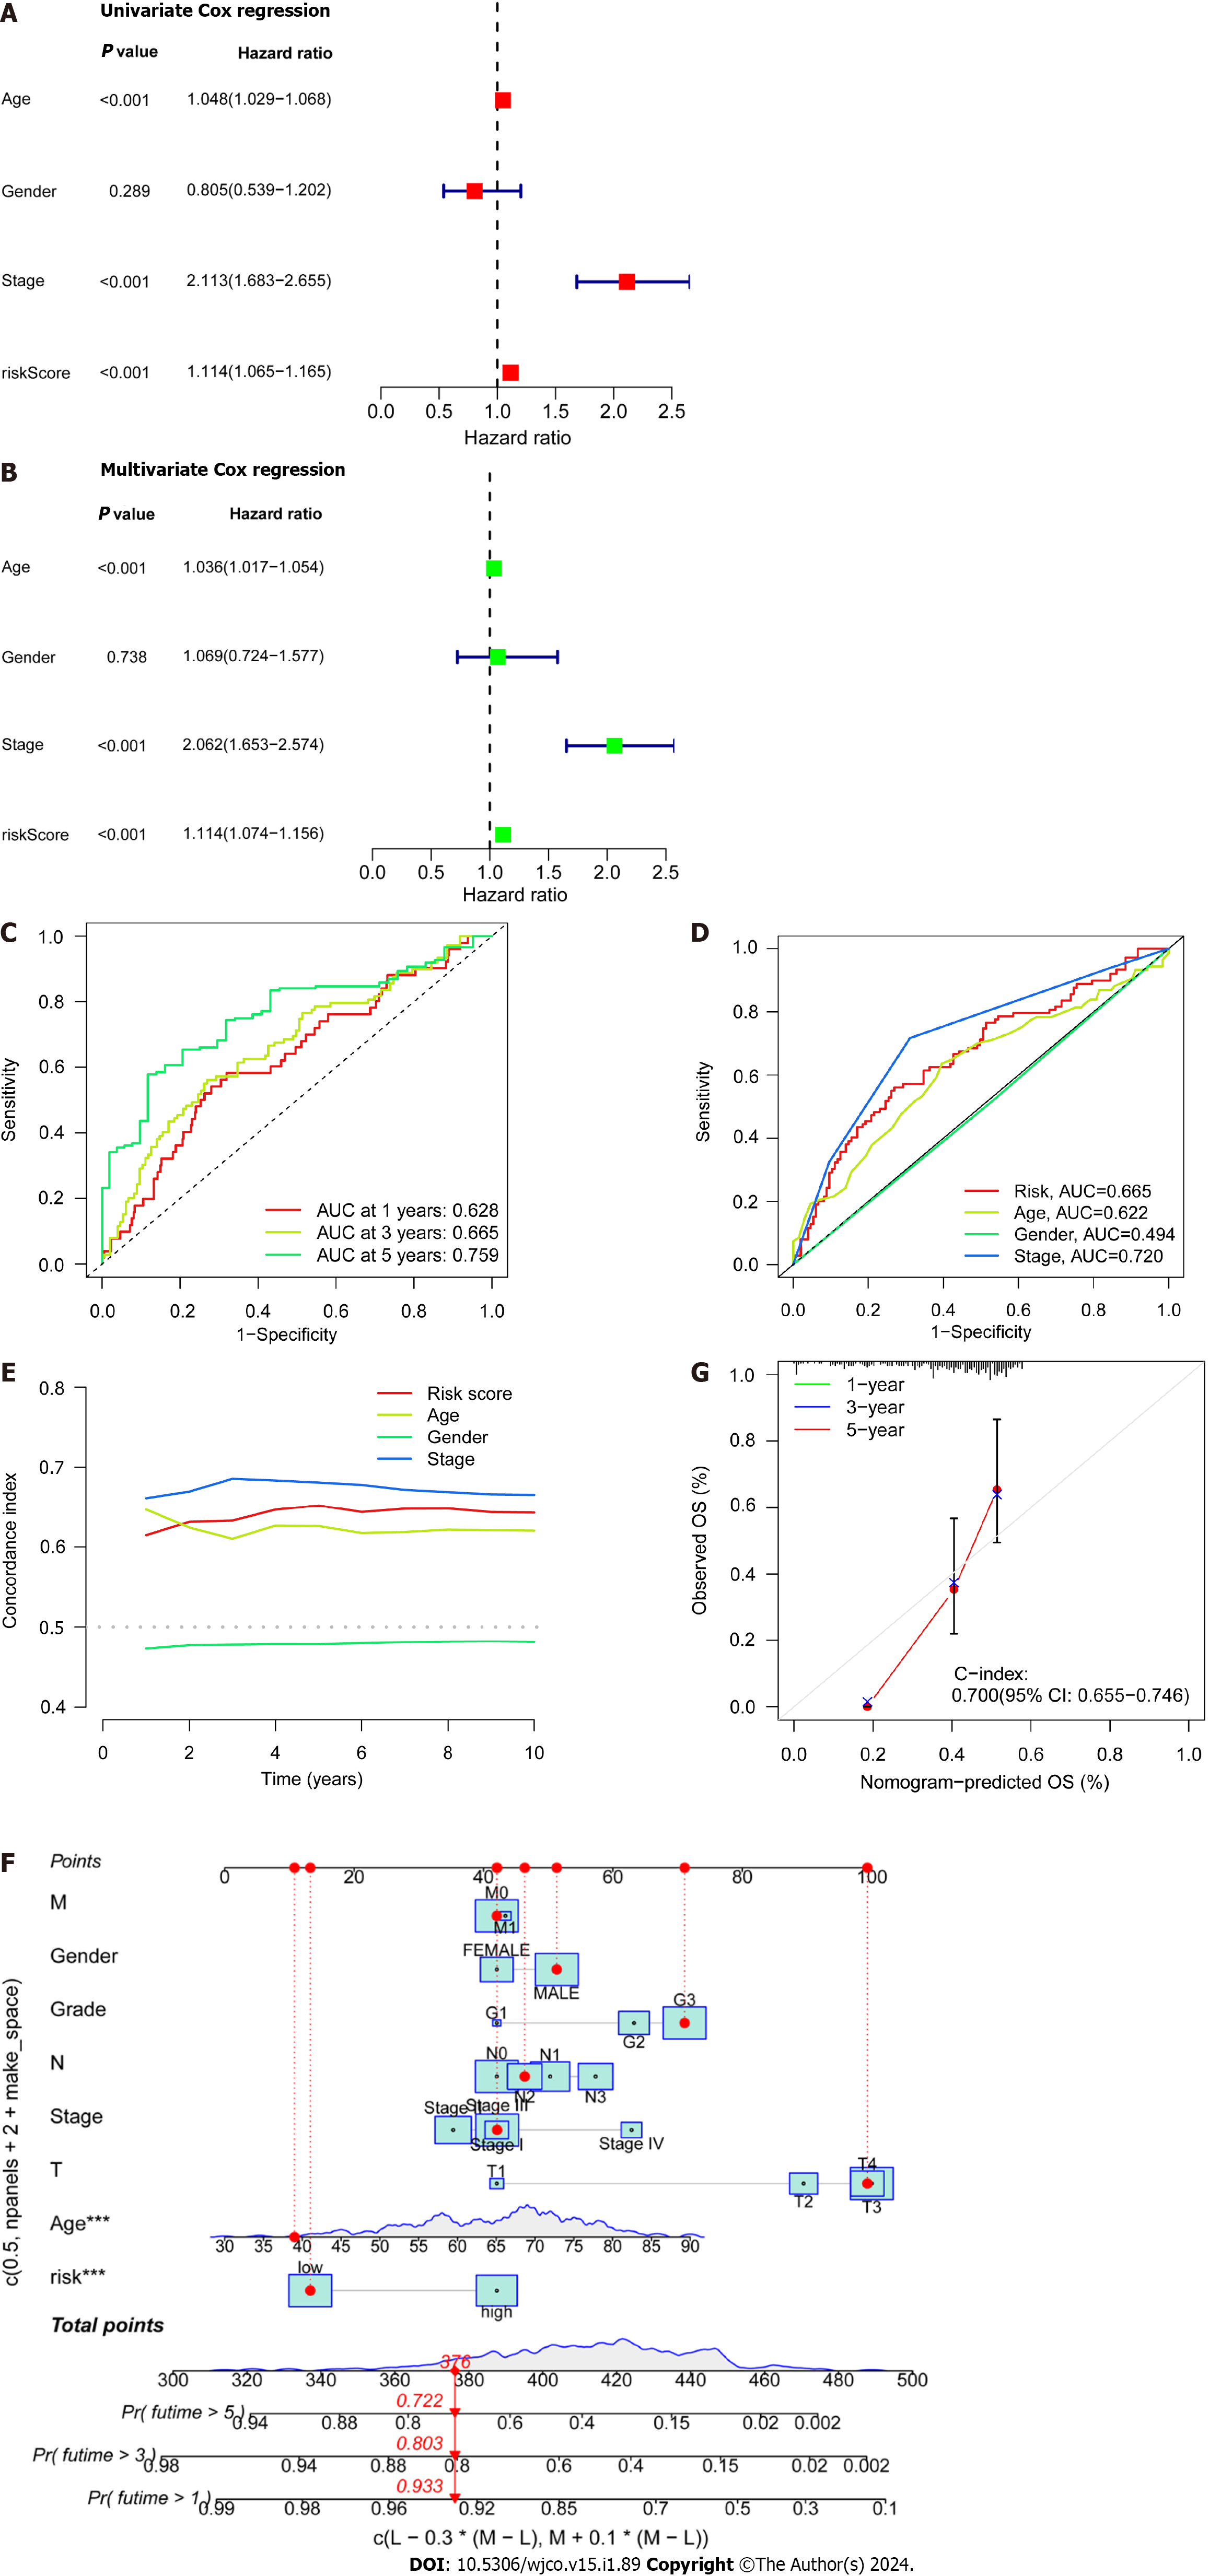
Figure 4 Independent prognostic ability and predictability of clinical outcomes of the disulfidaptosis-related lncRNA risk scoring model.
A: Univariate Cox regression analysis of clinical variables and risk scores; B: Multivariate Cox regression analysis of clinical variables and risk scores; C: Prediction of 1-, 3-, and 5-year overall survival (OS) for all enrolled colorectal cancer (CRC) patients; D: Comparison of risk scoring model and clinical variables in predicting OS in CRC patients; E: C-index ROC curve of the risk model; F: Column chart of risk and clinical variable features predicting 1, 3, and 5-year OS in CRC patients; G: Calibration curves demonstrate the accuracy of the risk model in predicting 1, 3, and 5-year OS in CRC patients.
Figure 5 Enrichment analysis using the gene ontology, Kyoto encyclopedia of genes and genomes, and gene sets using gene set enrichment analysis frameworks.
A and B: Gene ontology analysis reveals the diversity of molecular biology processes, cellular components, and molecular functions; C: Kyoto encyclopedia of genes and genomes pathway analysis identifies significantly enriched pathways; D and E: The top five pathways enriched between high and low-risk populations as identified by gene set enrichment analysisanalysis.
Figure 6 Analysis of the tumor immune microenvironment for high- and low-risk patient groups.
A: Shown are (A) Violin plots of the proportions of 22 tumor-infiltrating immune cells; B: Differential analysis of immune-related functions between high- and low-risk groups; C: Correlation analysis between infiltrating immune cells and eight key disulfidaptosis-related lncRNAs (disease risk factors); D: Correlation analysis between immune checkpoints and risk scores. aP < 0.05; bP < 0.01; cP < 0.001.
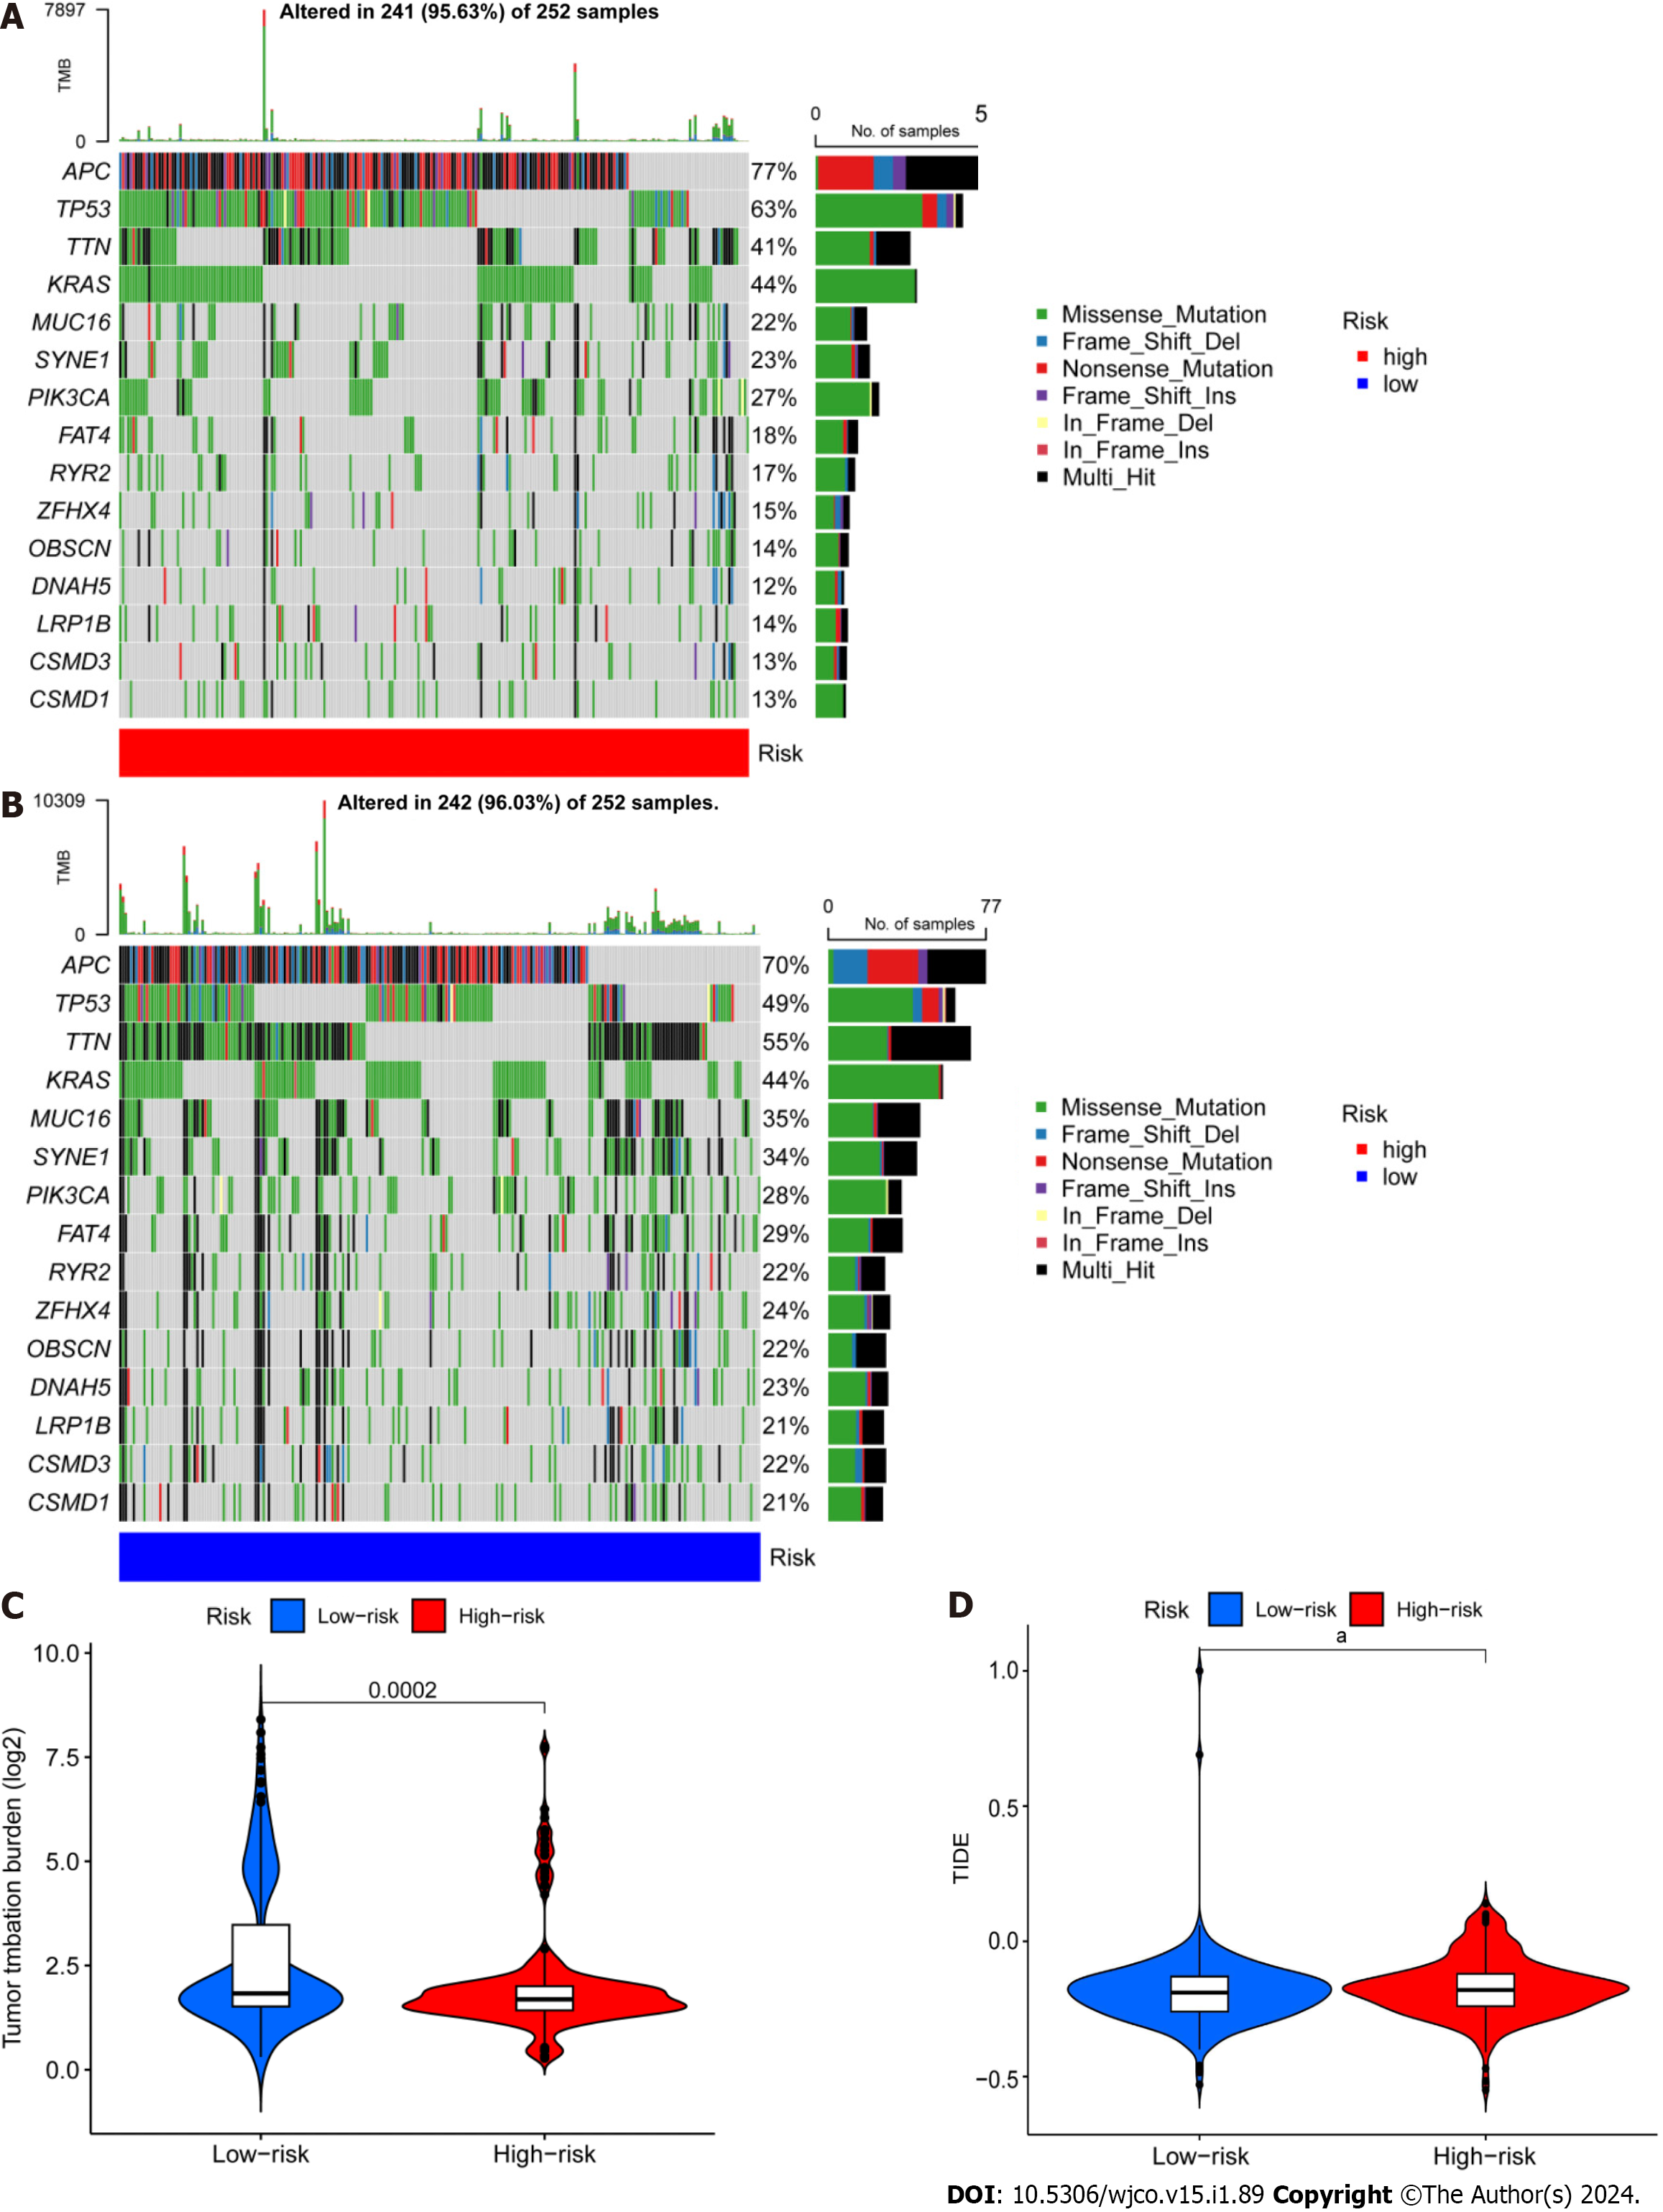
Figure 7 Differential analysis of tumor mutation burden and tumor immune dysfunction and exclusion.
A and B: Waterfall plots depicting 15 highly mutated genes in the high- and low-risk colorectal cancer (CRC) groups; C: Differential analysis of TMB in patients from the high- and low-risk CRC groups; D: Tumor immune dysfunction and exclusion analysis in patients from the high and low-risk groups. aP < 0.05; bP < 0.01; cP < 0.001.
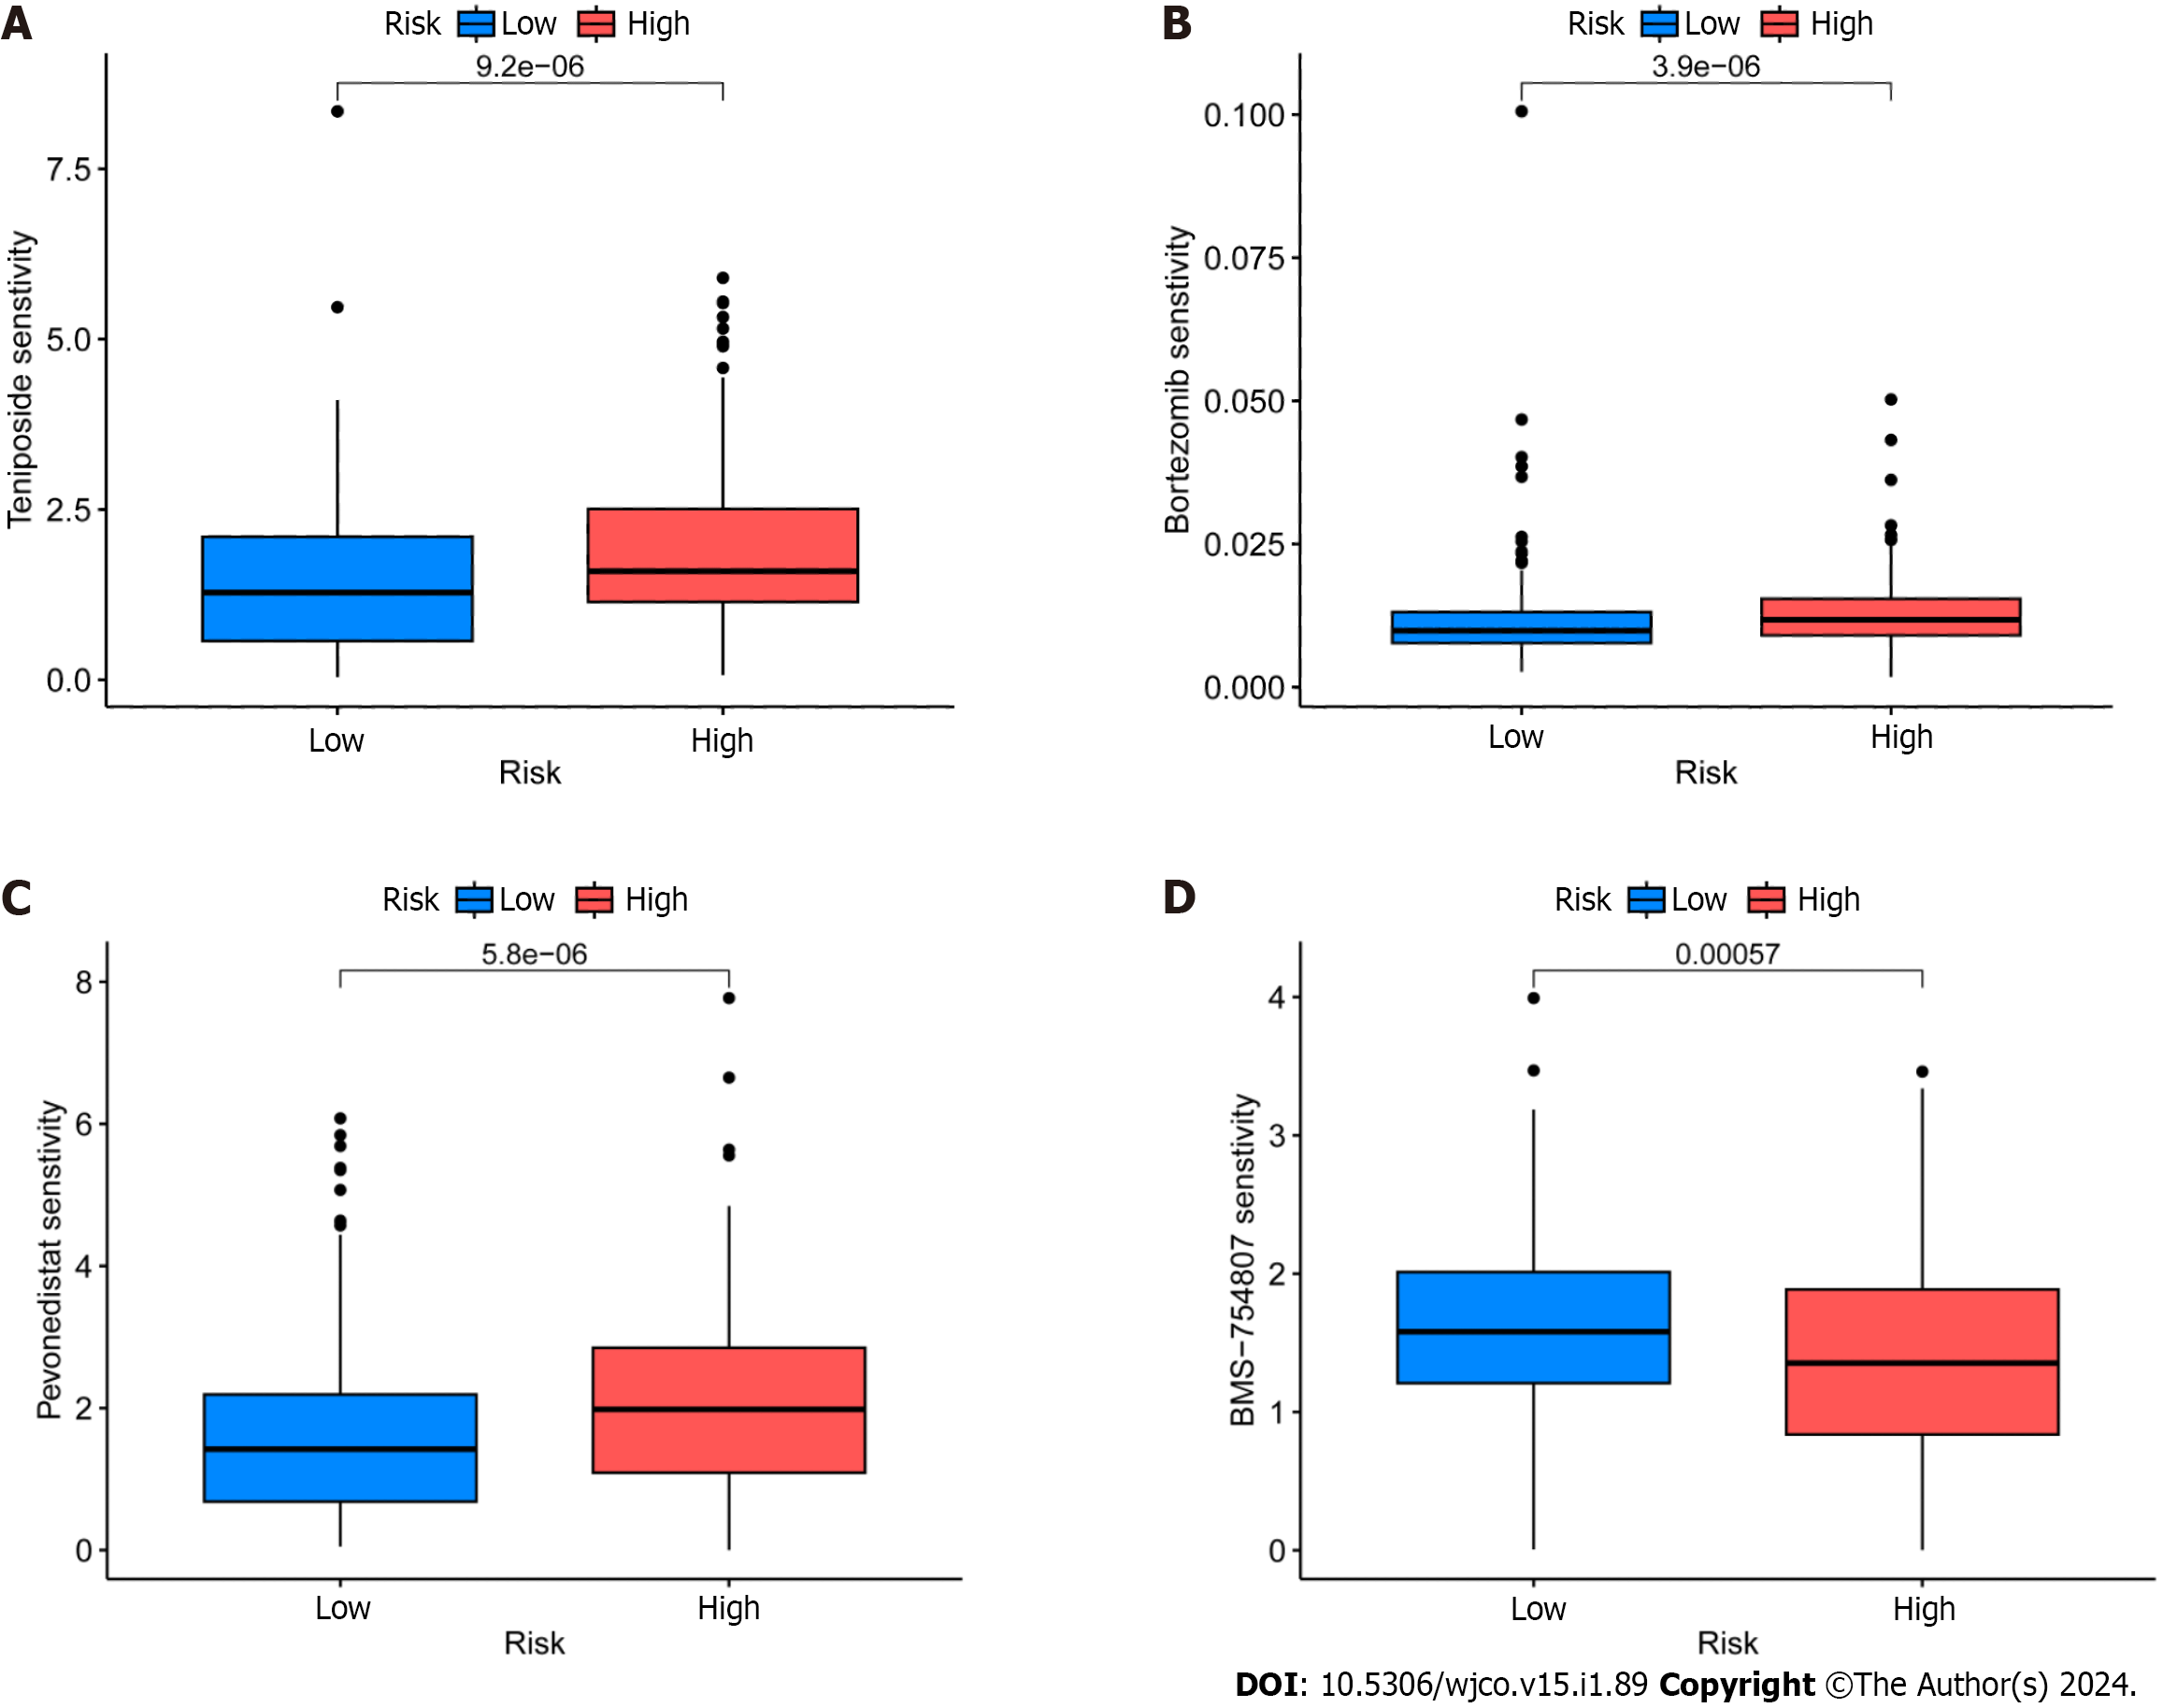
Figure 8 Identification of potential drugs for the treatment of colorectal cancer.
A: Epirubicin; B: Borte zomib; C: TeniposideD: BMS-754807.
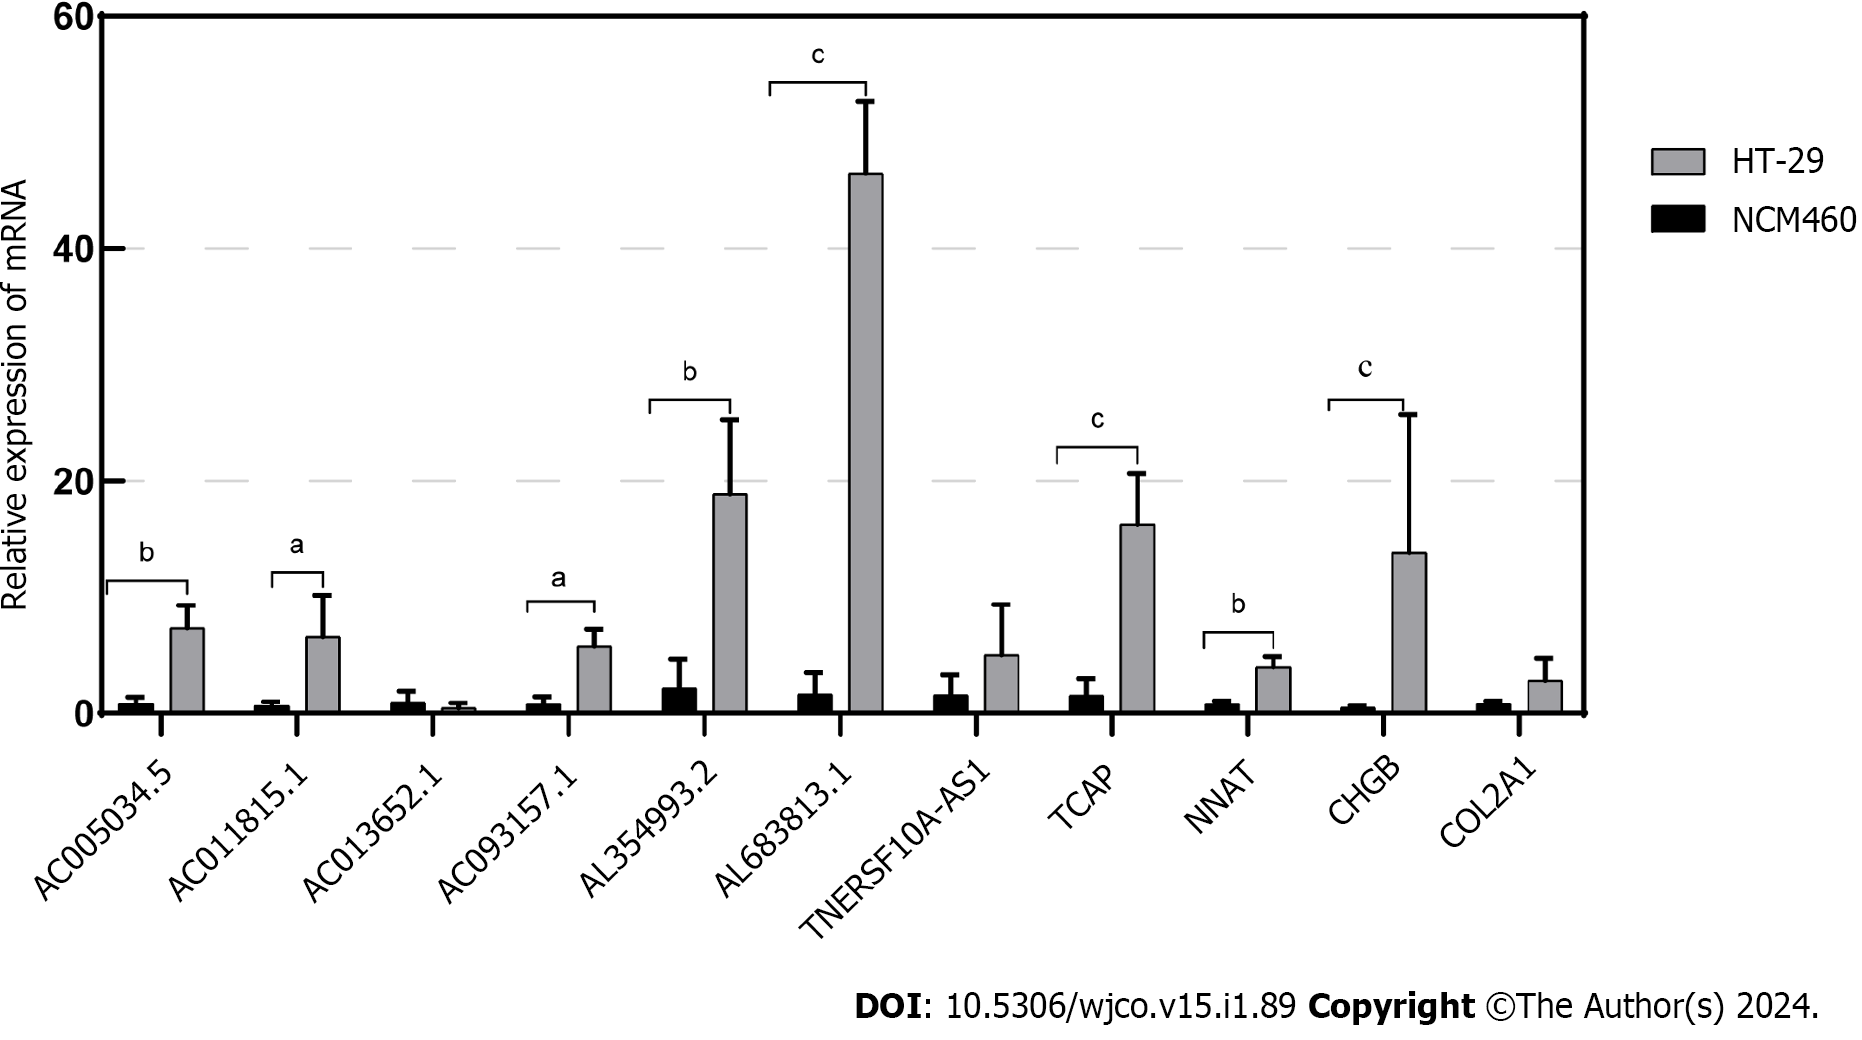
Figure 9 Validation of the relationship between lncRNAs/Genes and cell death induced by disulfidoptosis.
The expression of lncRNAs/Genes in NCM460 and HT-29 cells was measured by quantitative real-time polymerase chain reaction (n = 3). aP < 0.05; bP < 0.01; cP < 0.001.
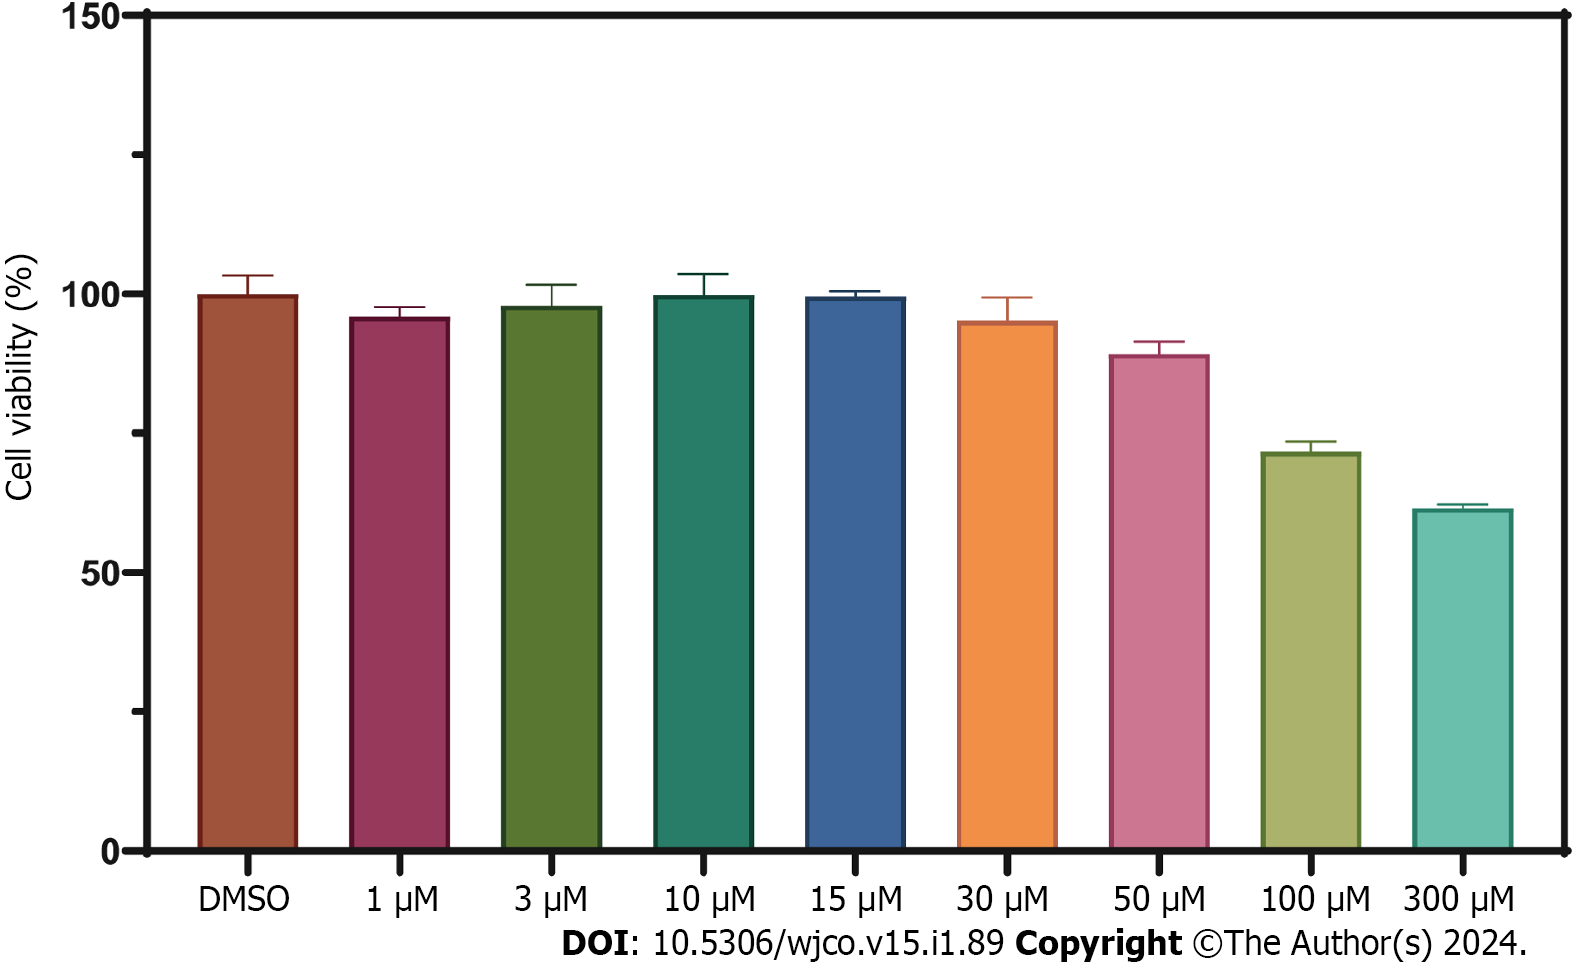
Figure 10 Cell viability assessment of HT-29 cells treated with WZB117 at different concentrations for 24 h.
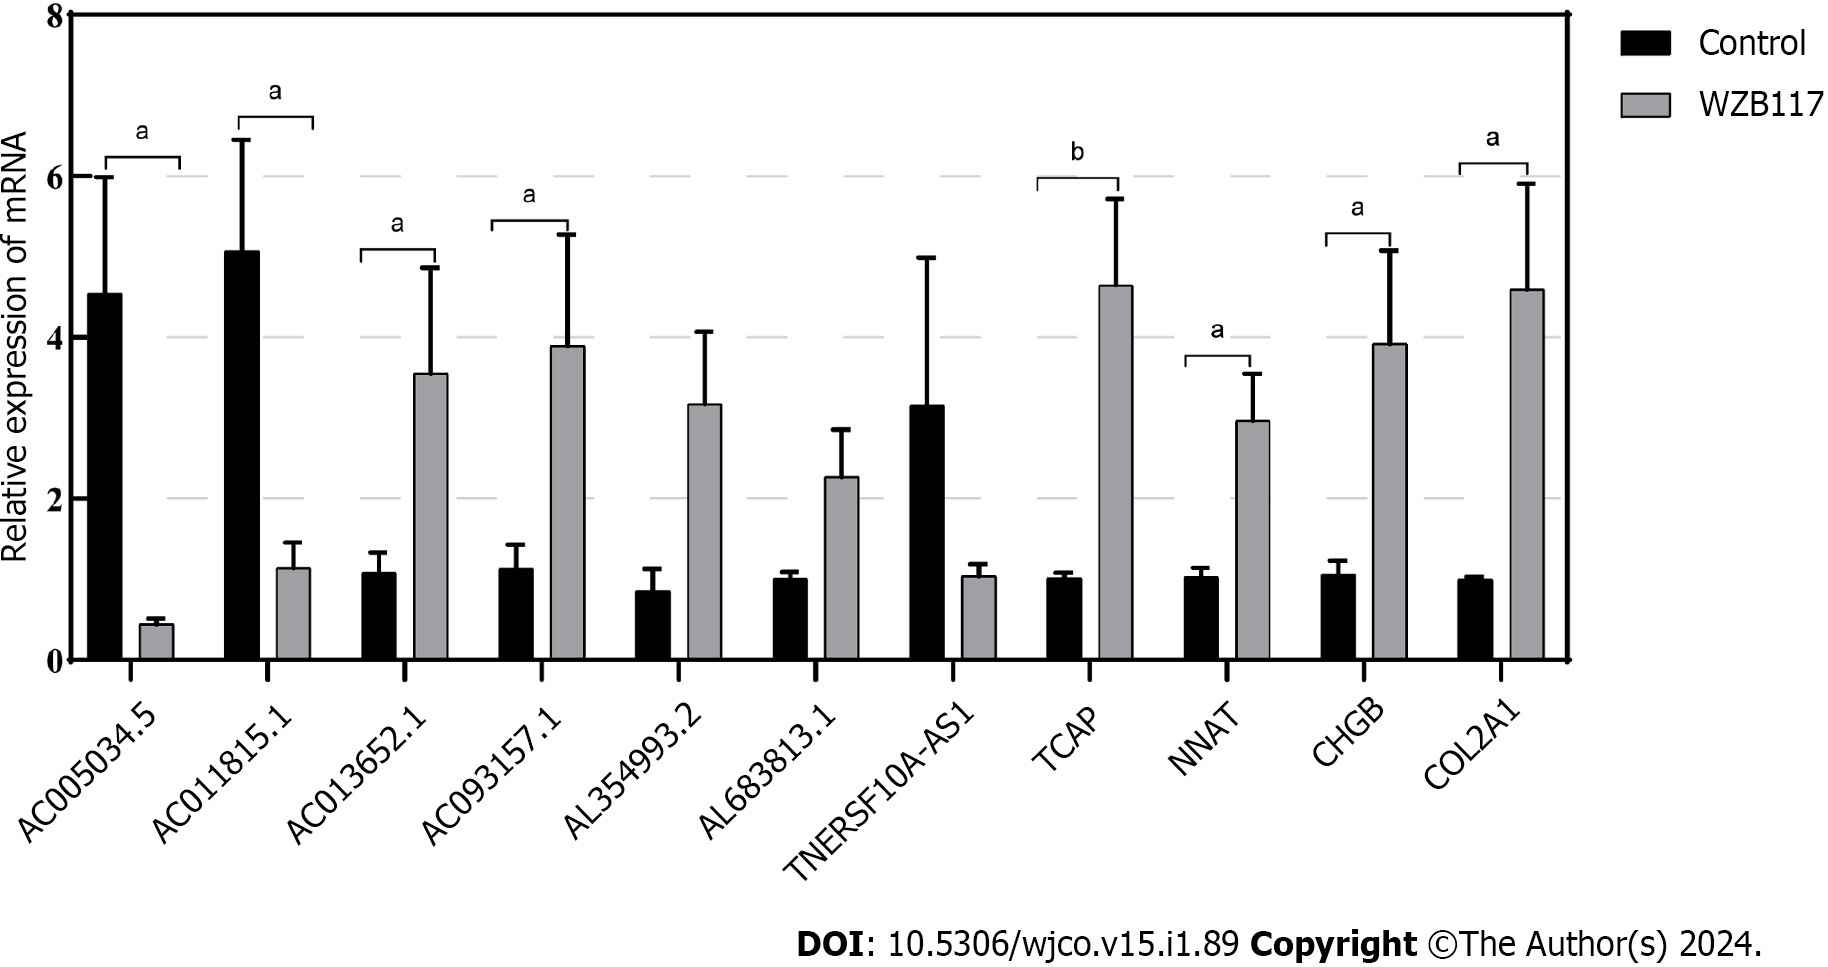
Figure 11 Validation of the relationship between lncRNAs/Genes and cell death induced by disulfidoptosis.
The expression of lncRNAs/Genes in HT-29 cells was measured by quantitative real-time polymerase chain reaction (n = 3) after treatment with 300 µmol/L WZB117 for 24 h. aP < 0.05; bP < 0.01; cP < 0.001.
- Citation: Wang KL, Chen KD, Tang WW, Chen ZP, Wang YJ, Shi GP, Chen YG. Predicting colorectal cancer prognosis based on long noncoding RNAs of disulfidptosis genes. World J Clin Oncol 2024; 15(1): 89-114
- URL: https://www.wjgnet.com/2218-4333/full/v15/i1/89.htm
- DOI: https://dx.doi.org/10.5306/wjco.v15.i1.89


