Copyright
©The Author(s) 2024.
World J Clin Oncol. Jan 24, 2024; 15(1): 145-158
Published online Jan 24, 2024. doi: 10.5306/wjco.v15.i1.145
Published online Jan 24, 2024. doi: 10.5306/wjco.v15.i1.145
Figure 1 Yearly changes in the number of publications and average number of citations.
The change in the number of publication in corresponding year is shown with a blue line, and the change in the average annual number of citations is shown with a brown line.
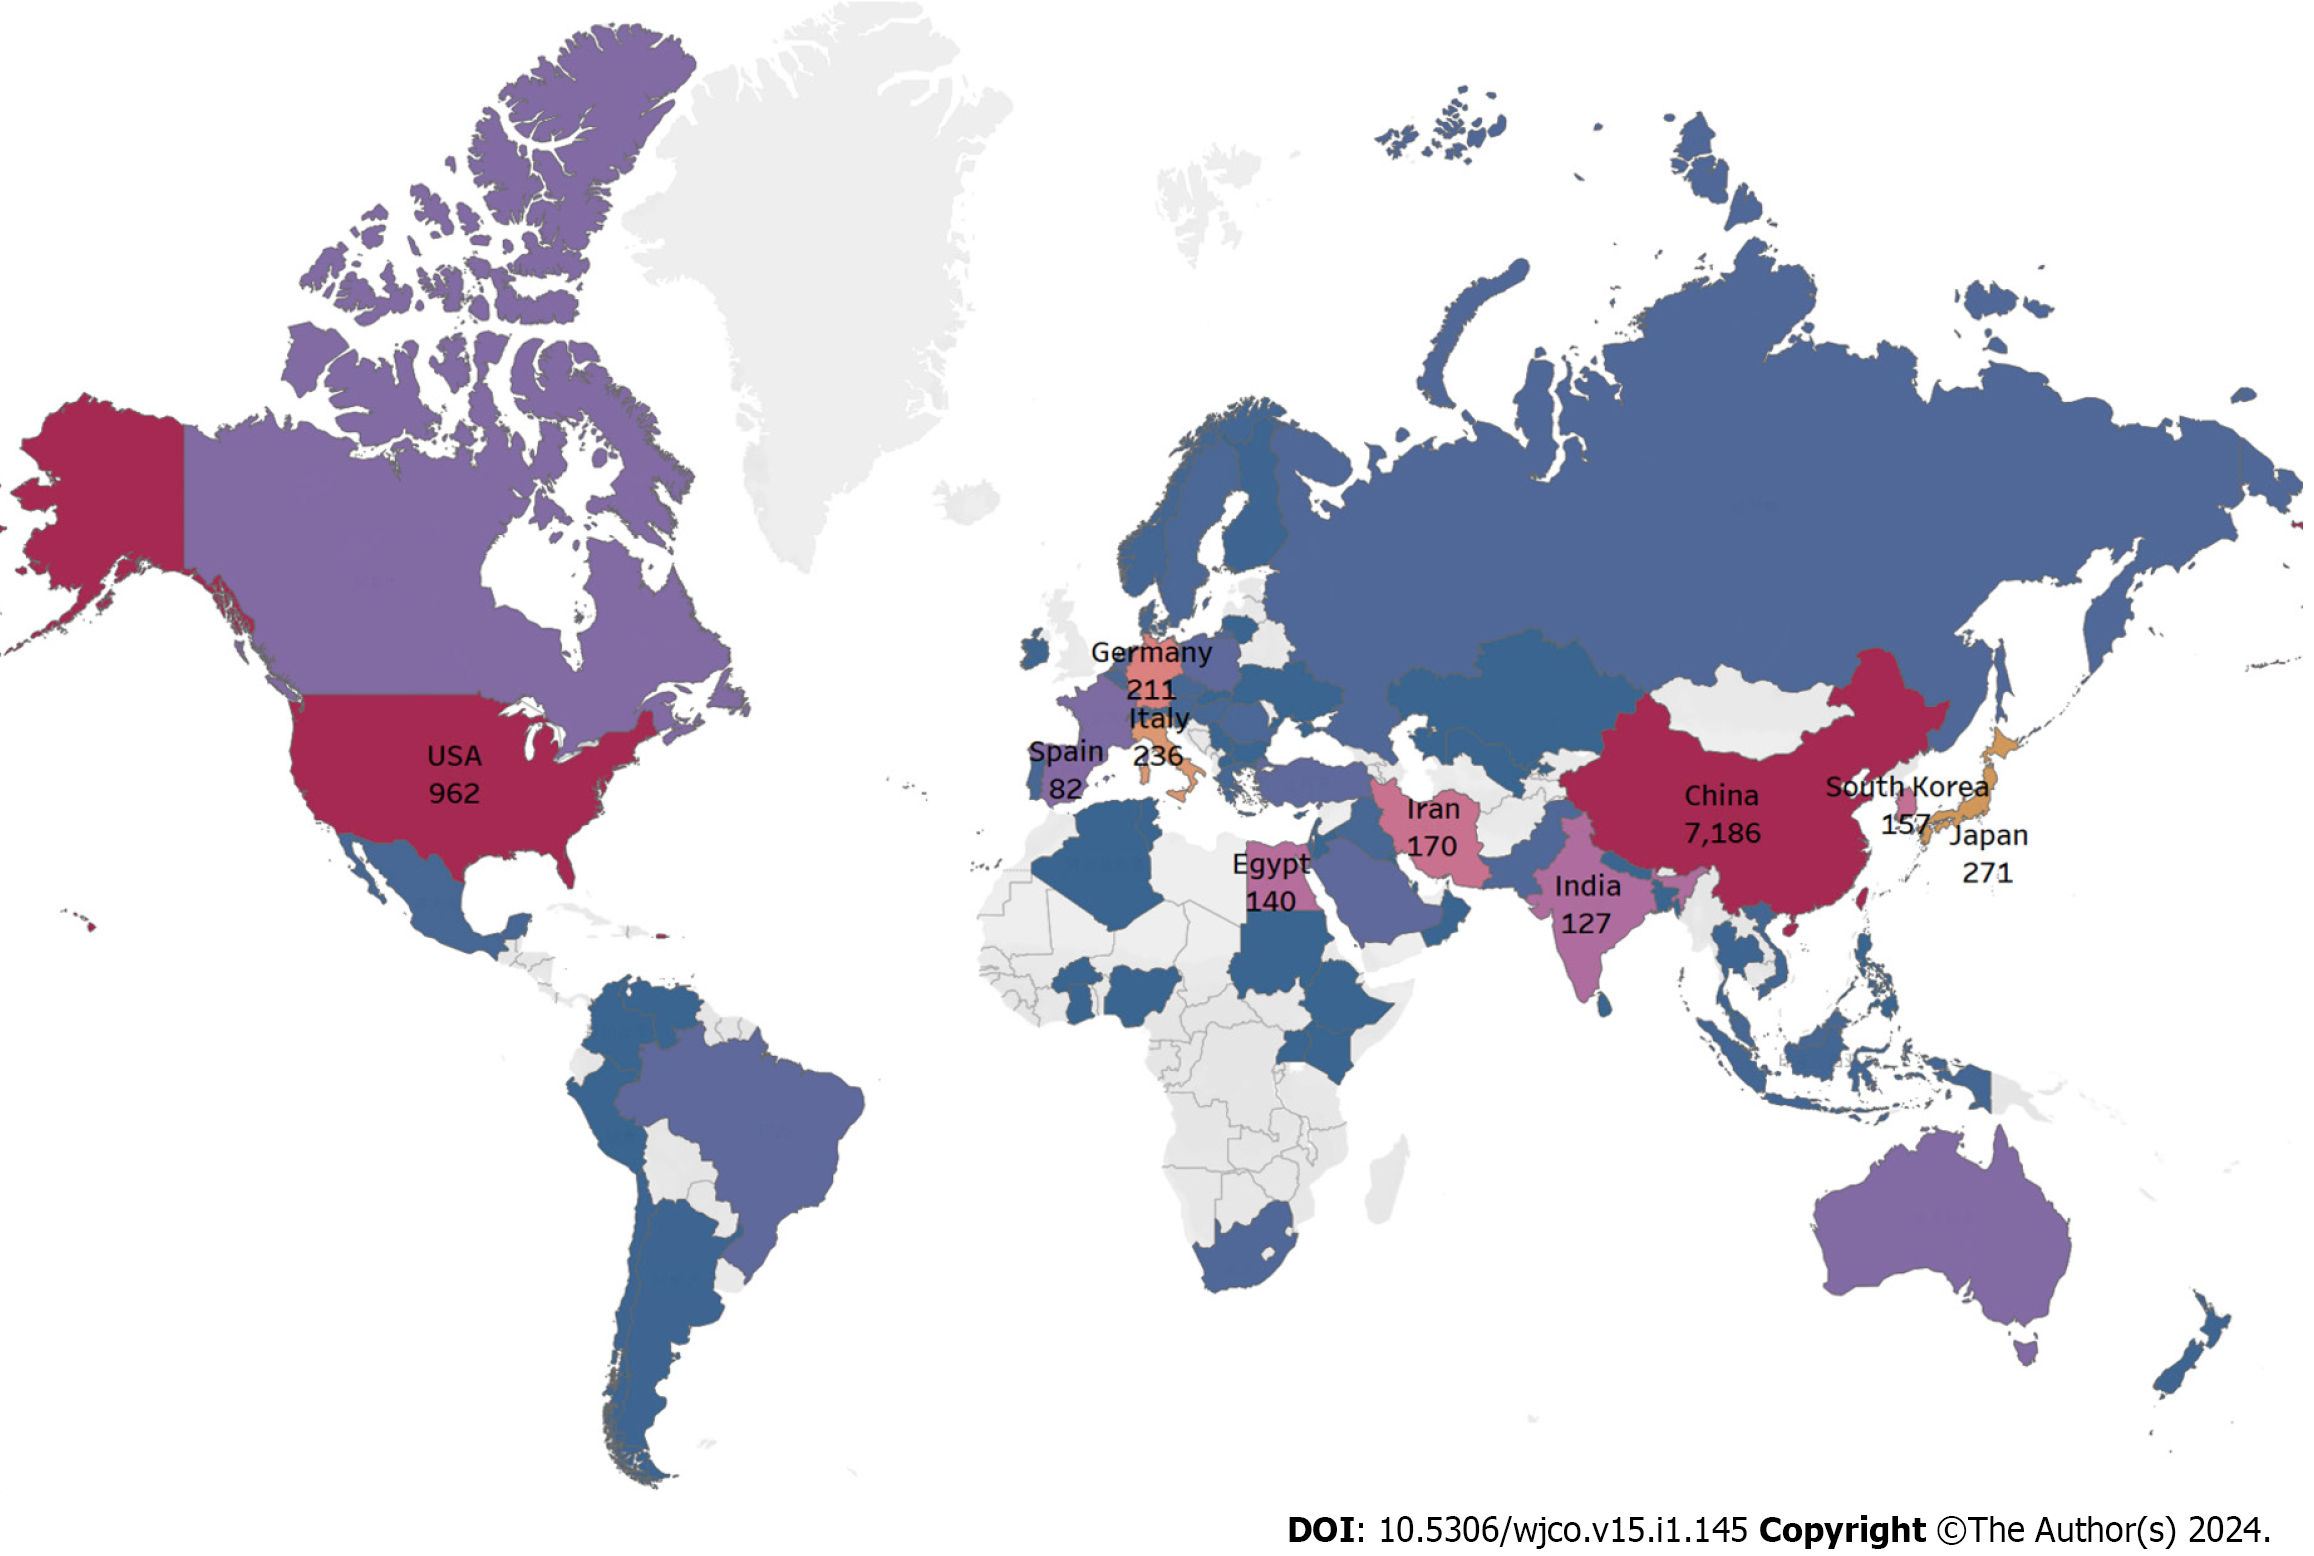
Figure 2 The number of articles in each country.
The closer the color is to red, the higher the number of articles issued in this country.
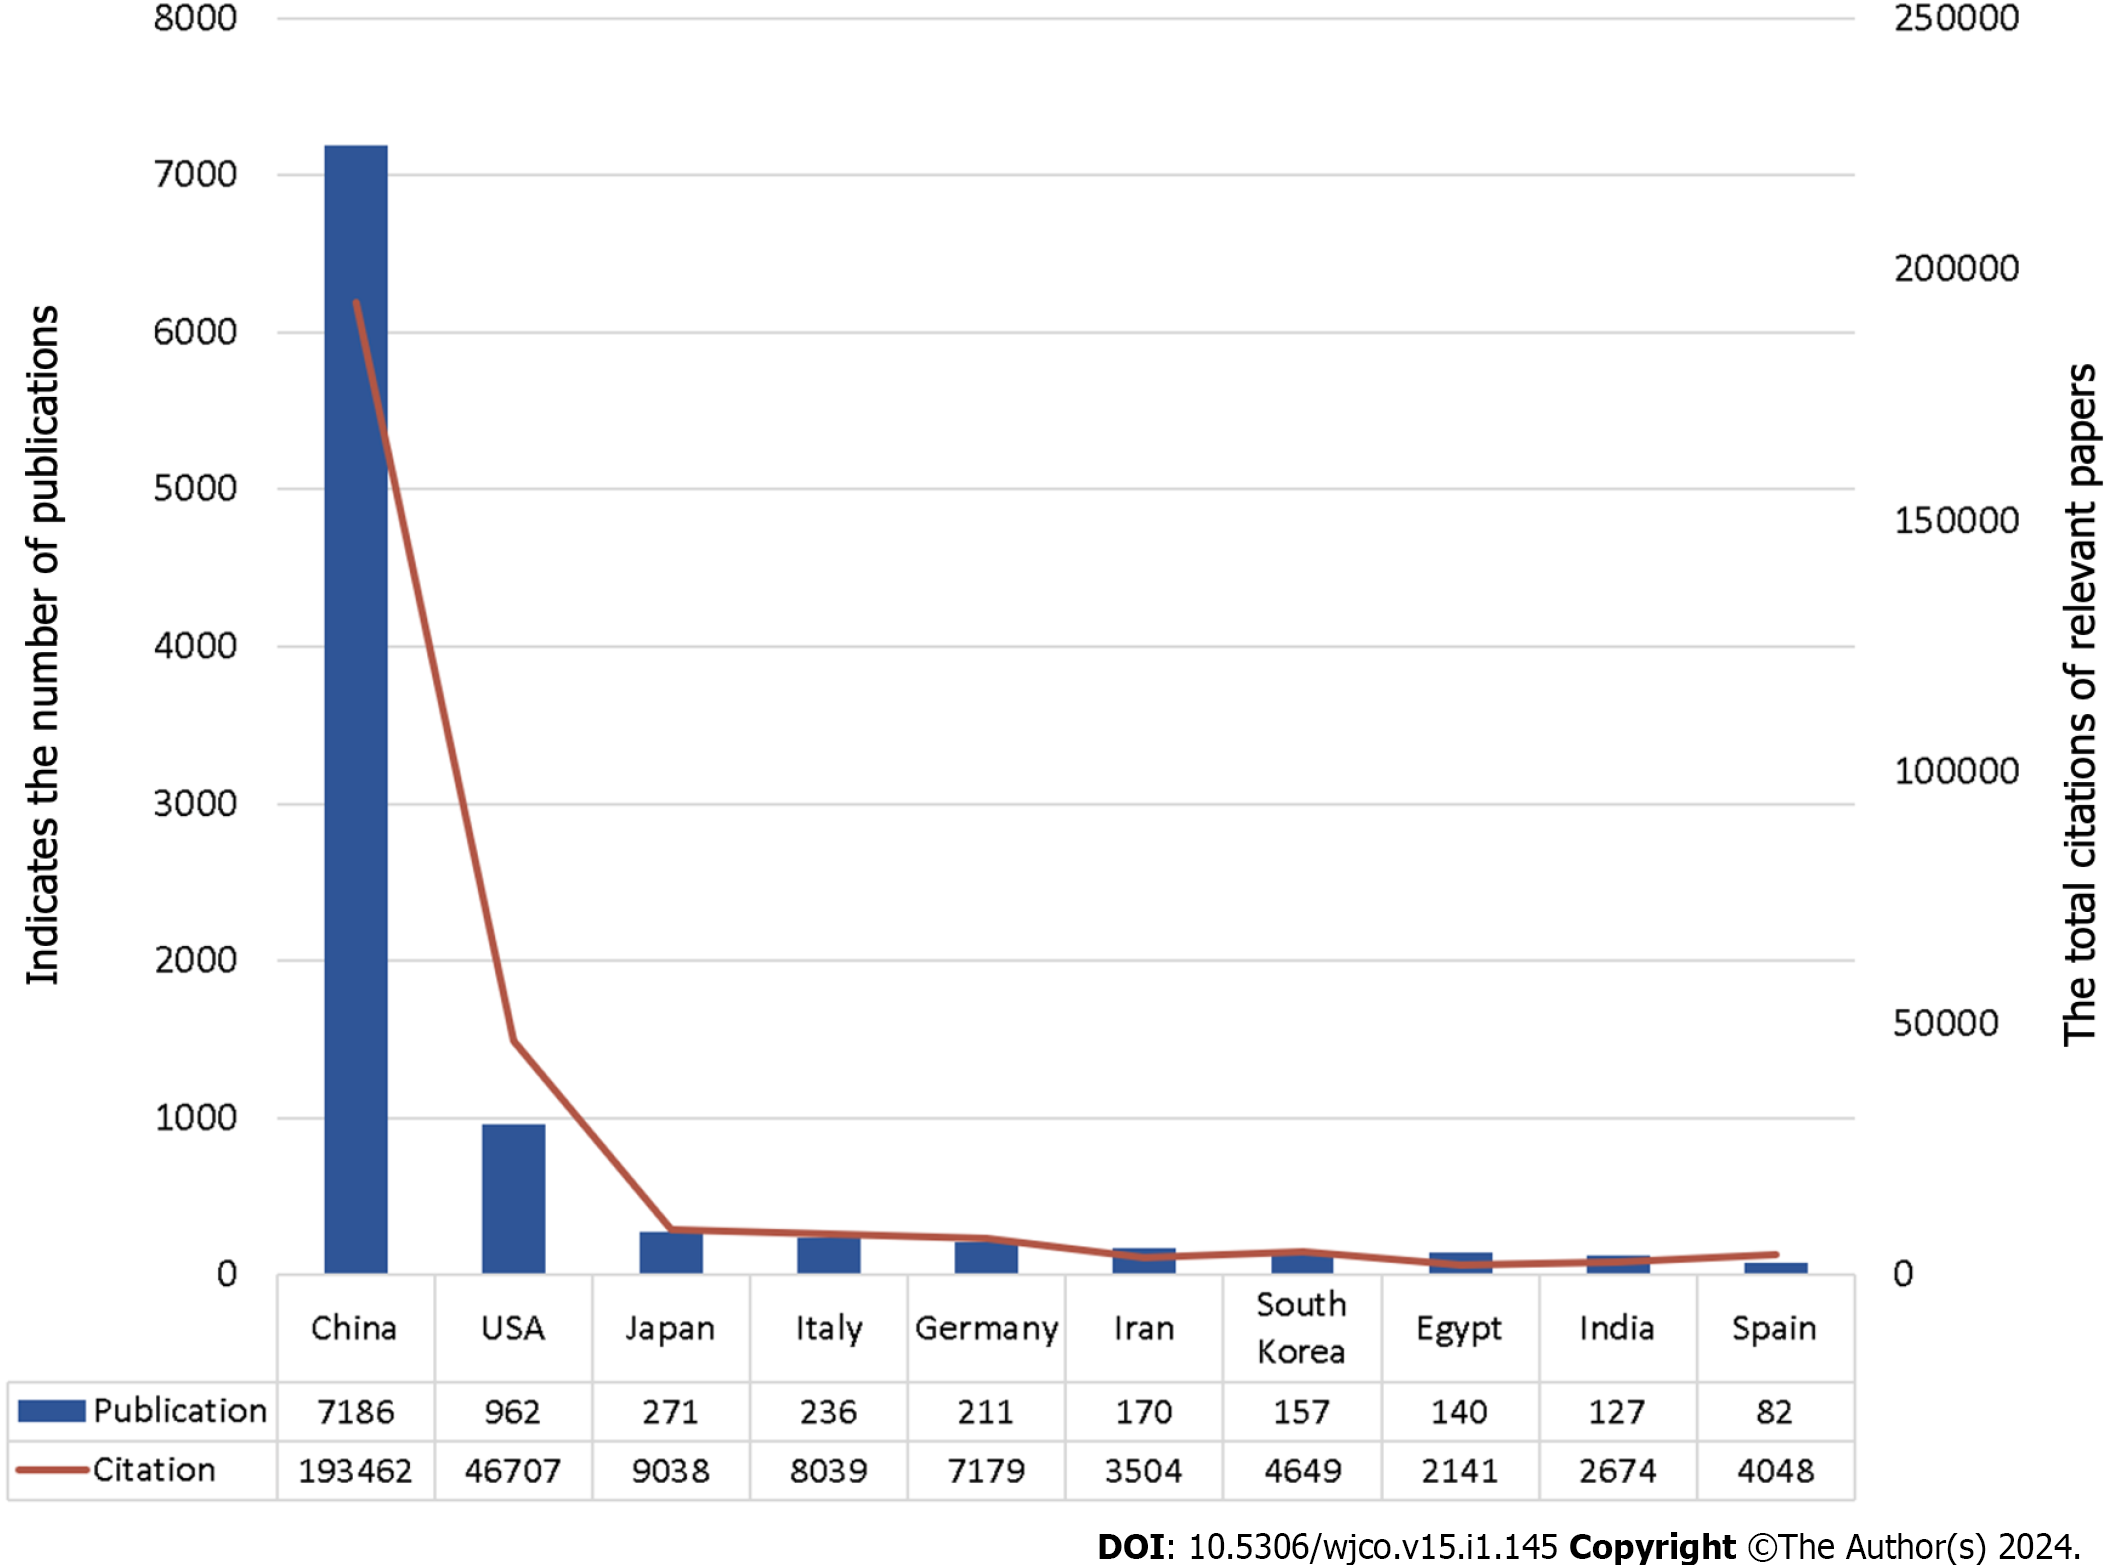
Figure 3 Top 10 countries with most publications and citations.
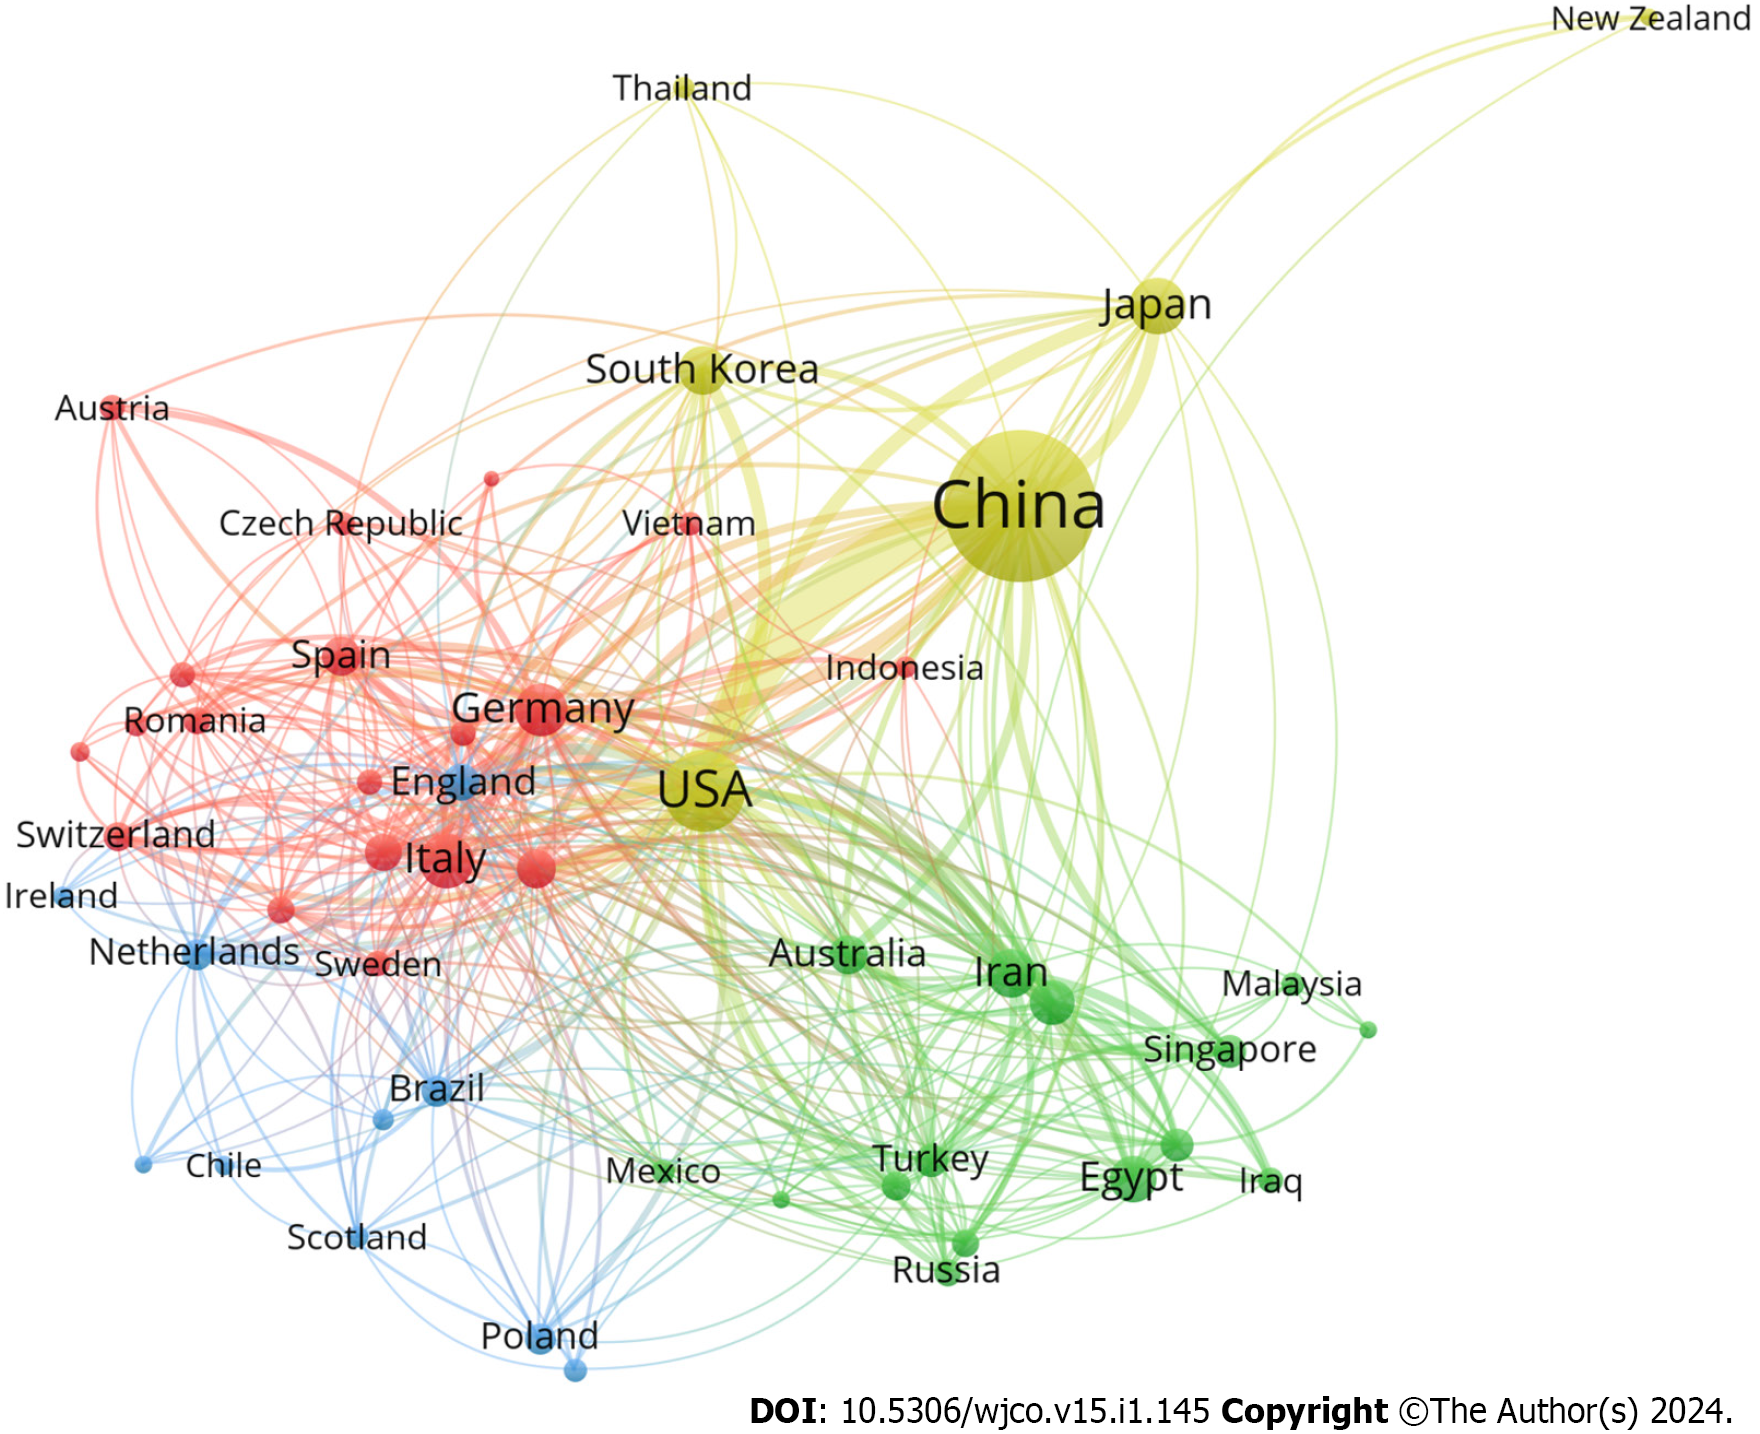
Figure 4 Country-level cooperation network map.
Each node represents a country, and the connecting lines indicate that there were associations between these countries, different colors identified different research communities.
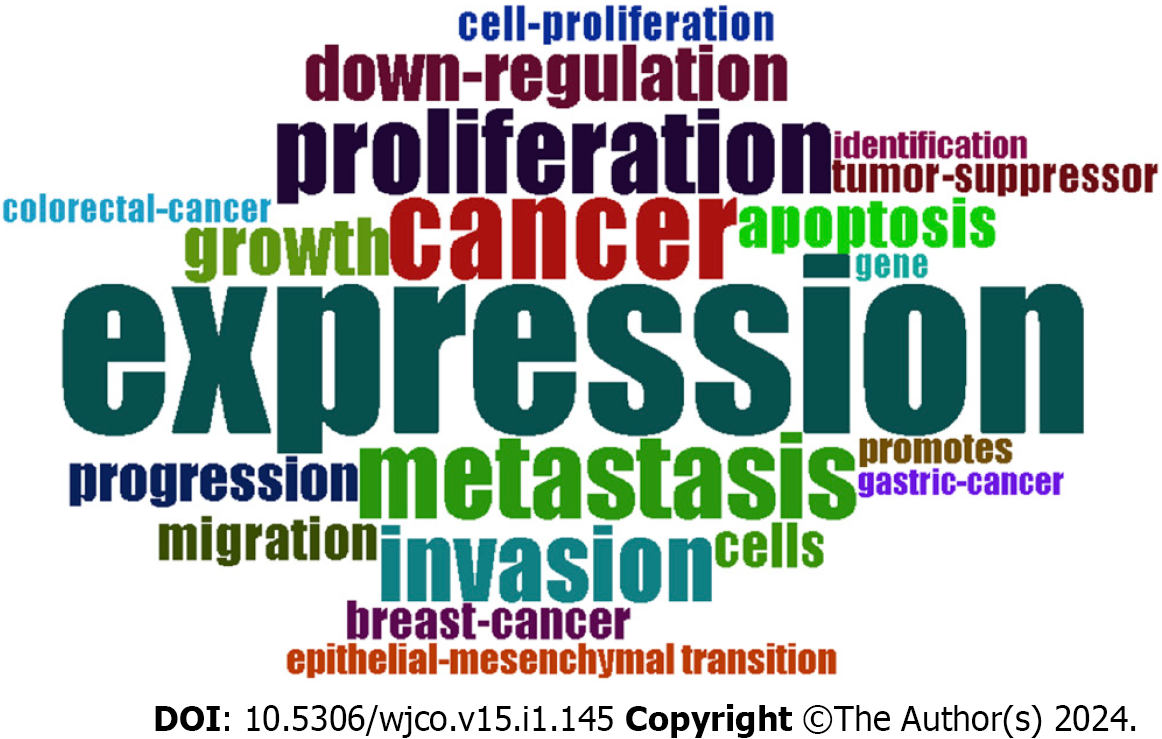
Figure 5 Word cloud.
A word cloud of the 20 most frequently used research keywords, the larger the font size the higher the frequency of occurrence.
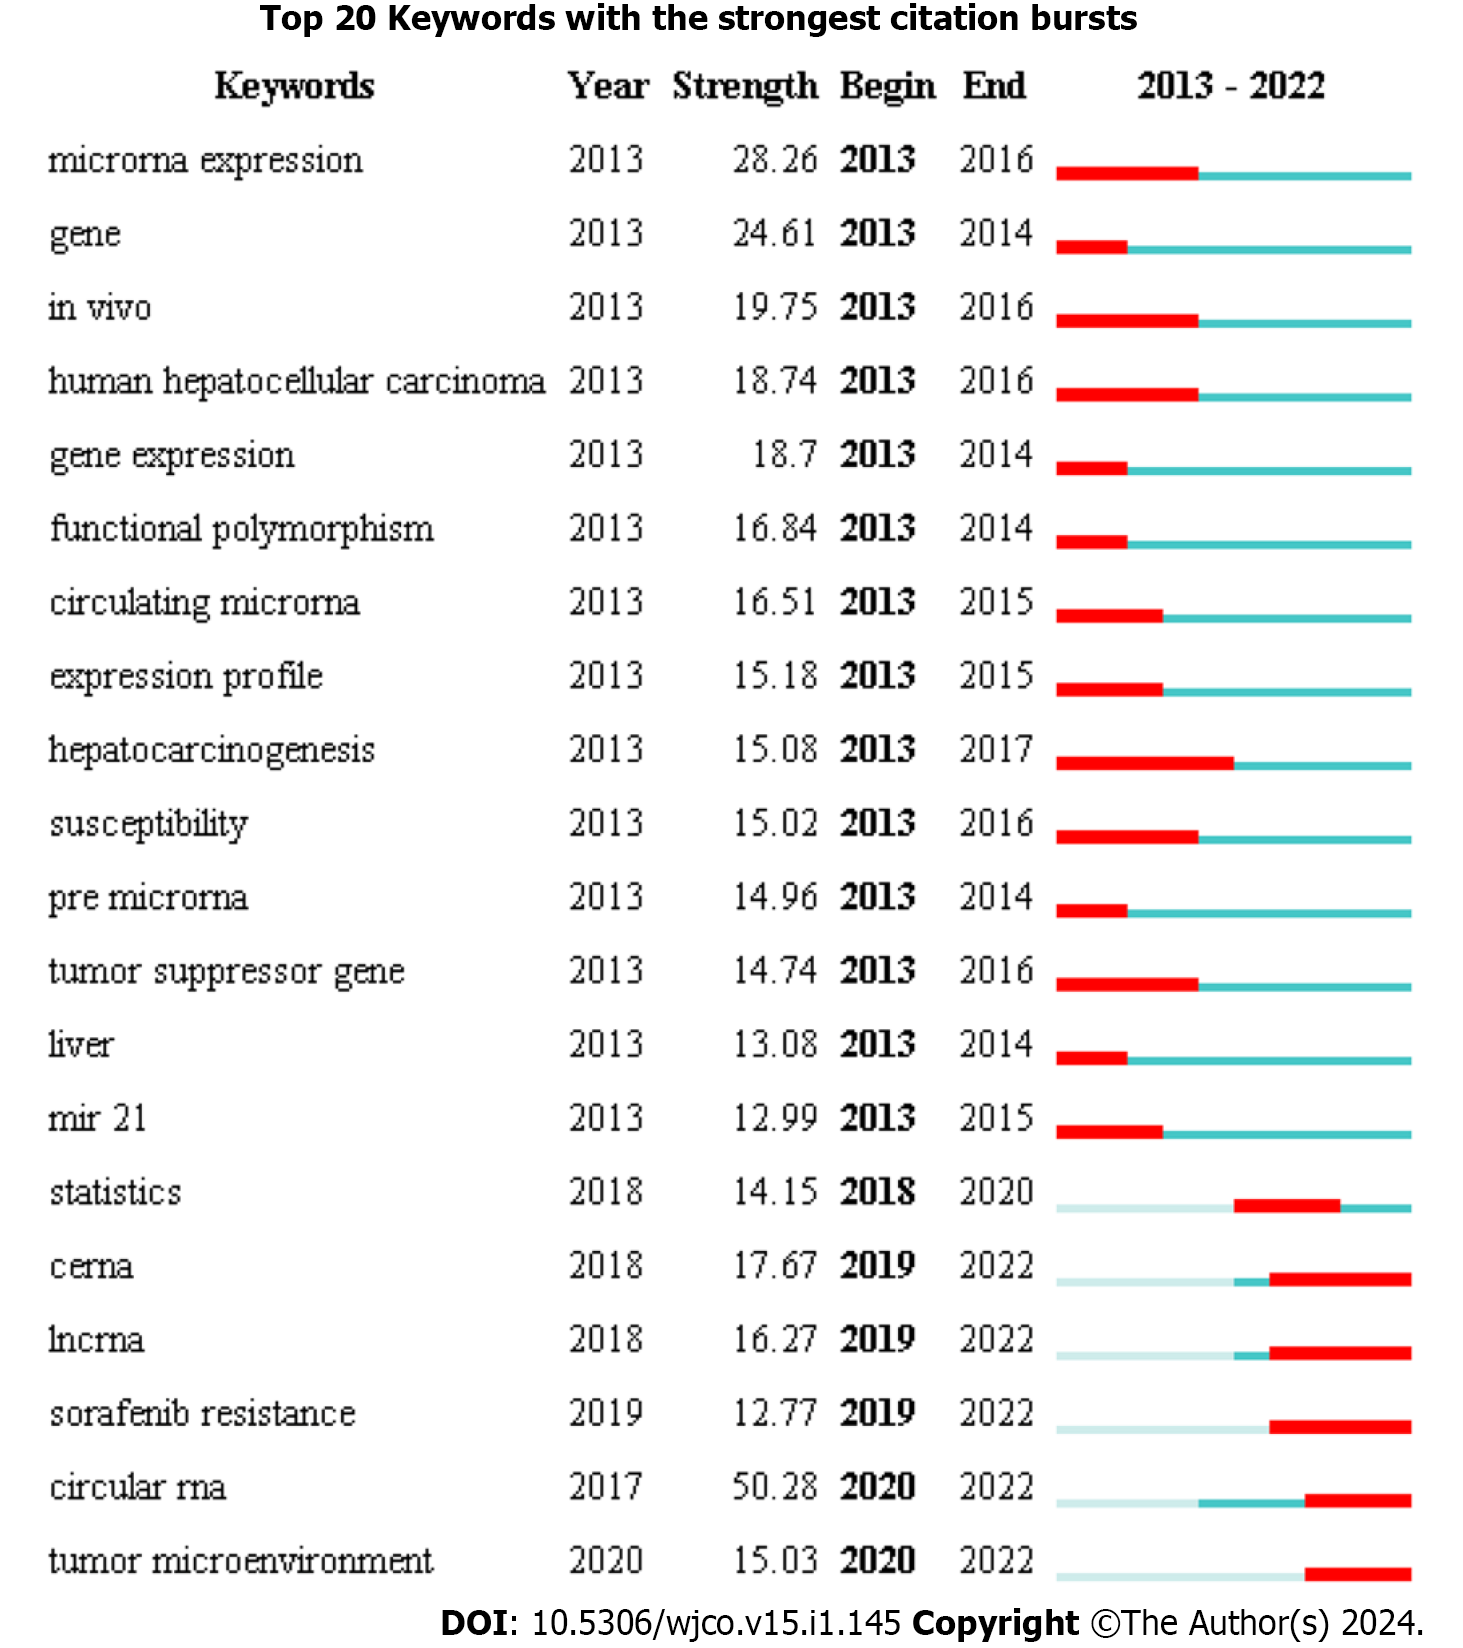
Figure 6 Top 20 keywords with the strongest citation burst.
In the graph on the right, the red line indicates the keyword burst during this period.
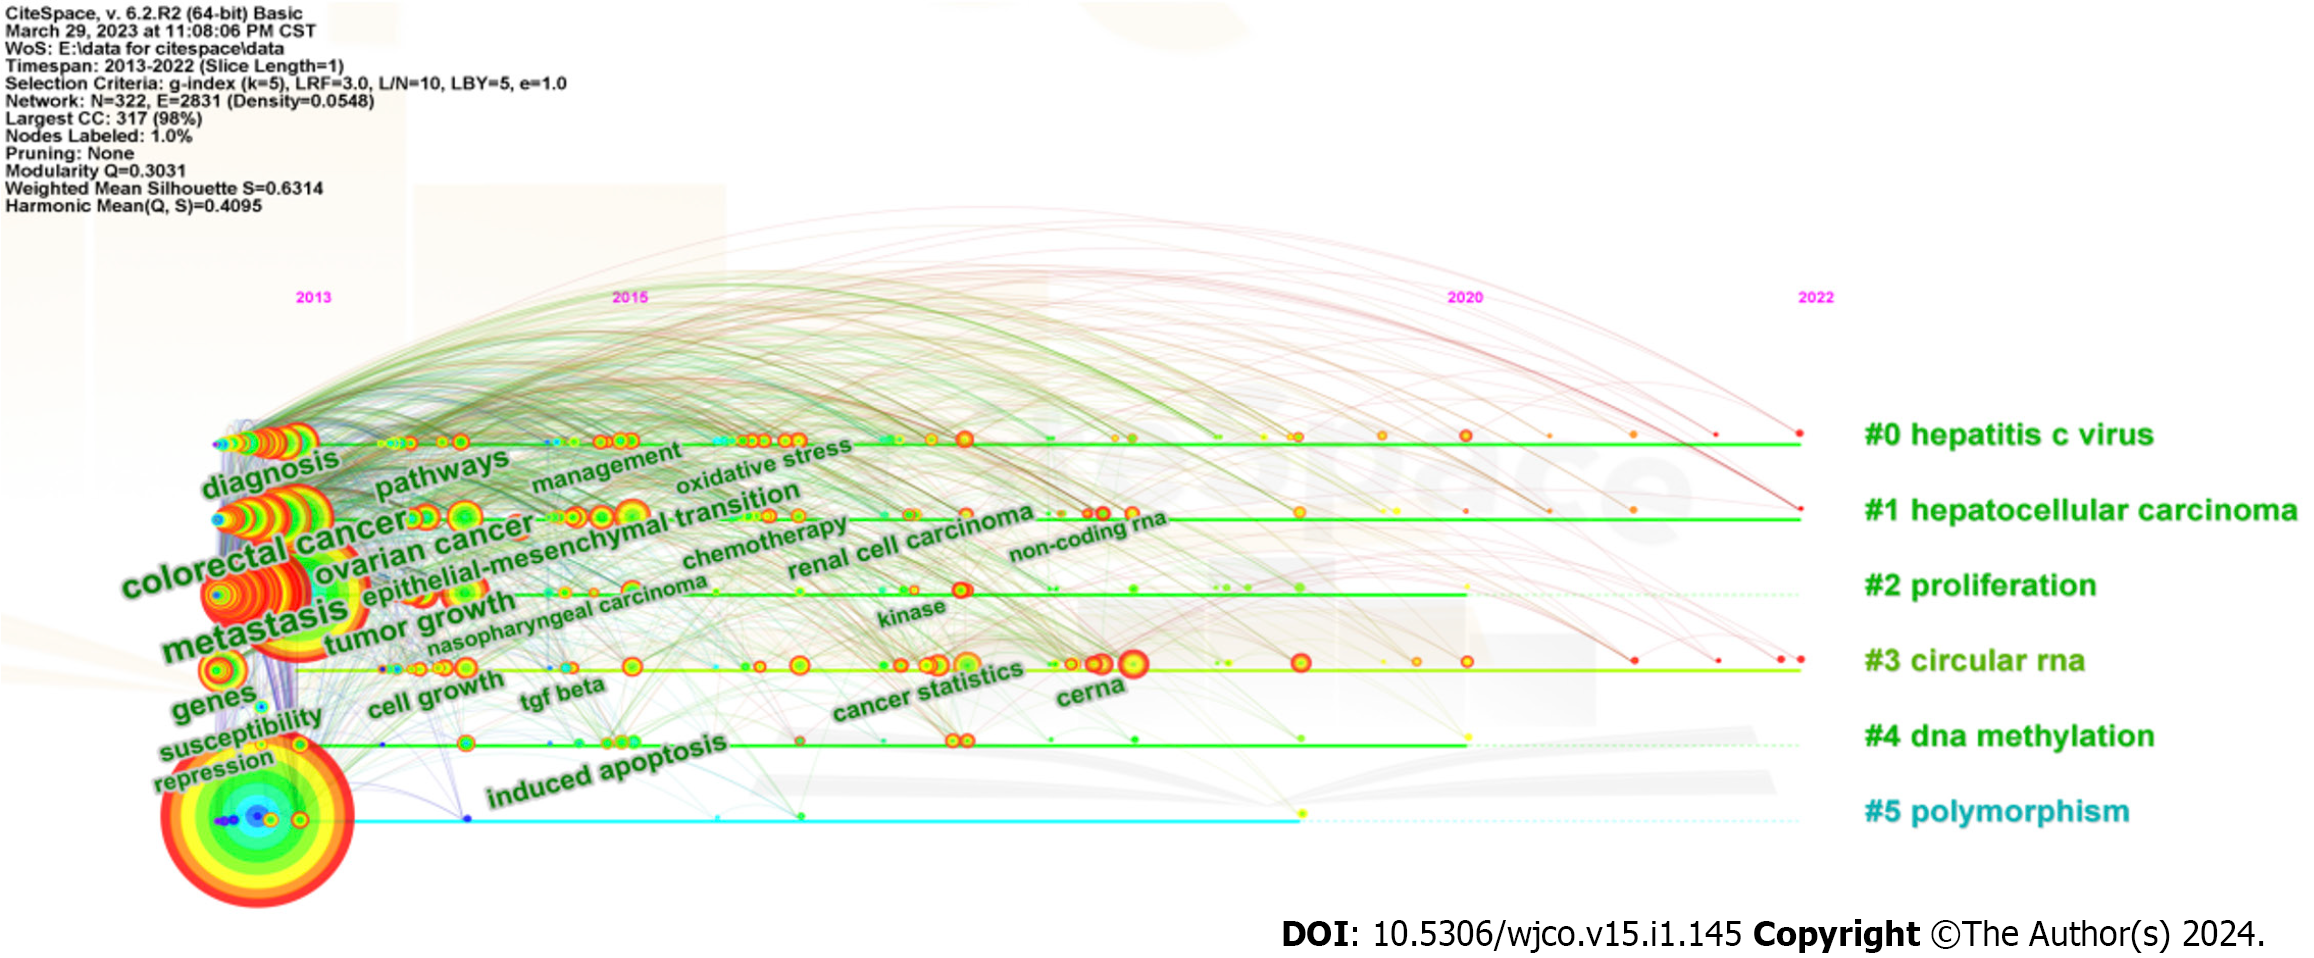
Figure 7 The timeline spectrum of keywords in the research articles related to microRNAs in hepatocellular carcinoma.
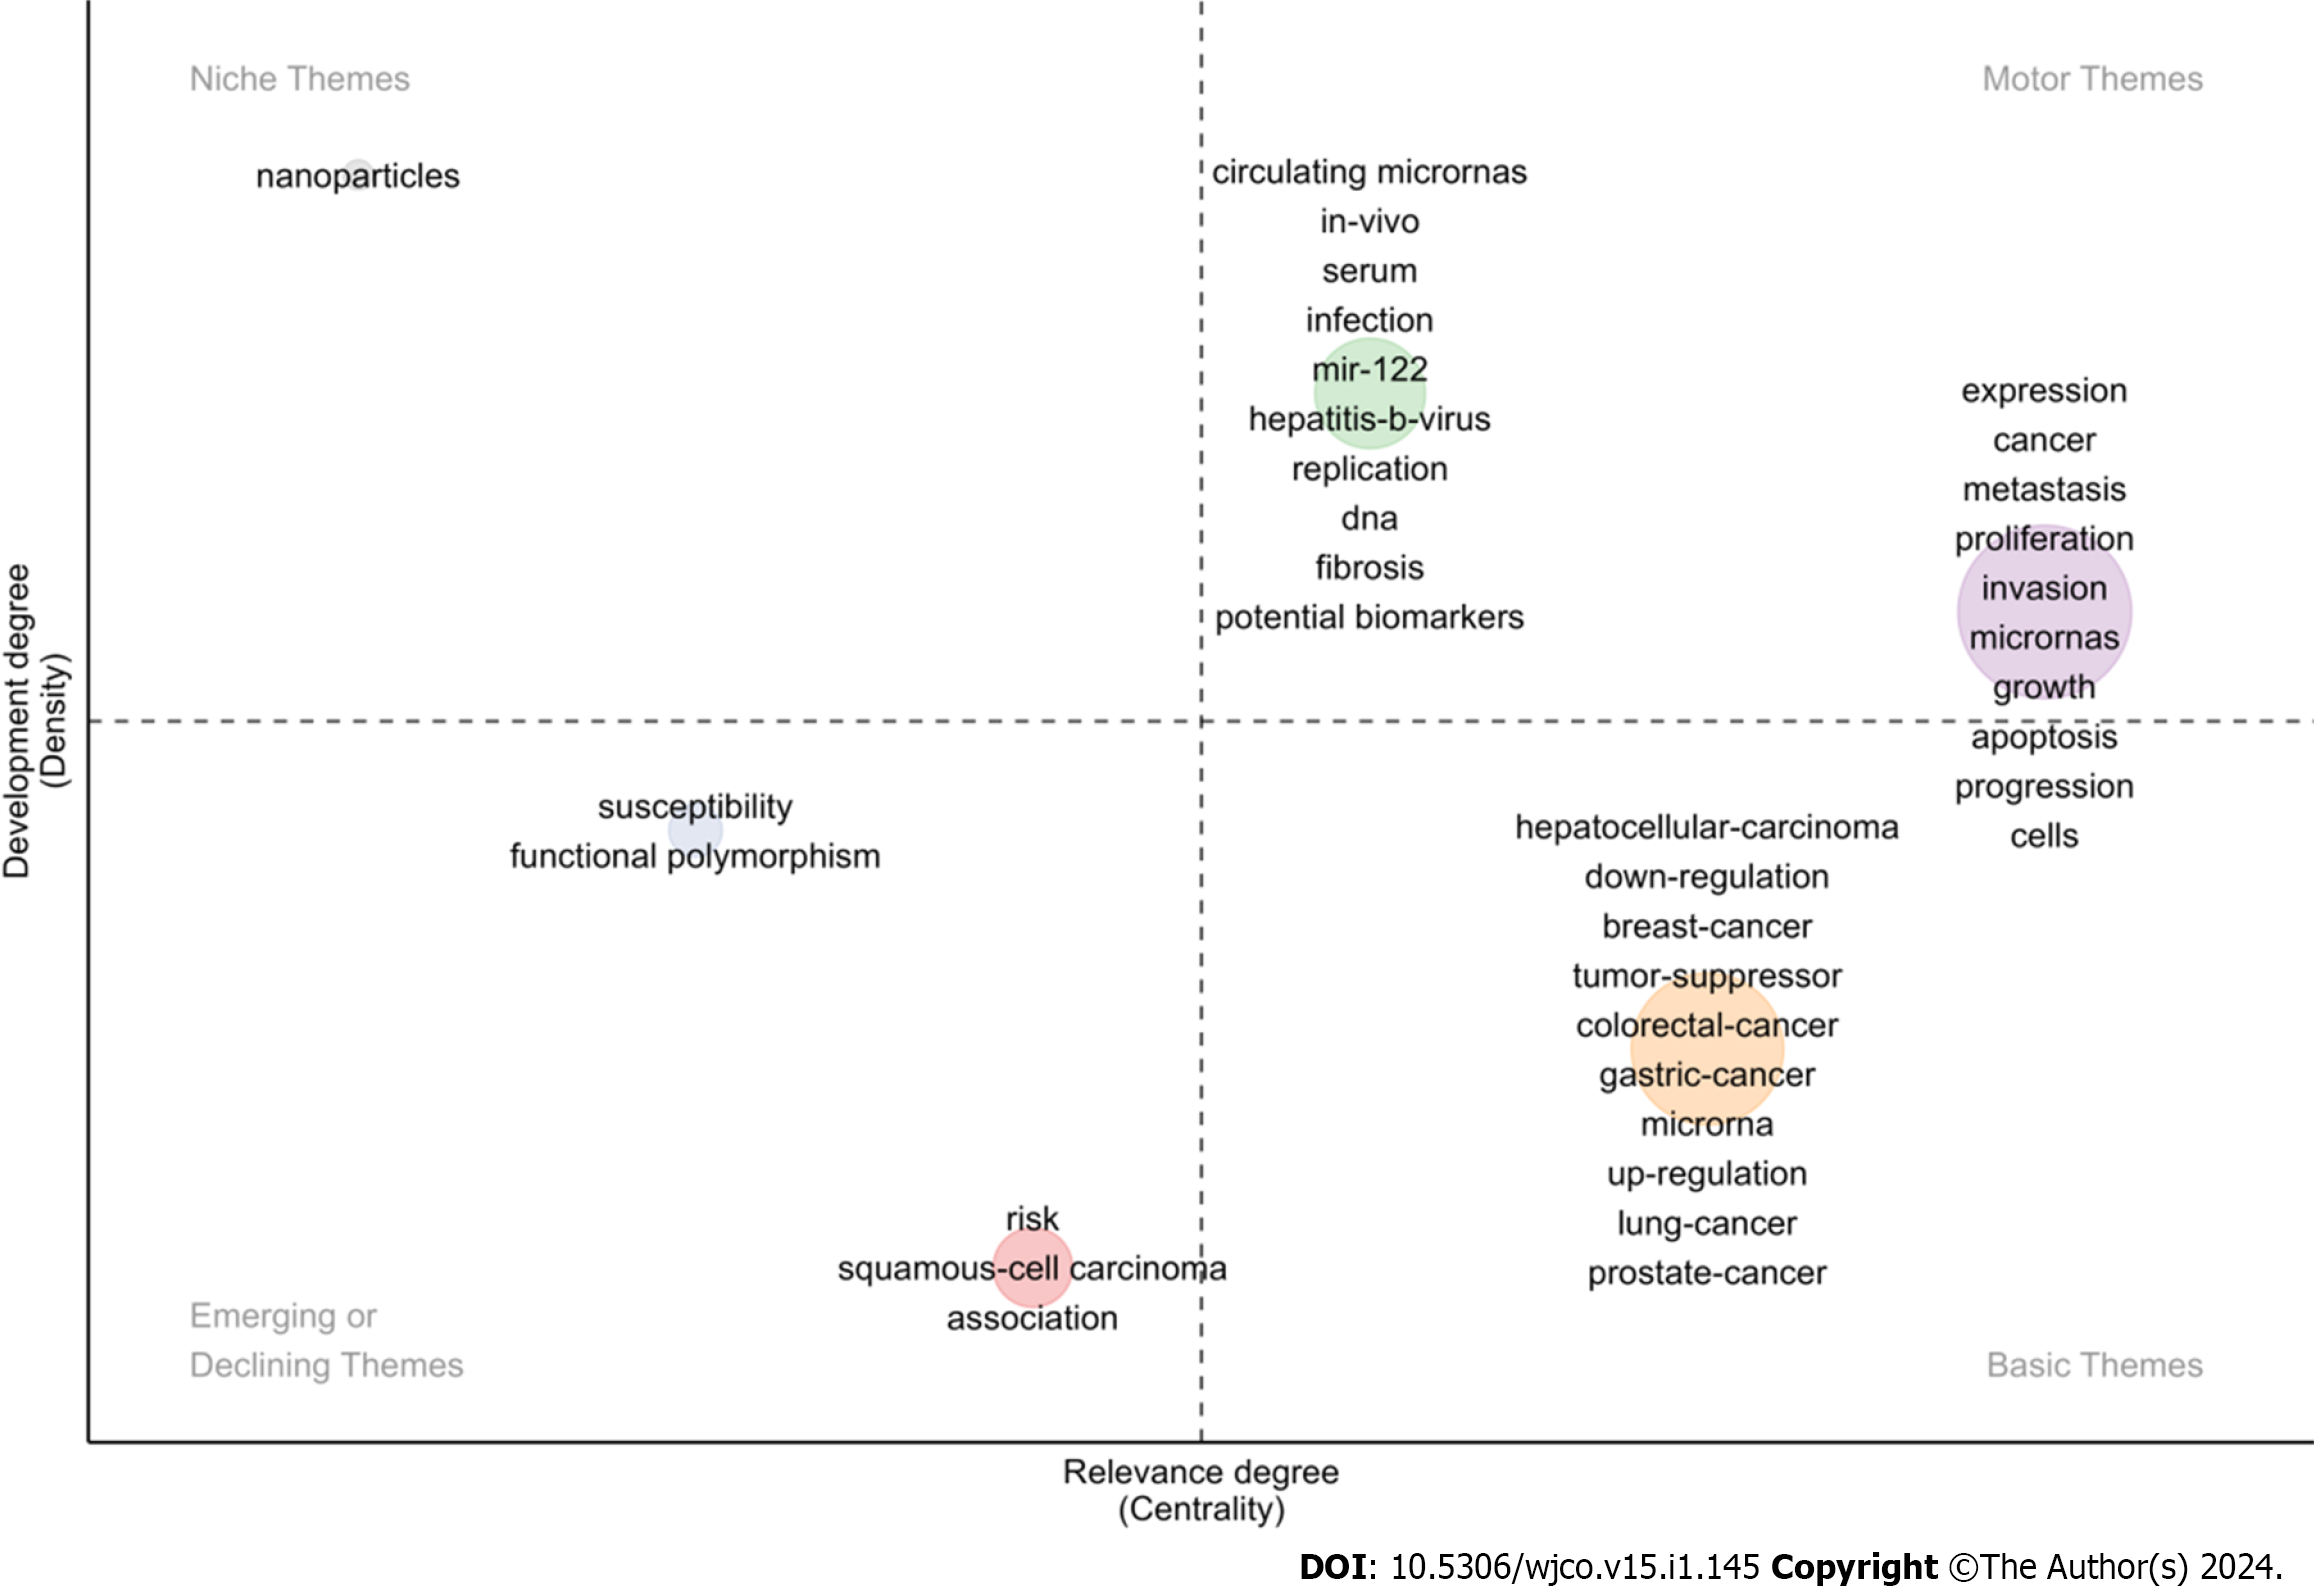
Figure 8 Thematic map of keywords in the research articles related to microRNAs in hepatocellular carcinoma.
- Citation: Zhang L, Chen ZY, Wei XX, Li JD, Chen G. What are the changes in the hotspots and frontiers of microRNAs in hepatocellular carcinoma over the past decade? World J Clin Oncol 2024; 15(1): 145-158
- URL: https://www.wjgnet.com/2218-4333/full/v15/i1/145.htm
- DOI: https://dx.doi.org/10.5306/wjco.v15.i1.145


