Copyright
©The Author(s) 2024.
World J Clin Oncol. Jan 24, 2024; 15(1): 130-144
Published online Jan 24, 2024. doi: 10.5306/wjco.v15.i1.130
Published online Jan 24, 2024. doi: 10.5306/wjco.v15.i1.130
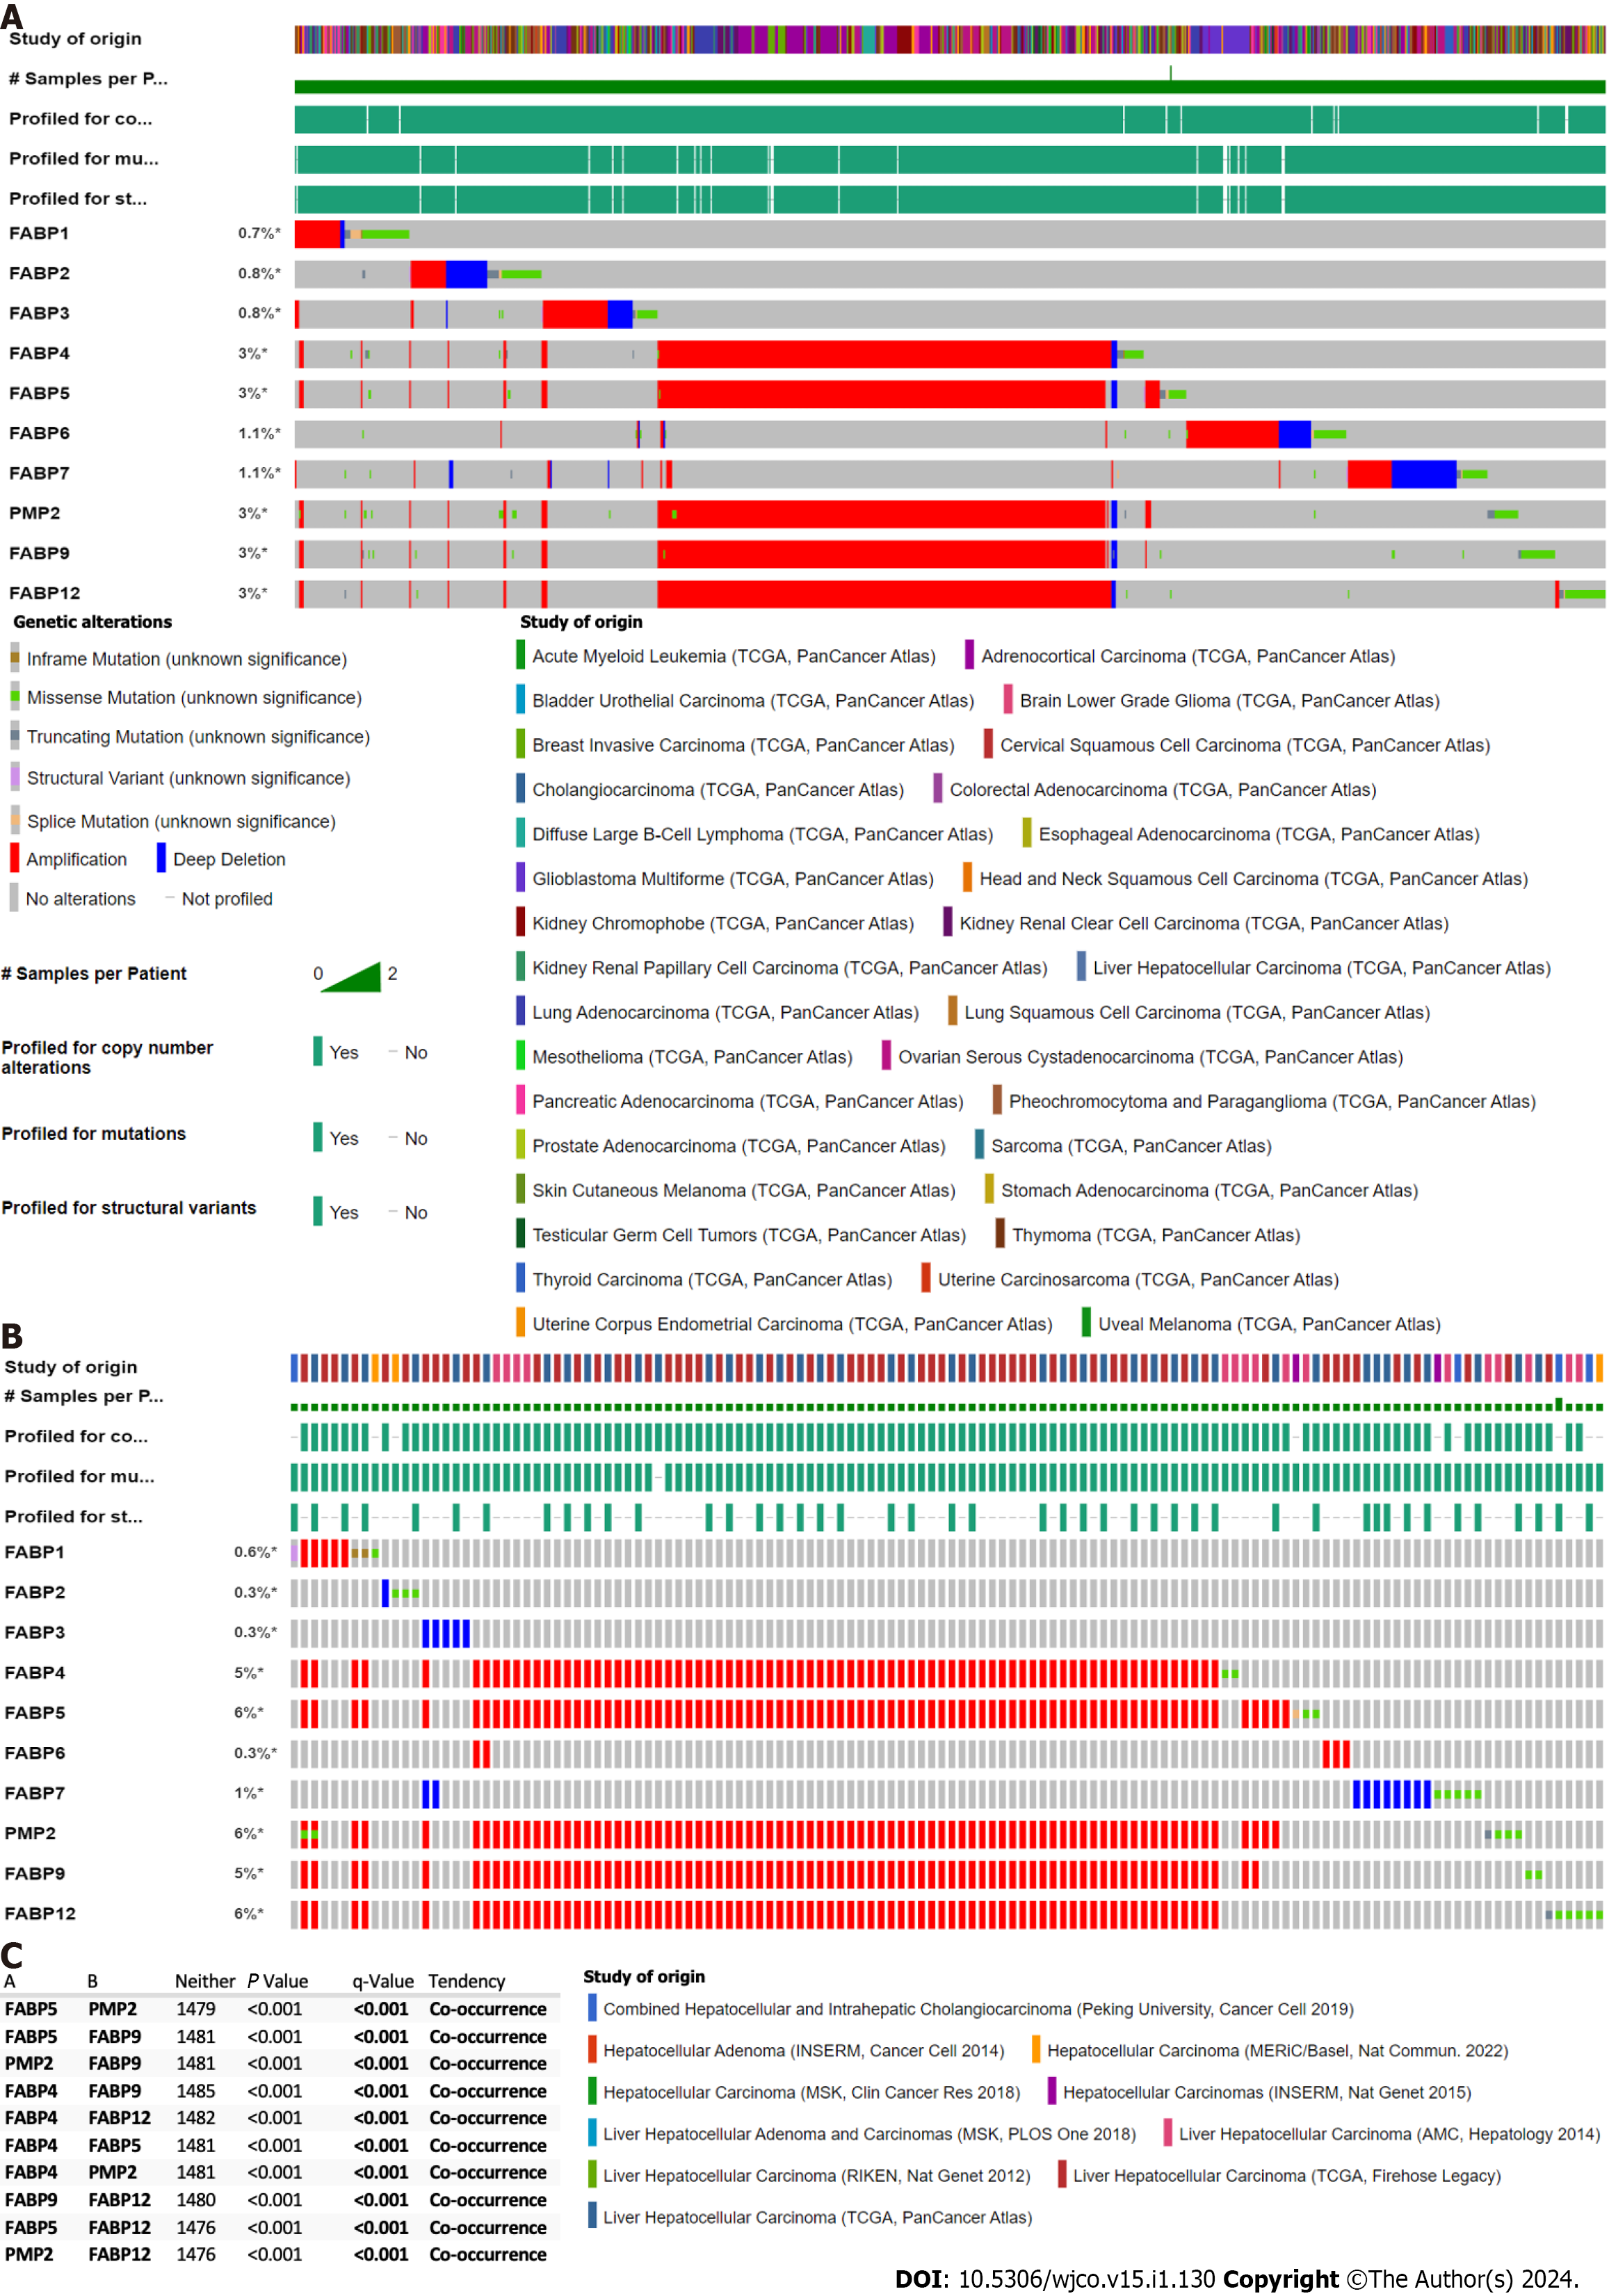
Figure 1 Genetic alternation of FABP family members in various cancer types.
A-B: Genetic alternation of each FABP family member (FABP1, FABP2, FABP3, FABP4, FABP5, FABP6, FABP7, PMP2, FABP9 and FABP12) in pan-cancer types (70655 samples from 217 non-redundant studies) (A) and in various liver cancer subtypes (1829 samples from eleven studies) (B) using The Cancer Genome Atlas datasets. The mutation frequency for each FABP gene was shown next to the gene name; C: Co-occurrence of genetic alternation of the gene loci of FABP family members in liver cancer.
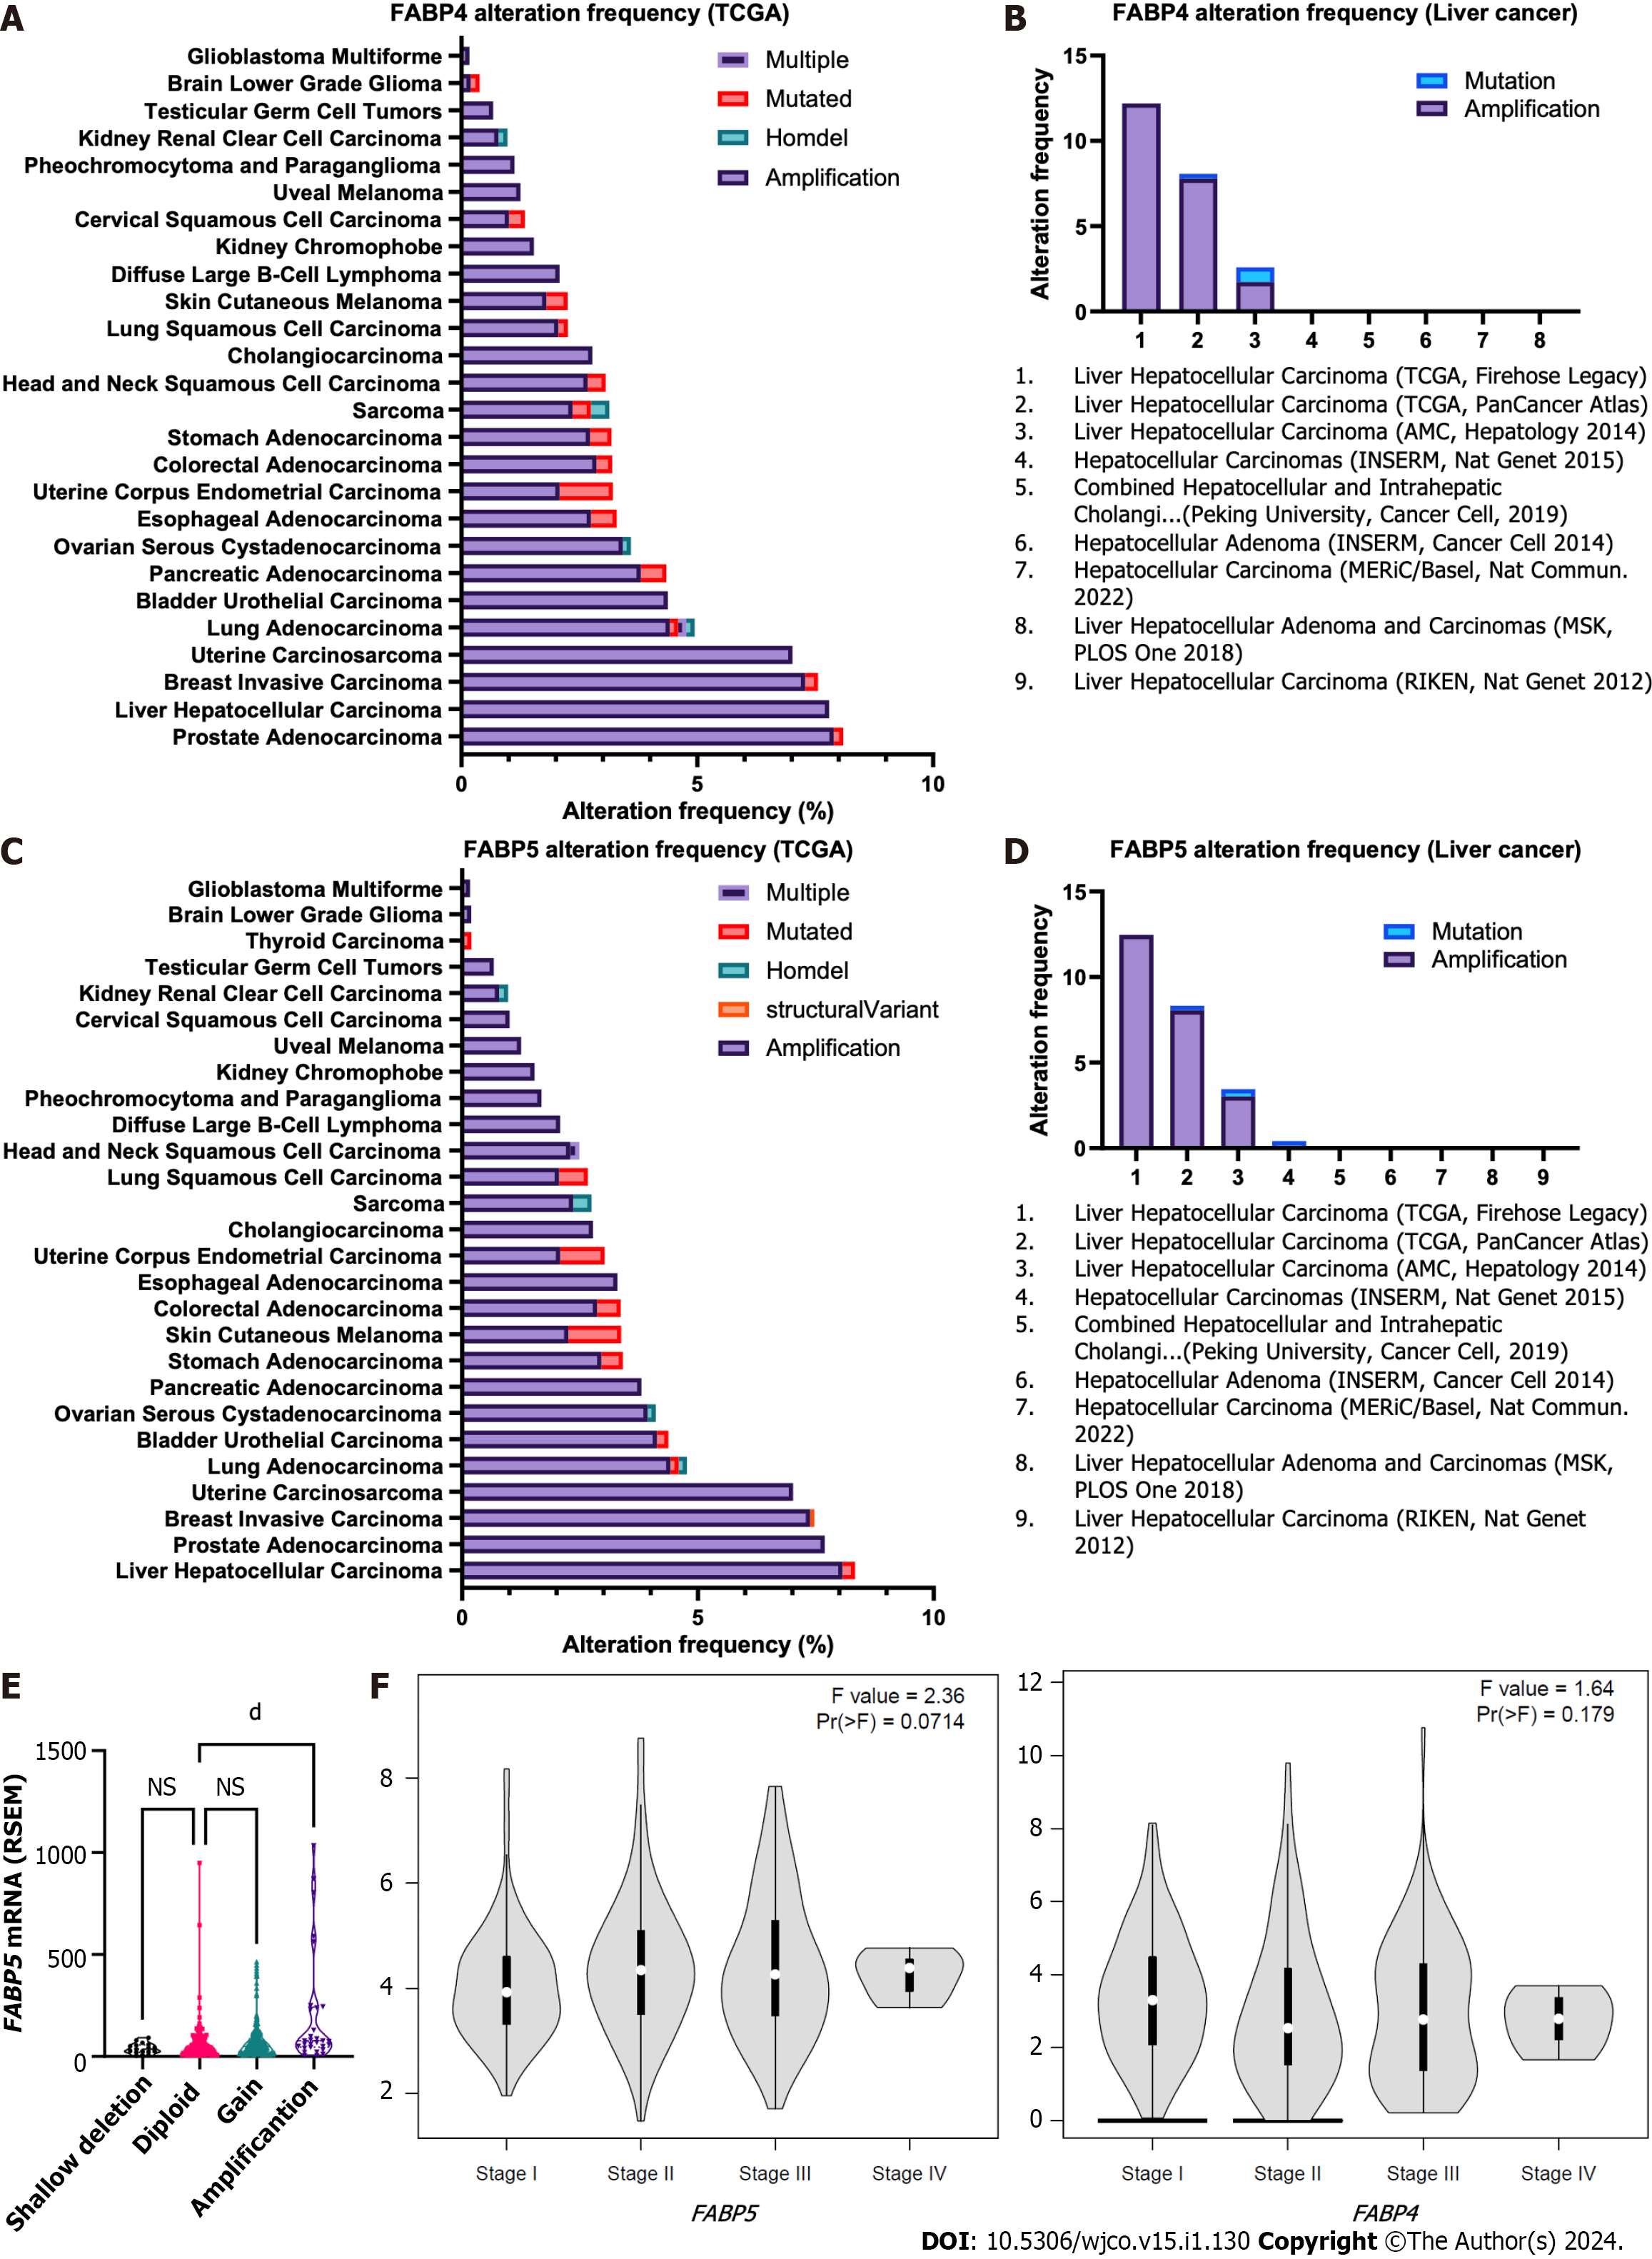
Figure 2 Frequencies of genetic alternations and expression of FABP4 and FABP5 in various cancer types.
A-B: Frequencies of genetic alternations of FABP4 in major cancer types using The Cancer Genome Atlas (TCGA) datasets via cBioportal (A) and in various liver cancer subtypes (B) using TCGA datasets via cBioportal; C-D: Frequencies of genetic alternations of FABP5 in pan-cancer types (C) and in various liver cancer subtypes (D) using TCGA datasets via cBioportal; E: FABP5 expression in liver cancer with different FABP5 genetic alteration types using TCGA datasets via cBioportal; F: Expression of FABP5 (left panel) and FABP4 (right panel) in liver cancer at stage I-IV using TCGA datasets via GEPIA2 portal. dP < 0.0001; NS: Not significant.
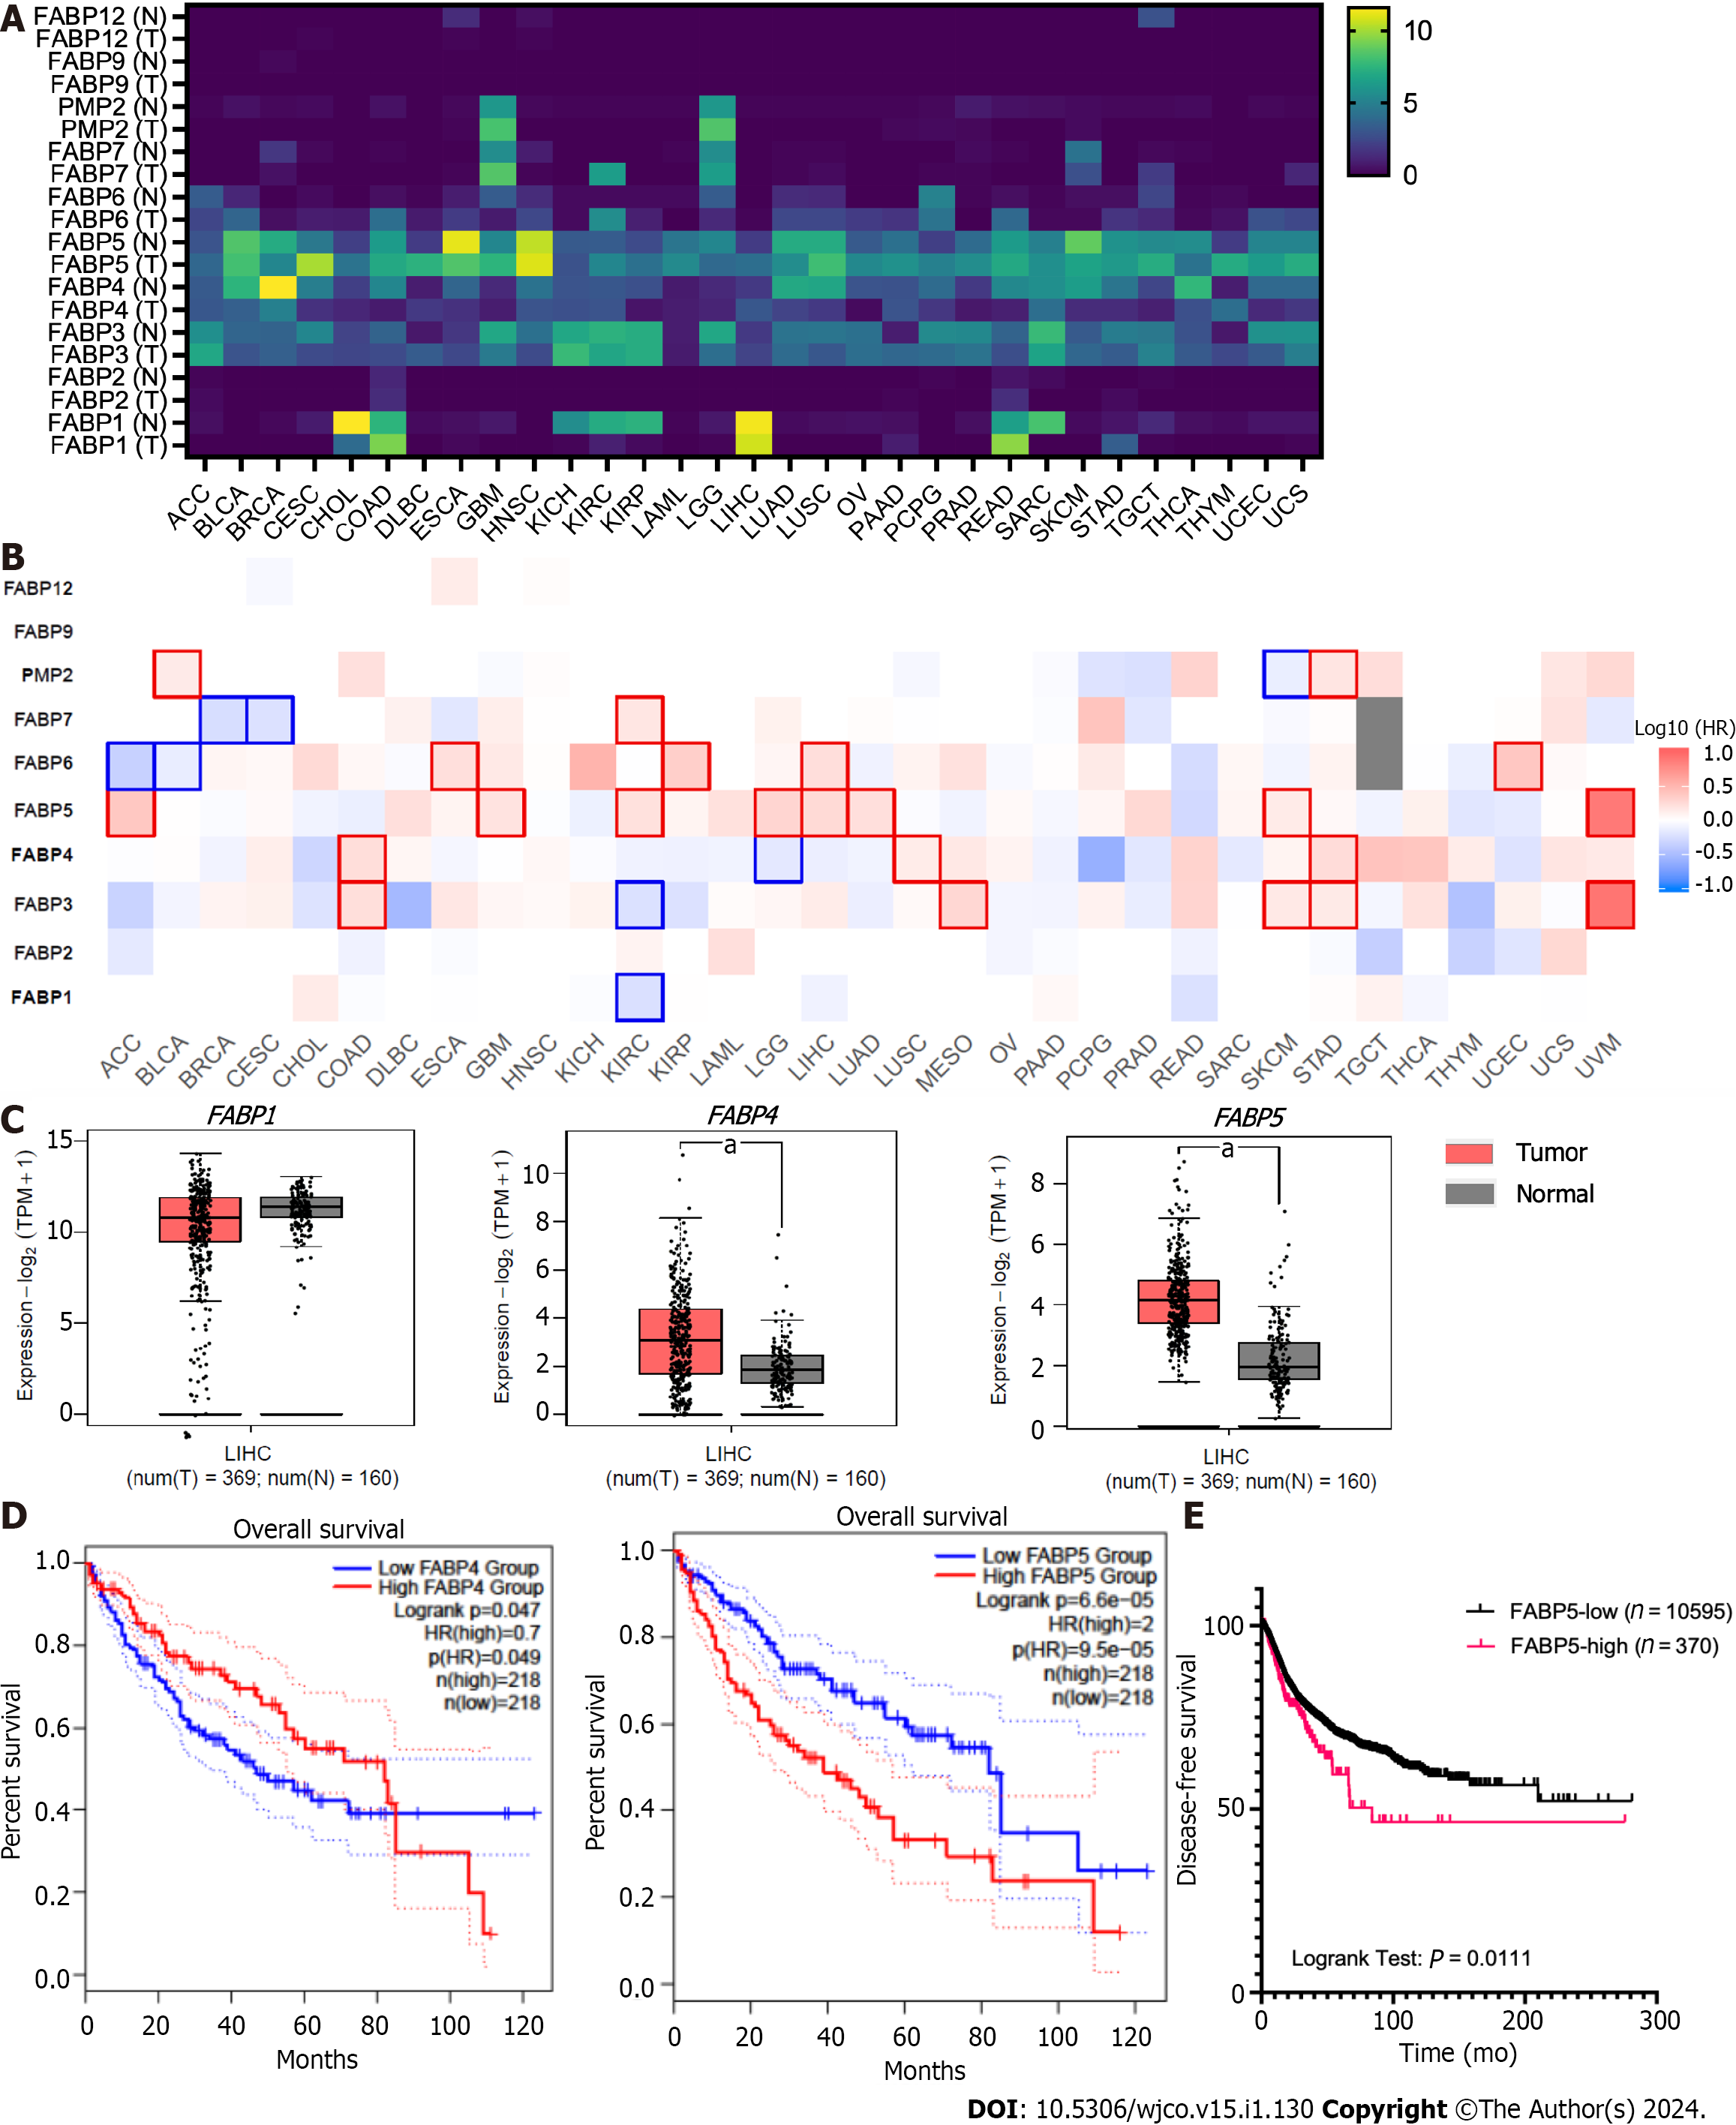
Figure 3 Expression of FABP family members in tumor tissues and non-tumor tissue control in various cancer types.
A-B: Expression of each FABP family member (FABP1, FABP2, FABP3, FABP4, FABP5, FABP6, FABP7, PMP2, FABP9 and FABP12) in tumor tissues and non-tumor tissue control in various cancer types (A) and statistical significance when comparing their expression in tumor tissues with non-tumor tissue control (B) using GEPIA2 portal; C: Higher expression of FABP4 and FABP5, but not FABP1, was observed in liver tumor tissues comparing to non-tumor tissue control; D-E: High expression levels of FABP5, but not FABP1 or FABP4, in liver cancer correlate with overall patient survival (D) and disease-free survival (E). aP < 0.05.
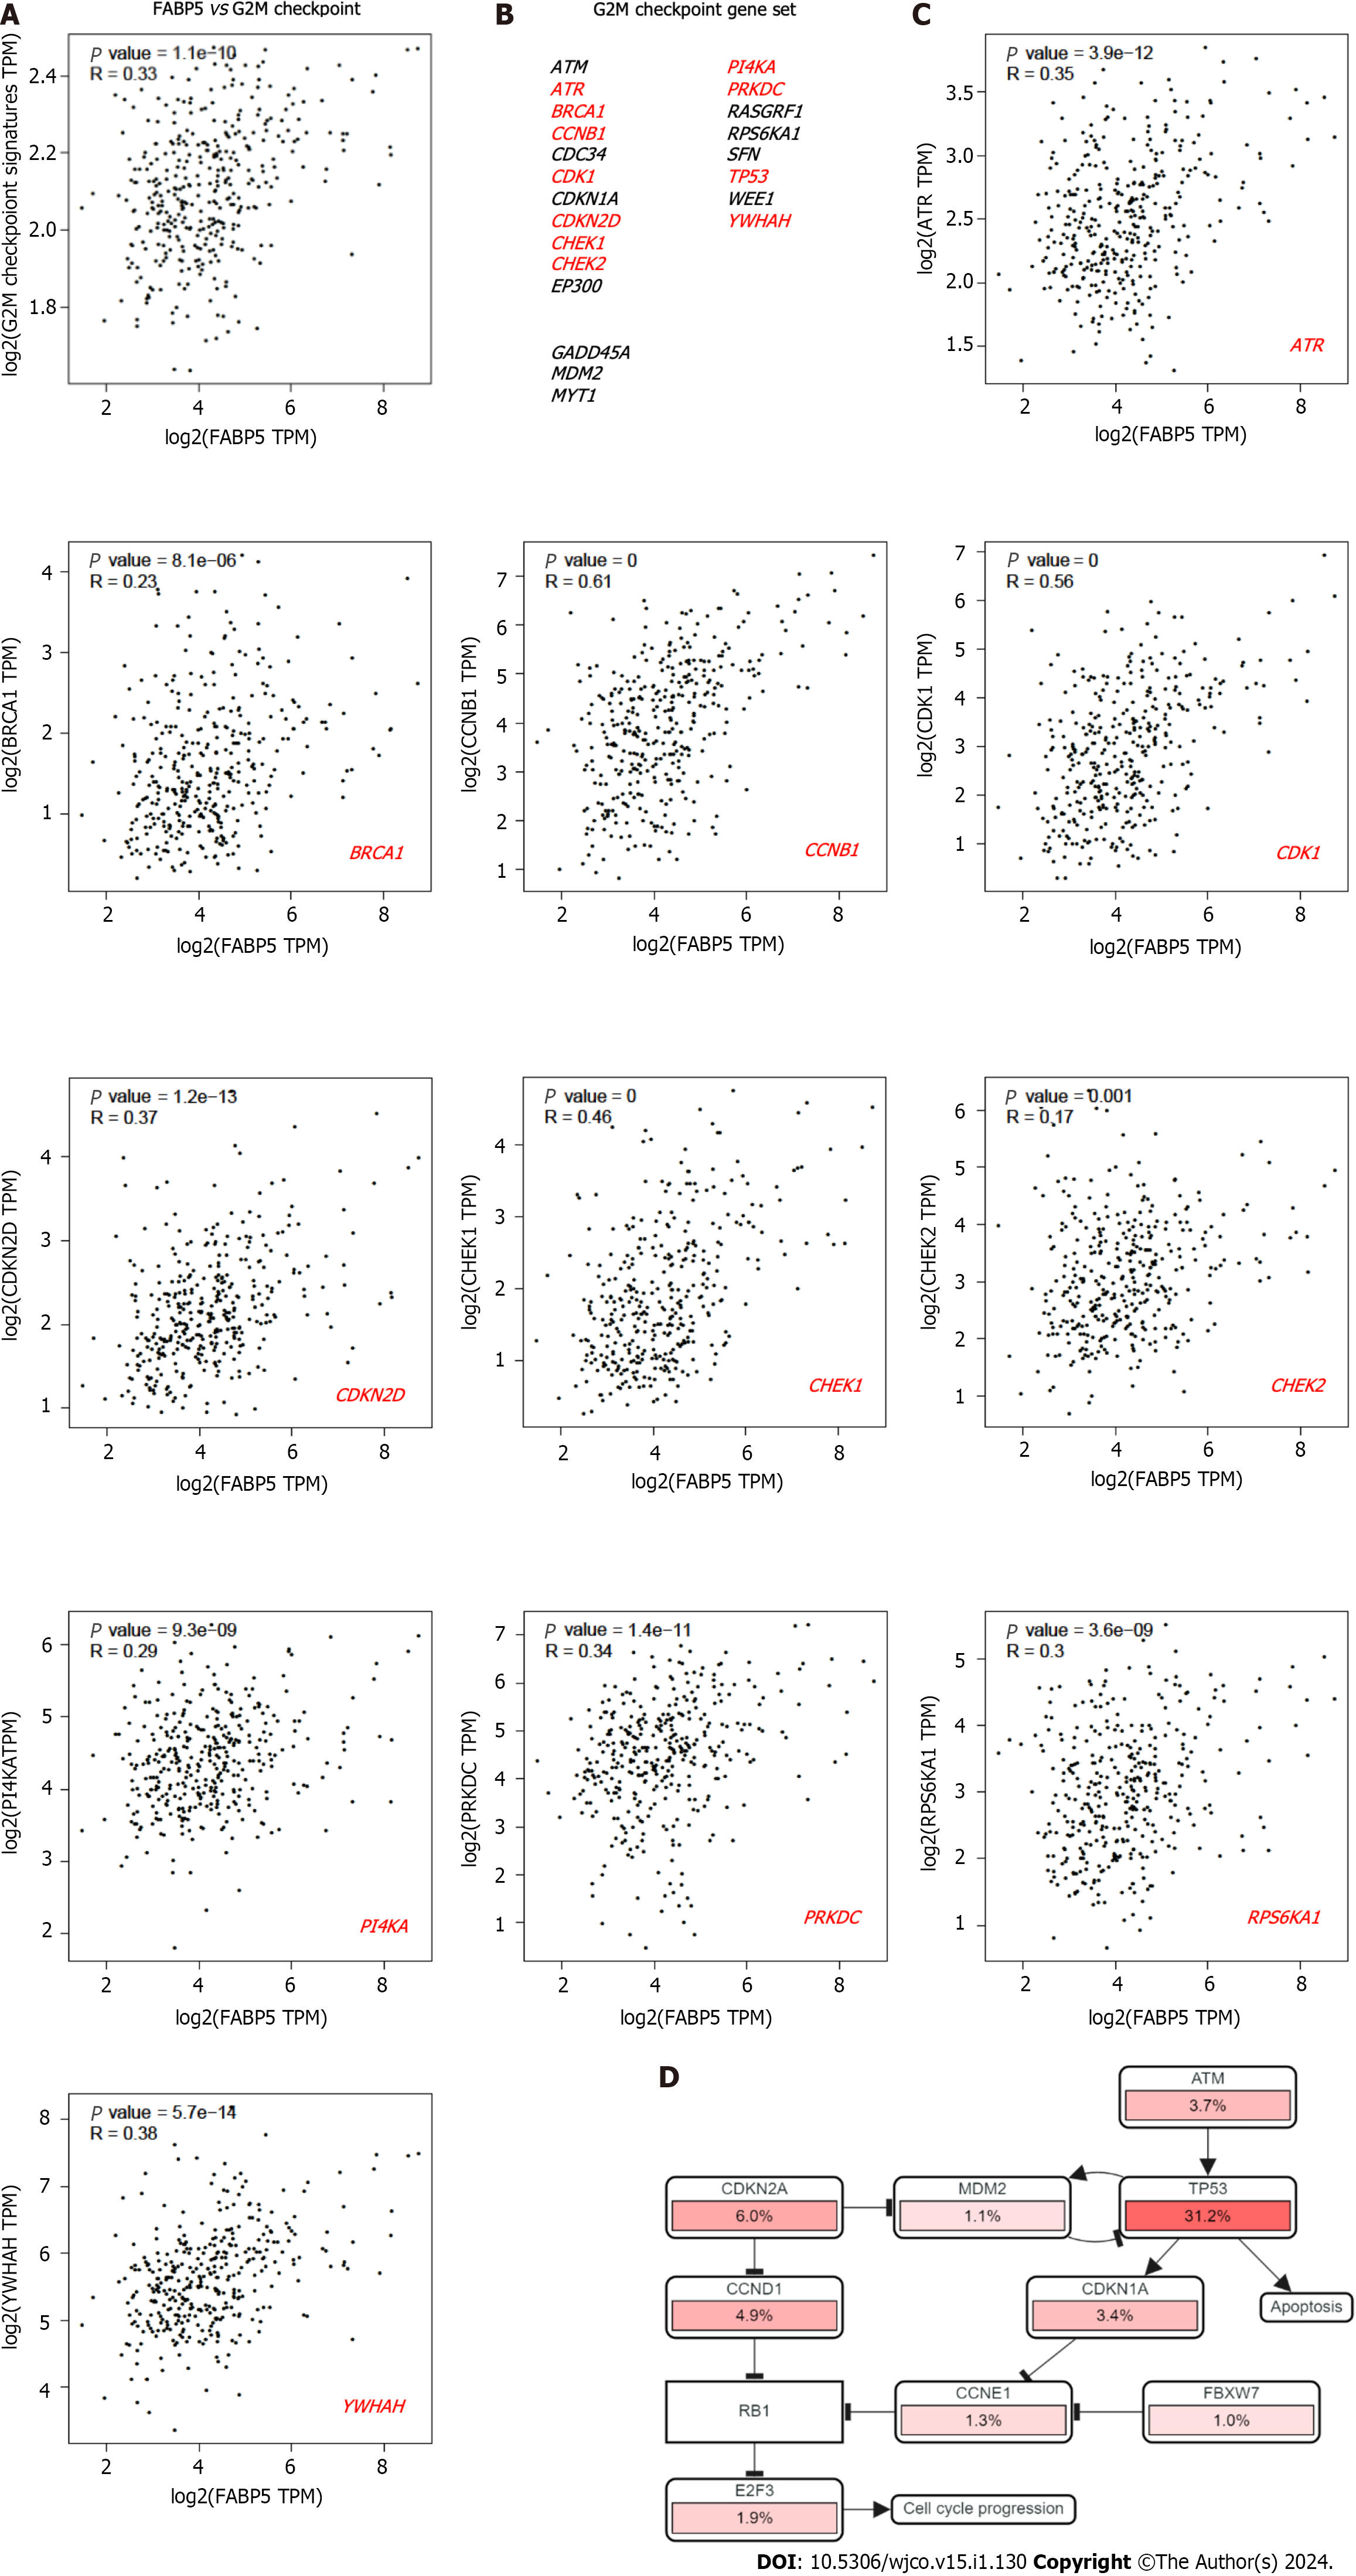
Figure 4 Expression of FABP5 correlates with cancer hallmark G2M checkpoint and genes within.
A: FABP5 positively correlated with enrichment of cancer hallmark G2M checkpoint in patients with liver hepatocellular carcinoma (LIHC); B: Gene list included in the cancer hallmark G2M checkpoint. The genes that showed positive correlation with FABP5 are highlighted in red (P < 0.01); C: Highlighted genes in the G2M checkpoint gene set positively correlate with FABP5 expression in patients with LIHC. P values show the statistical significance of the correlation; R values indicate the correlation coefficient; D: Altered expression of individual genes in the G2M checkpoint gene set showed in the context of signaling network. Pink bars show upregulation of gene expression.
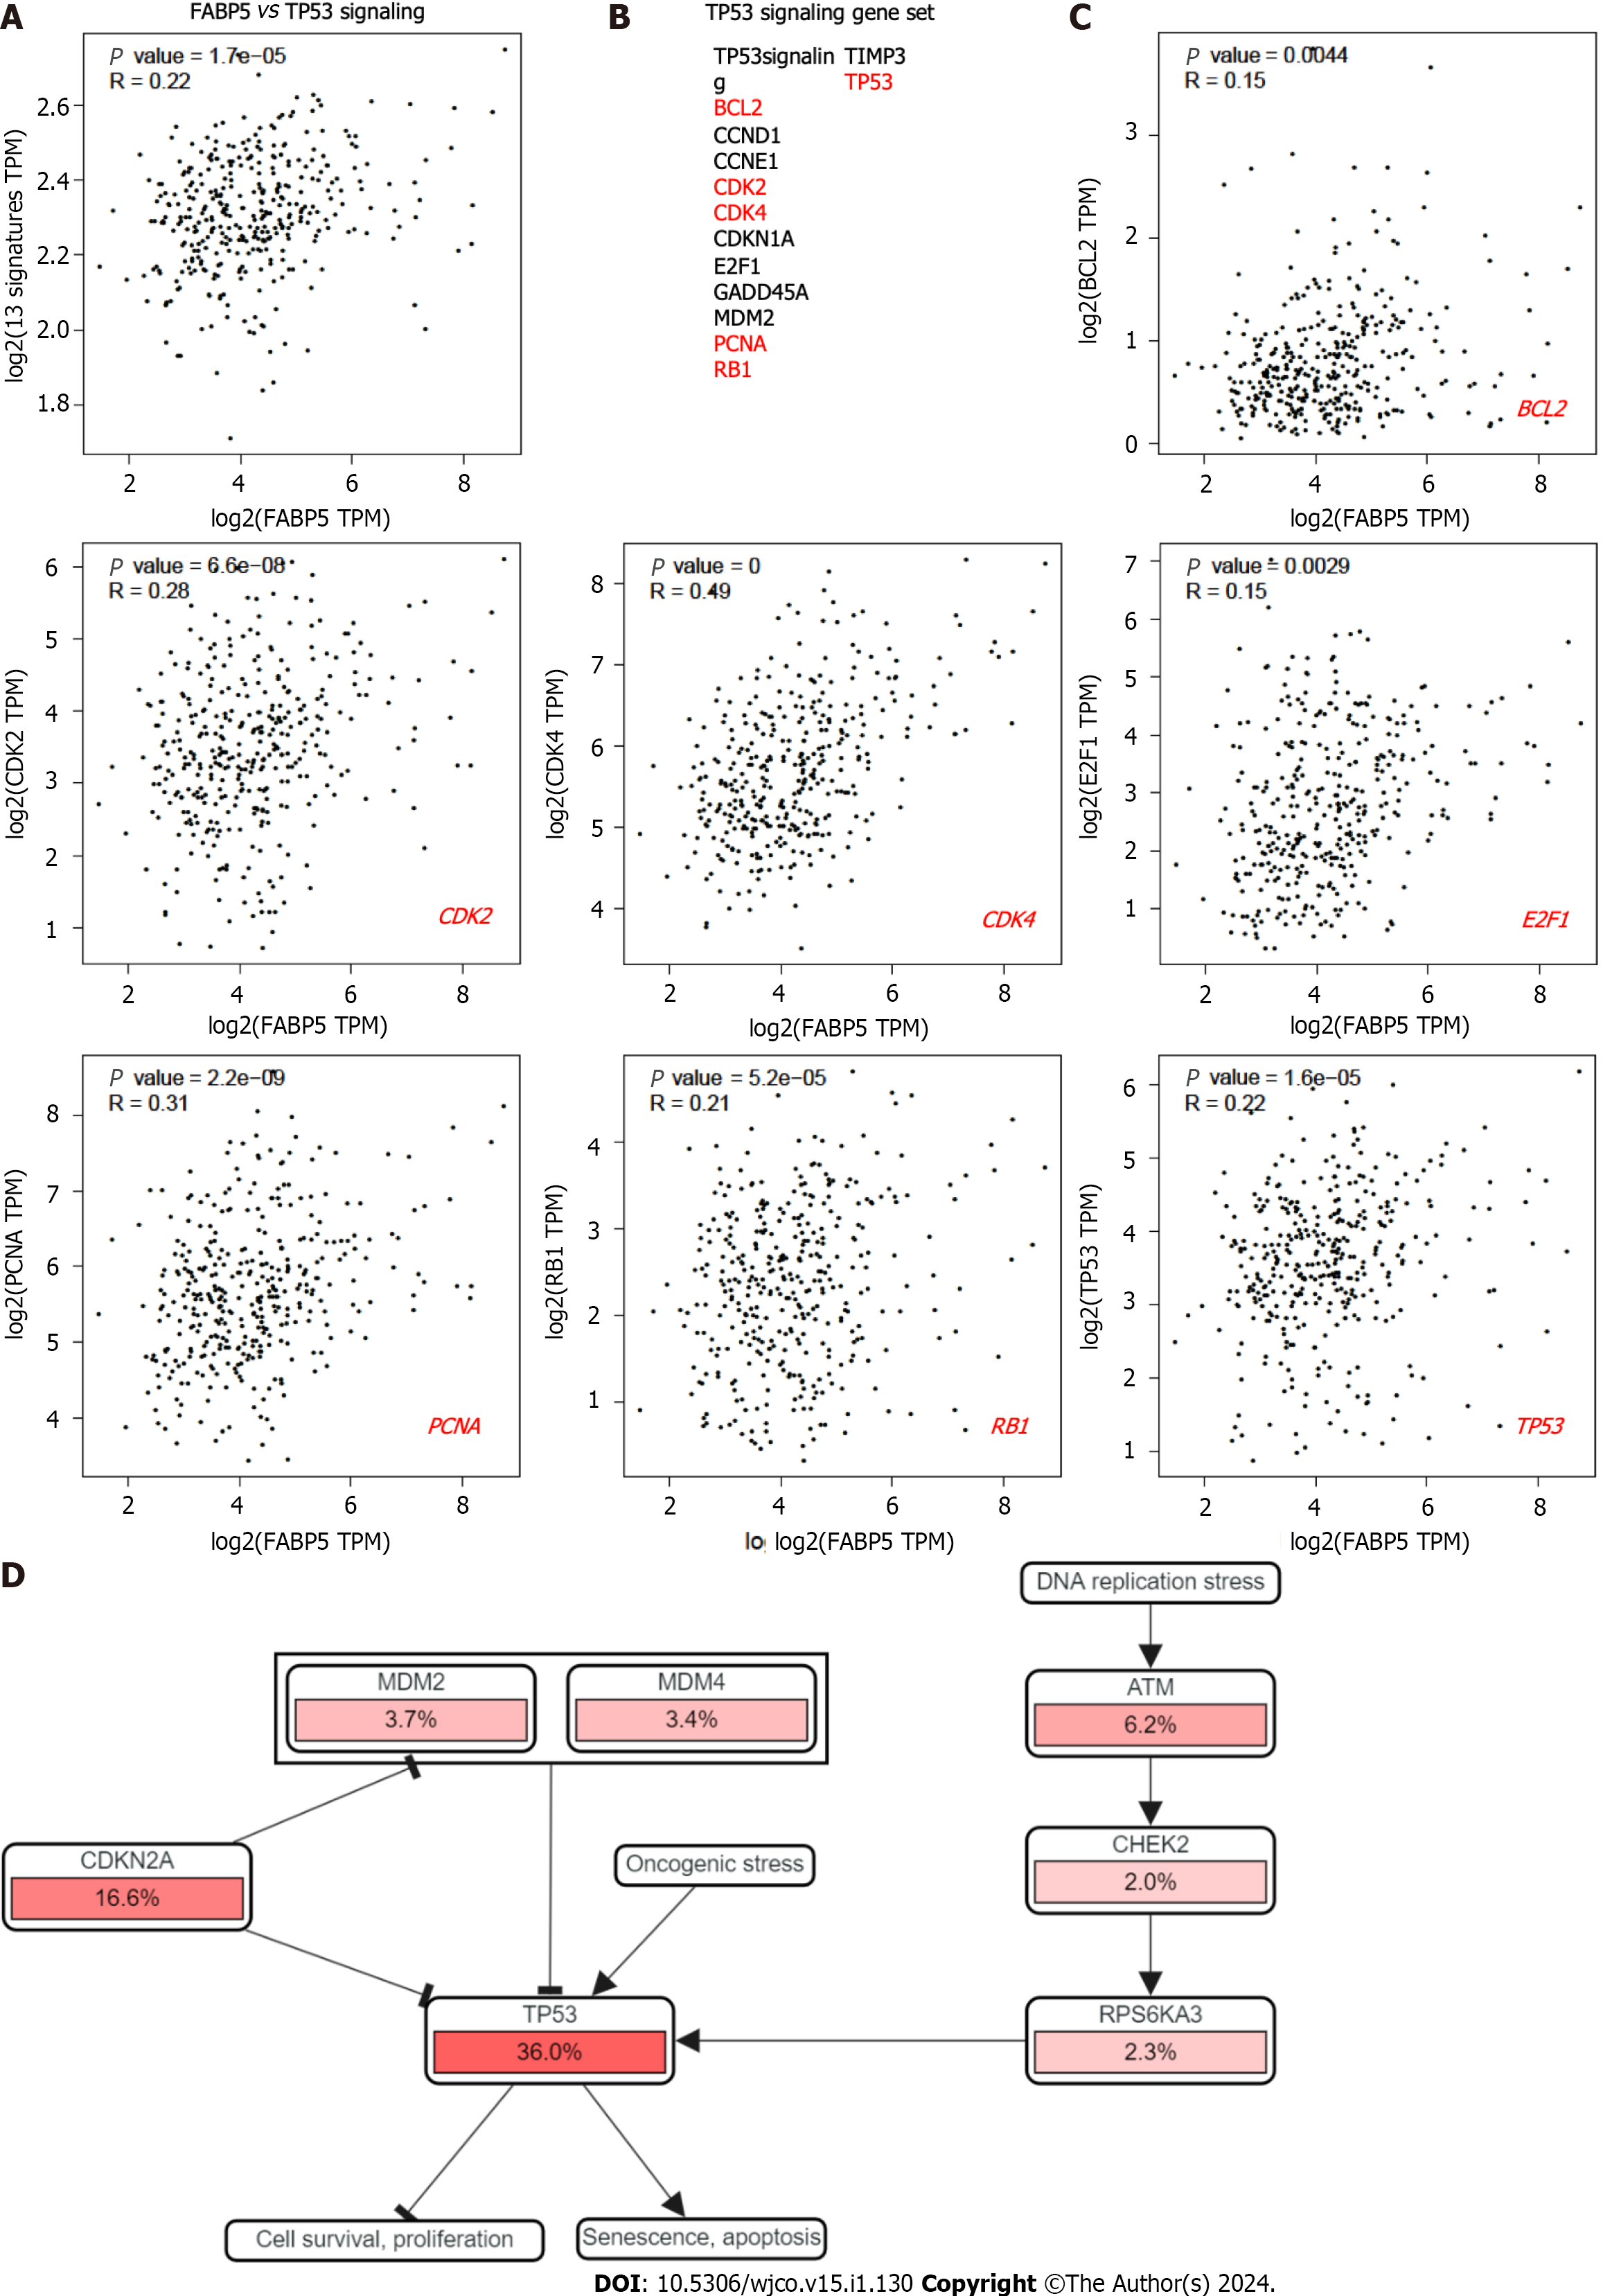
Figure 5 Expression of FABP5 correlates with cancer hallmark TP53 signaling and genes within.
A: FABP5 positively correlated with enrichment of cancer hallmark TP53 signaling in patients with liver hepatocellular carcinoma; B: Gene list included in TP53 signaling. The genes that showed positive correlation with FABP5 are highlighted in red; C: Highlighted genes in the TP53 signaling gene set positively correlate with FABP5 expression. P values show the statistical significance of the correlation; R values show the correlation coefficient; D: Altered expression of individual genes in the TP53 signaling gene set shown in the context of signaling network. Pink bars show upregulation of gene expression.
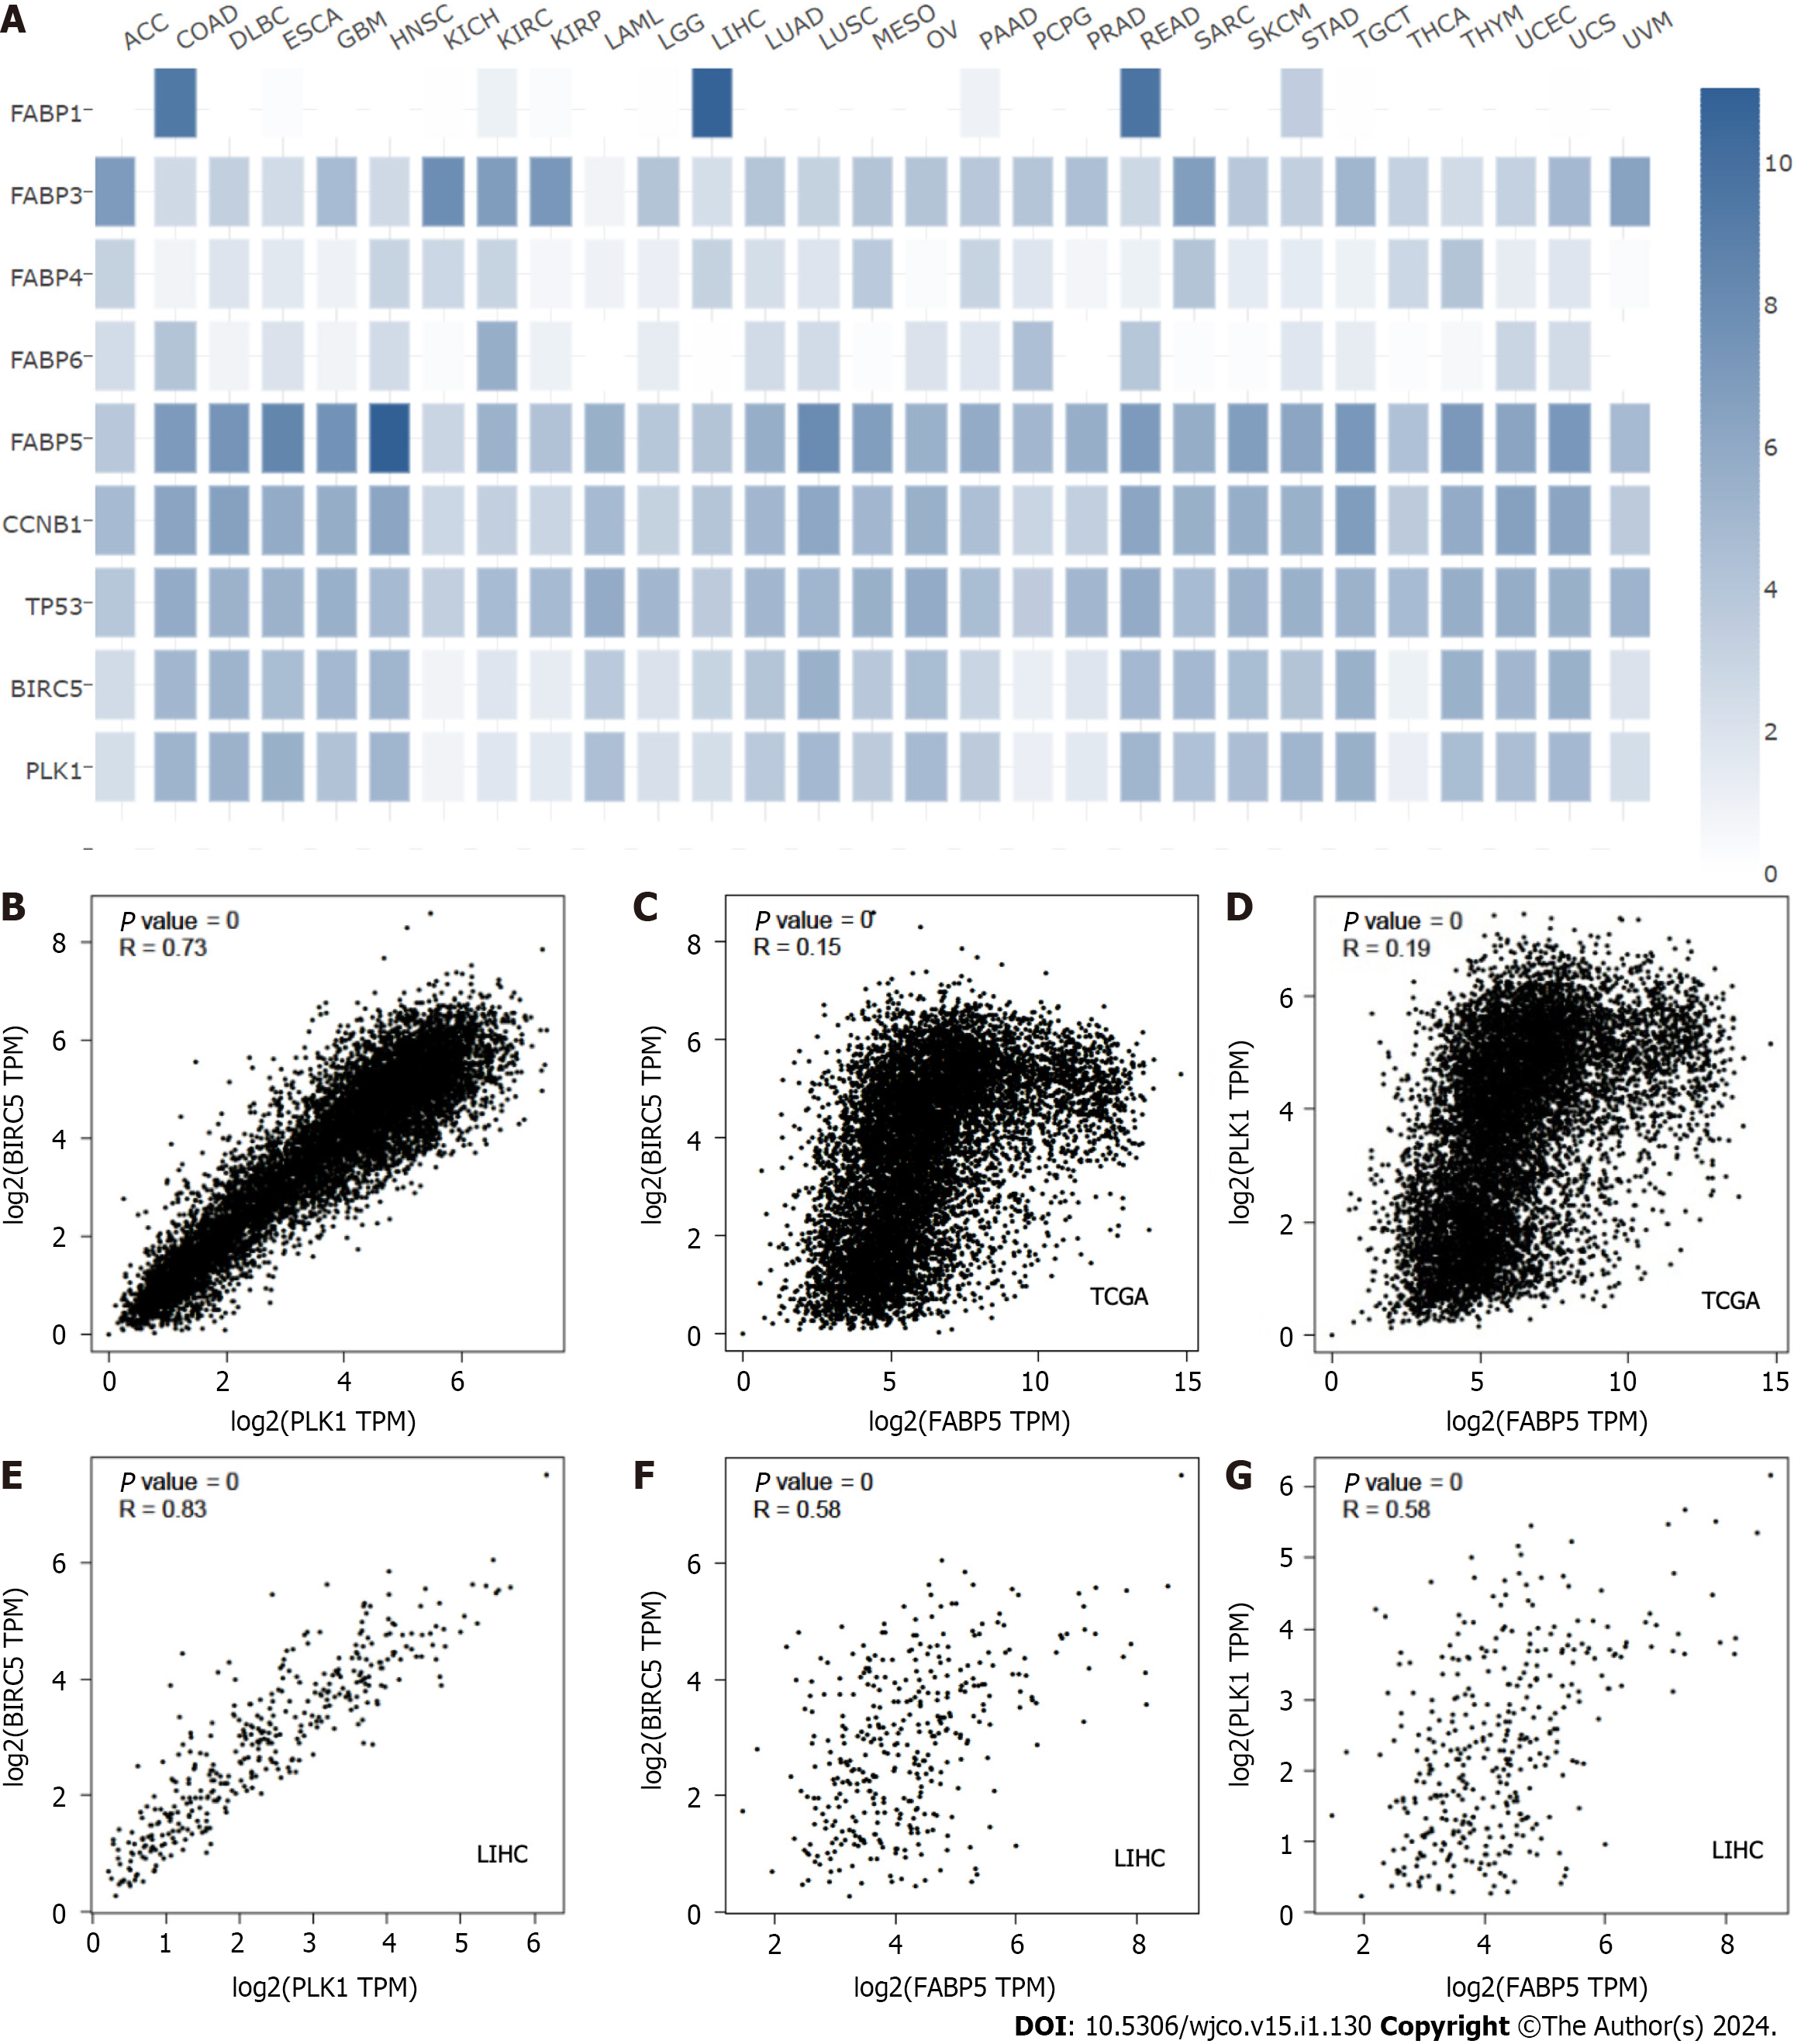
Figure 6 Expression of FABP5 correlates with PLK1 and BIRC5 expression in pan cancer and liver cancer.
A: Expression of FABP5 and other FABP family members as well as several highlighted genes CCNB1, TP53, BIRC5 and PLK1 in each cancer type using GEPIA2 portal; B and C: FABP5 expression positively correlated with expression of BIRC5 at pan cancer (B) and liver cancer (C); D and E: FABP5 expression positively correlated with expression of PLK1 at pan cancer (D) and liver cancer (E); F and G: BIRC5 expression positively correlated with expression of PLK1 at pan cancer (F) and liver cancer (G). P values show the statistical significance of the correlation; R values show the correlation coefficient.
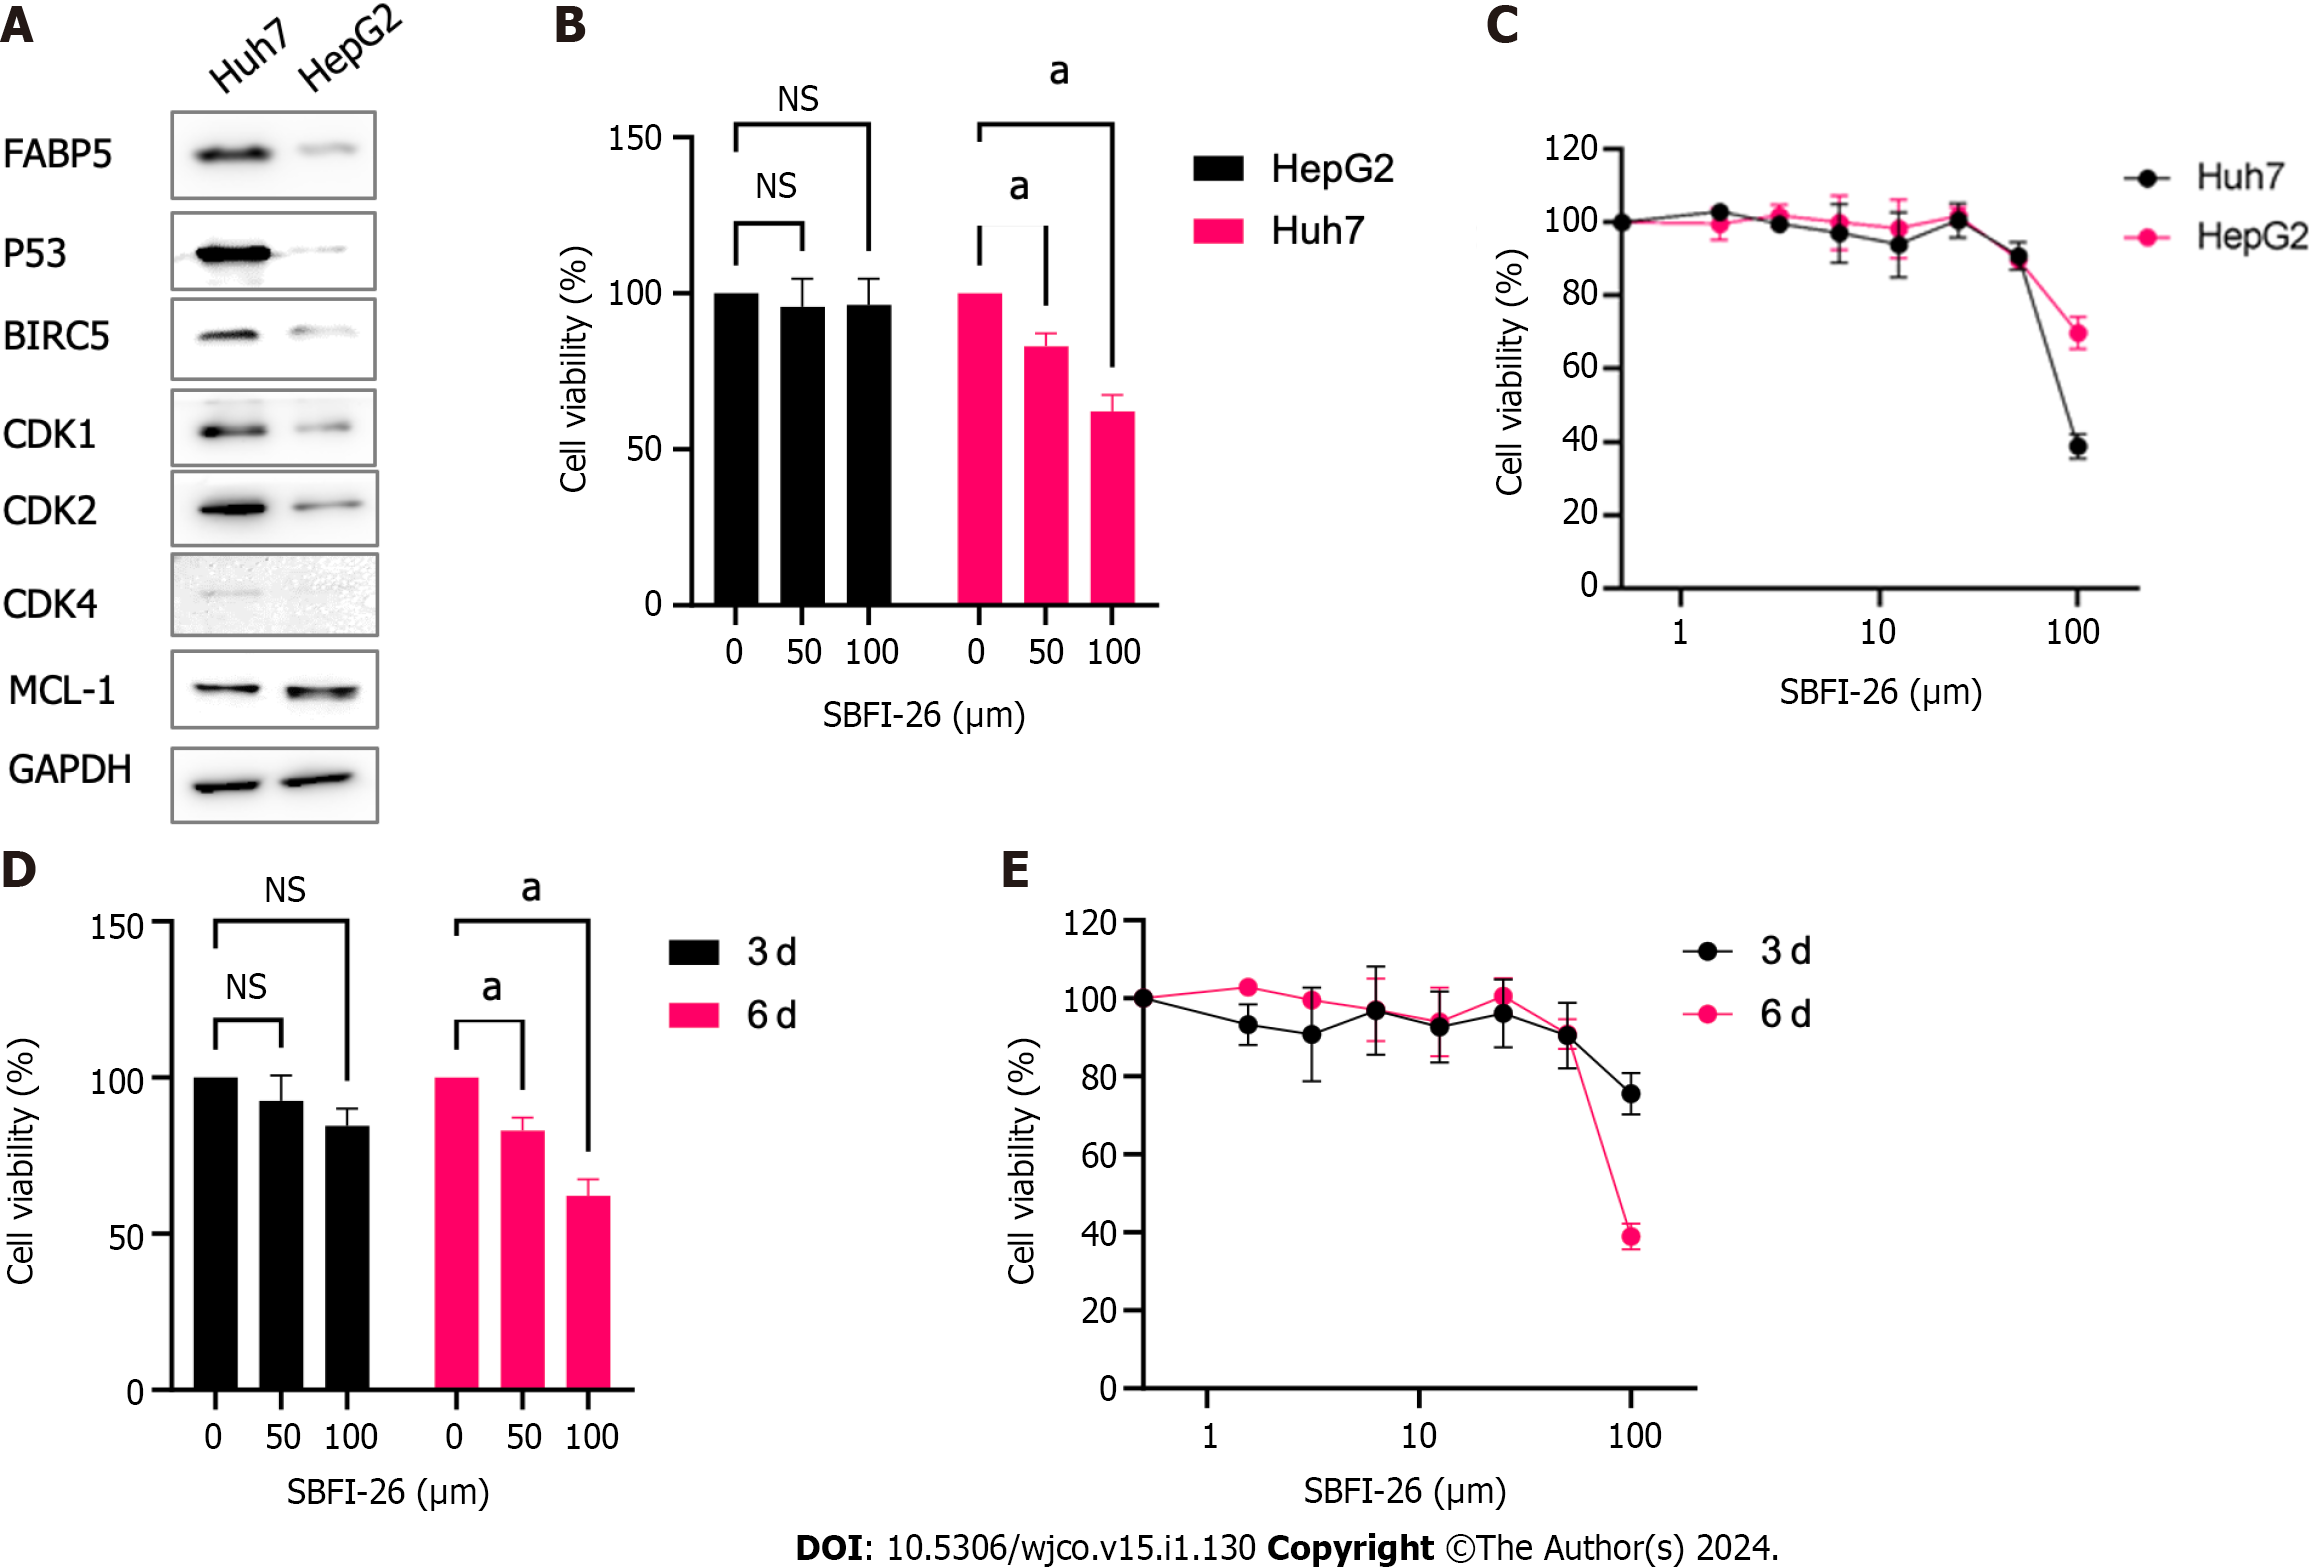
Figure 7 Huh7 cells are sensitive to FABP5 inhibition by SFBI-26.
A: Western blot shows the expression of FABP5, p53, and other proteins in Huh7 and HepG2 cells; B: 3-dose (0, 50 and 100 µmol/L) cell viability assay shows SBFI-26 inhibited the cell viability of hepatocellular carcinoma (HCC) cell lines Huh7 and HepG2 cells post treatment for 6 d; C: 8-dose (2-fold serial doses up to 100 µmol/L) cell viability assay showed SBFI-26 inhibited the cell viability of HCC cell lines post treatment for 6 d; D: 3-dose (0, 50 and 100 µmol/L) cell viability assay shows SBFI-26 inhibited the cell viability of Huh7 cells in time-dependent manner; E: 8-dose cell viability assay showed SBFI-26 inhibited the cell viability of Huh7 cells at 3- and 6-d post treatment; NS: Not significant.
- Citation: Li Y, Lee W, Zhao ZG, Liu Y, Cui H, Wang HY. Fatty acid binding protein 5 is a novel therapeutic target for hepatocellular carcinoma. World J Clin Oncol 2024; 15(1): 130-144
- URL: https://www.wjgnet.com/2218-4333/full/v15/i1/130.htm
- DOI: https://dx.doi.org/10.5306/wjco.v15.i1.130


