Copyright
©The Author(s) 2023.
World J Clin Oncol. Nov 24, 2023; 14(11): 479-503
Published online Nov 24, 2023. doi: 10.5306/wjco.v14.i11.479
Published online Nov 24, 2023. doi: 10.5306/wjco.v14.i11.479
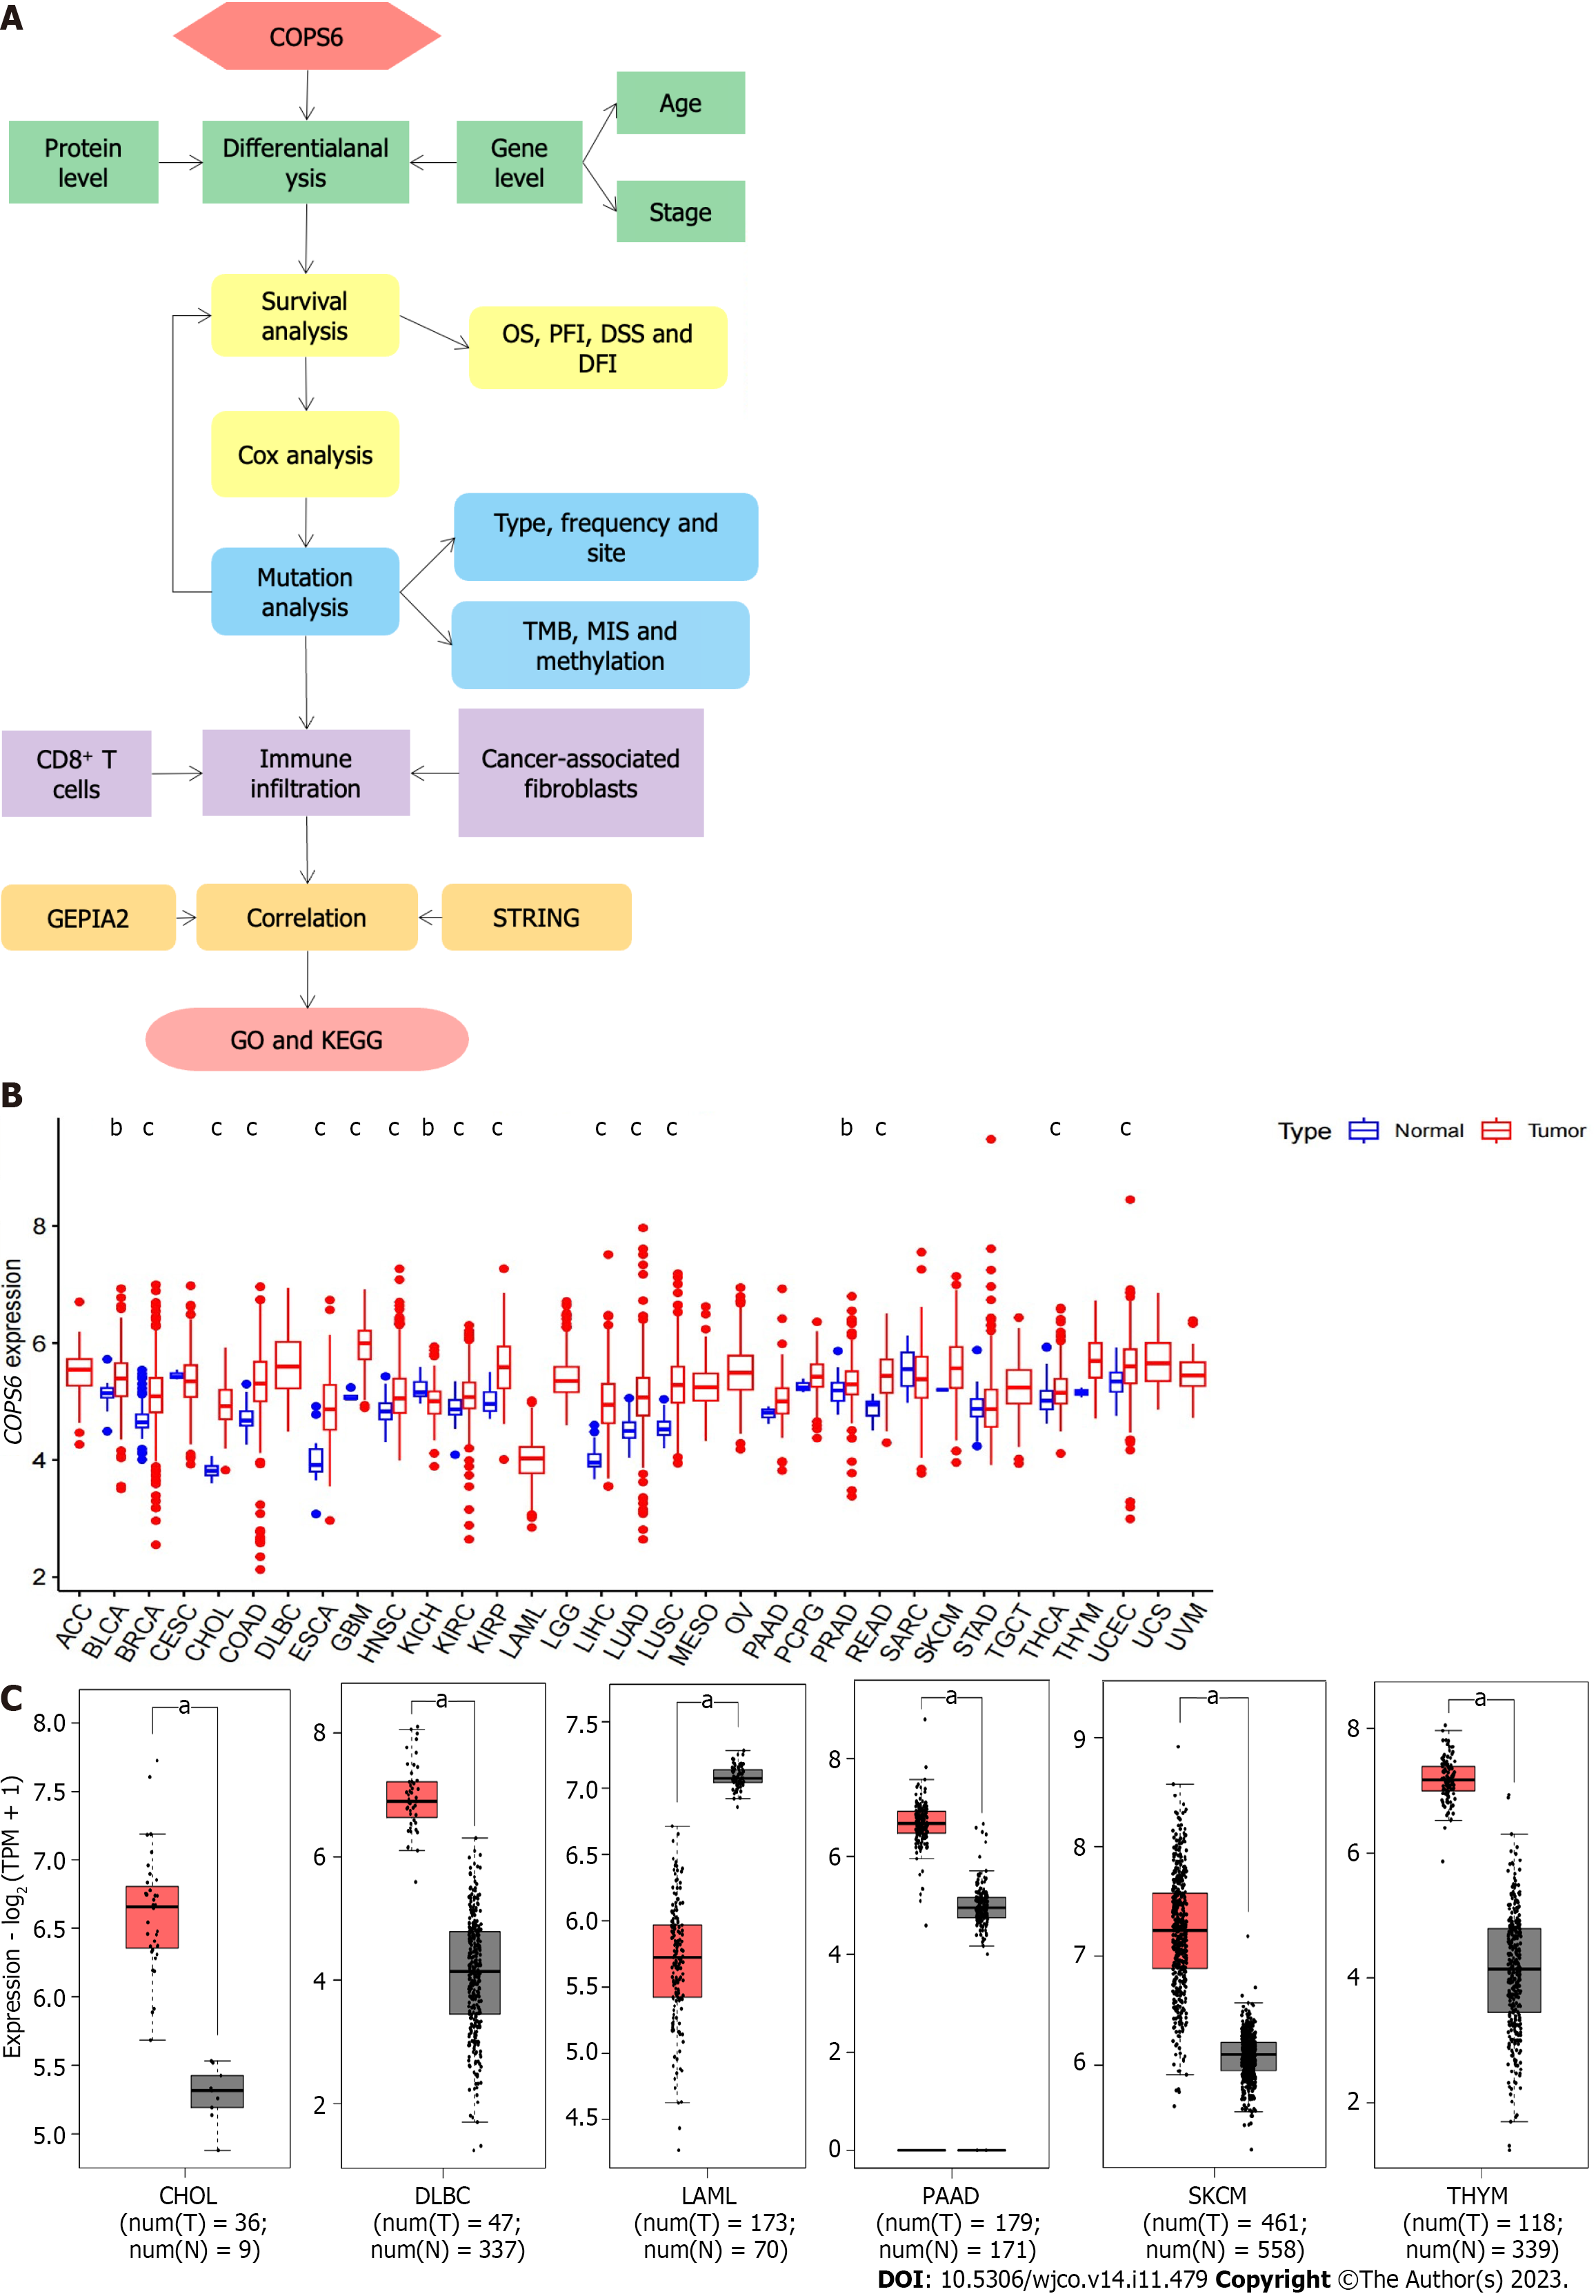
Figure 1 Differential expression analysis of COP9 signalosome subunit 6 in pan-cancer.
A: Overview of the pan-cancer analysis workflow; B: Differential expression analysis of COP9 signalosome subunit 6 (COPS6) in the The Cancer Genome Atlas (TCGA) database using the Wilcoxon test in R software; C: Differential expression analysis of COPS6 in matched TCGA normal and Genotype-Tissue Expression data using the GEPIA2 website with specific cutoff criteria. bP < 0.01;cP < 0.001. CHOL: Cholangiocarcinoma; DFI: Disease-free interval; DLBC: Diffuse large B-cell; DSS: Disease-specific survival; GO: Gene ontology; KEGG: Kyoto Encyclopedia of Genes and Genomes; LAML: Acute myeloid leukemia; MIS: Microsatellite instability; OS: Overall survival; PAAD: Pancreatic adenocarcinoma; PFI: Progression-free interval; SKCM: Skin cutaneous melanoma; THYM: Thymoma; TMB: Tumor mutational burden.
Figure 2 Association between COP9 signalosome subunit 6 and clinical parameters in pan-cancer.
A: Differential analysis of COP9 signalosome subunit 6 (COPS6) protein expression in pan-cancers using the CPTAC database accessed through the UALCAN website; B: Relationship between COPS6 expression and clinical stage analyzed with the GEPIA2 website; C: Correlation between COPS6 expression and age using R software. KICH: Kidney chromophobe; KIRC: Kidney renal clear cell carcinoma; LIHC: Liver hepatocellular carcinoma; LUAD: Lung adenocarcinoma.
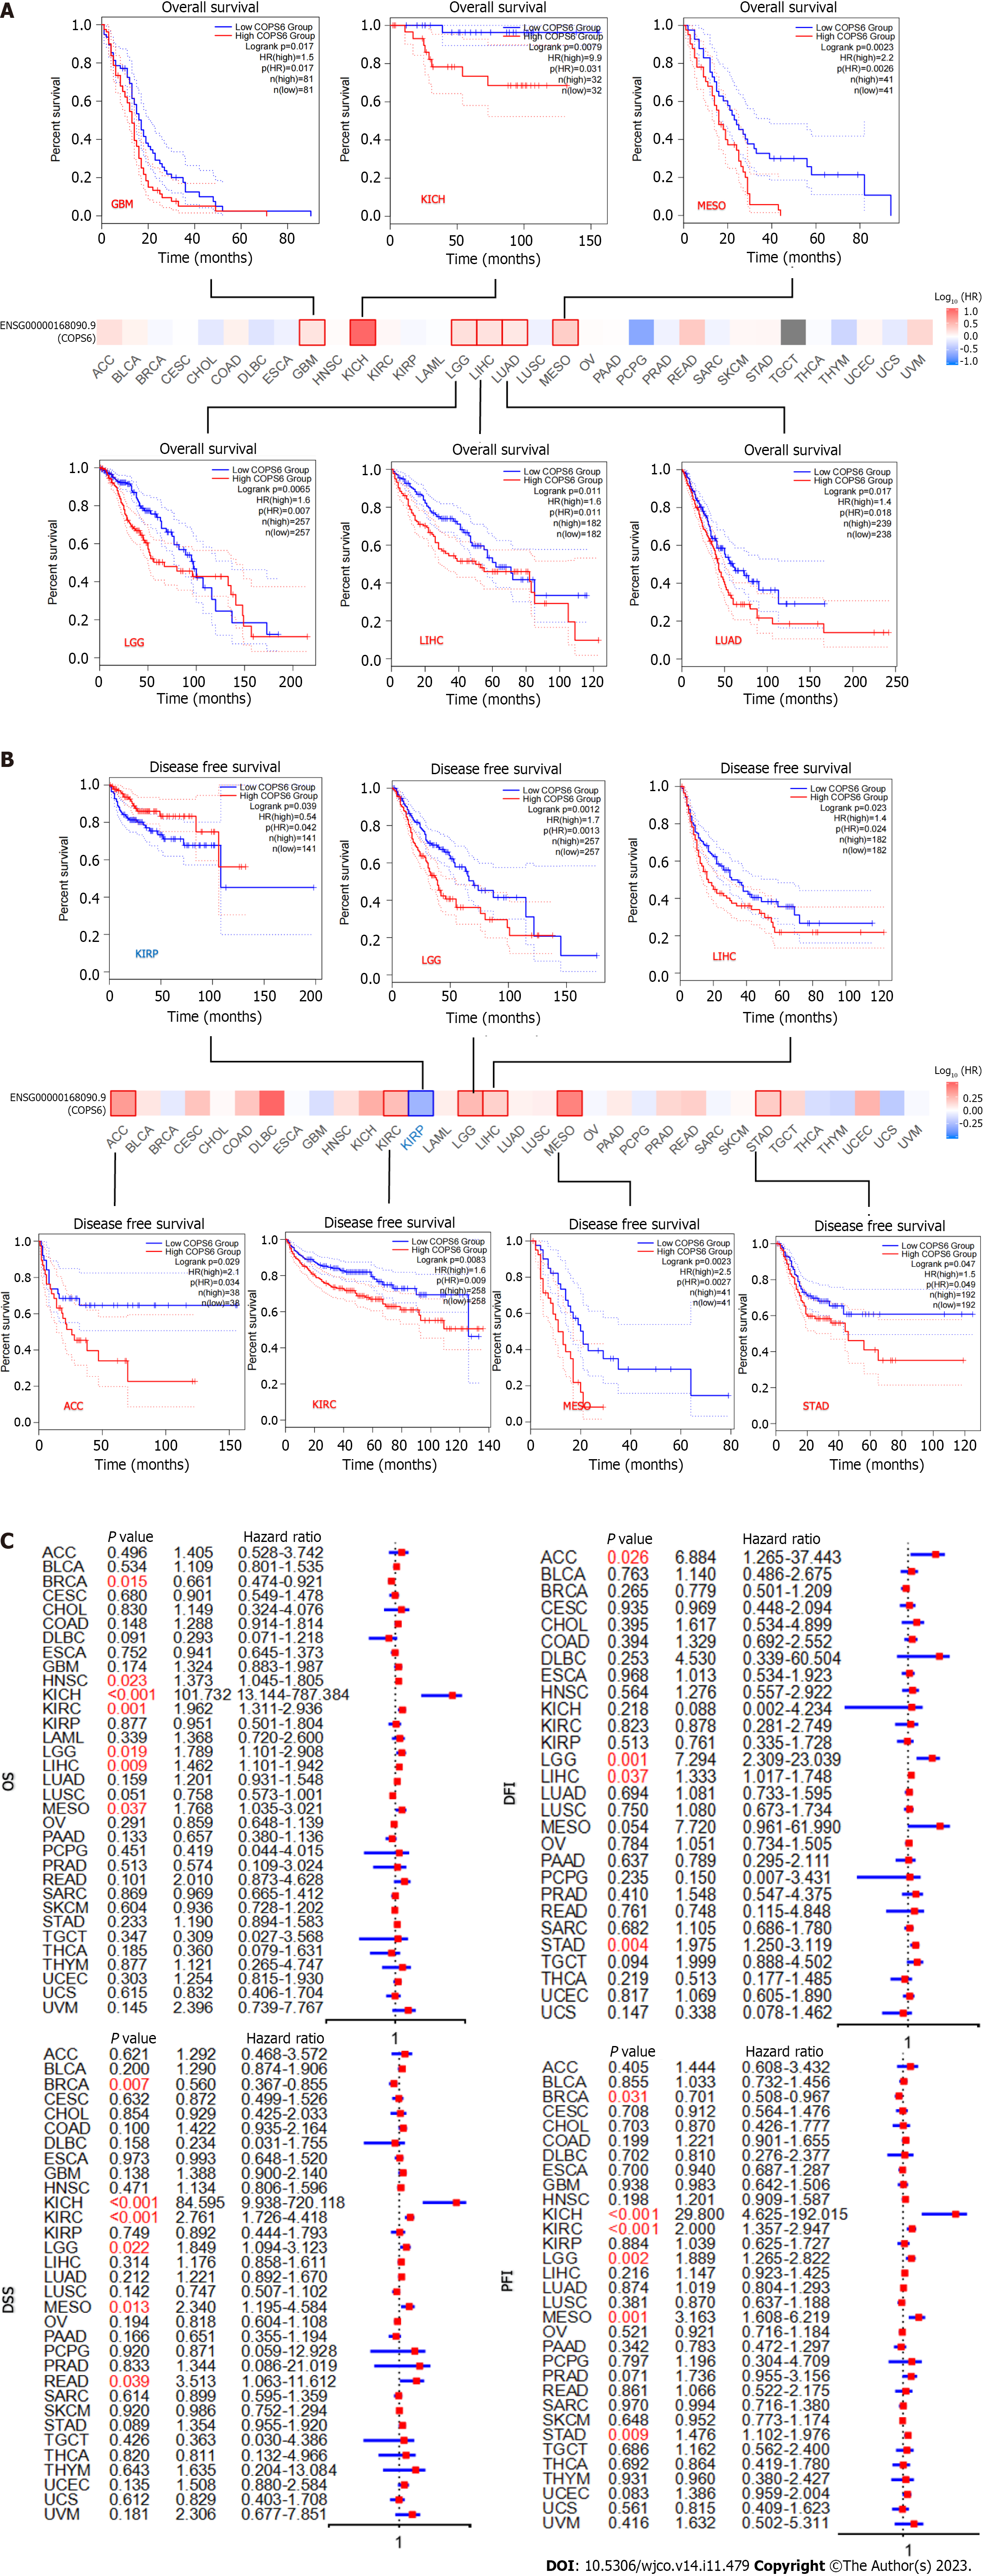
Figure 3 Survival analysis of COP9 signalosome subunit 6.
A: Overall survival (OS) and disease-free survival analysis conducted with the GEPIA2 website using the log-rank test (P < 0.05); B: Forest plots illustrating disease-specific survival (DSS), OS, progression-free interval (PFI), and disease-free interval (DFI) analyzed with Cox analysis in R software. ACC: Adrenocortical carcinoma; GBM: Glioblastoma multiforme; KICH: Kidney chromophobe; KIRP: Kidney renal papillary cell carcinoma; LGG: Lower grade glioma; LIHC: Liver hepatocellular carcinoma; LUAD: Lung adenocarcinoma; MESO: Mesothelioma; STAD: Stomach adenocarcinoma.
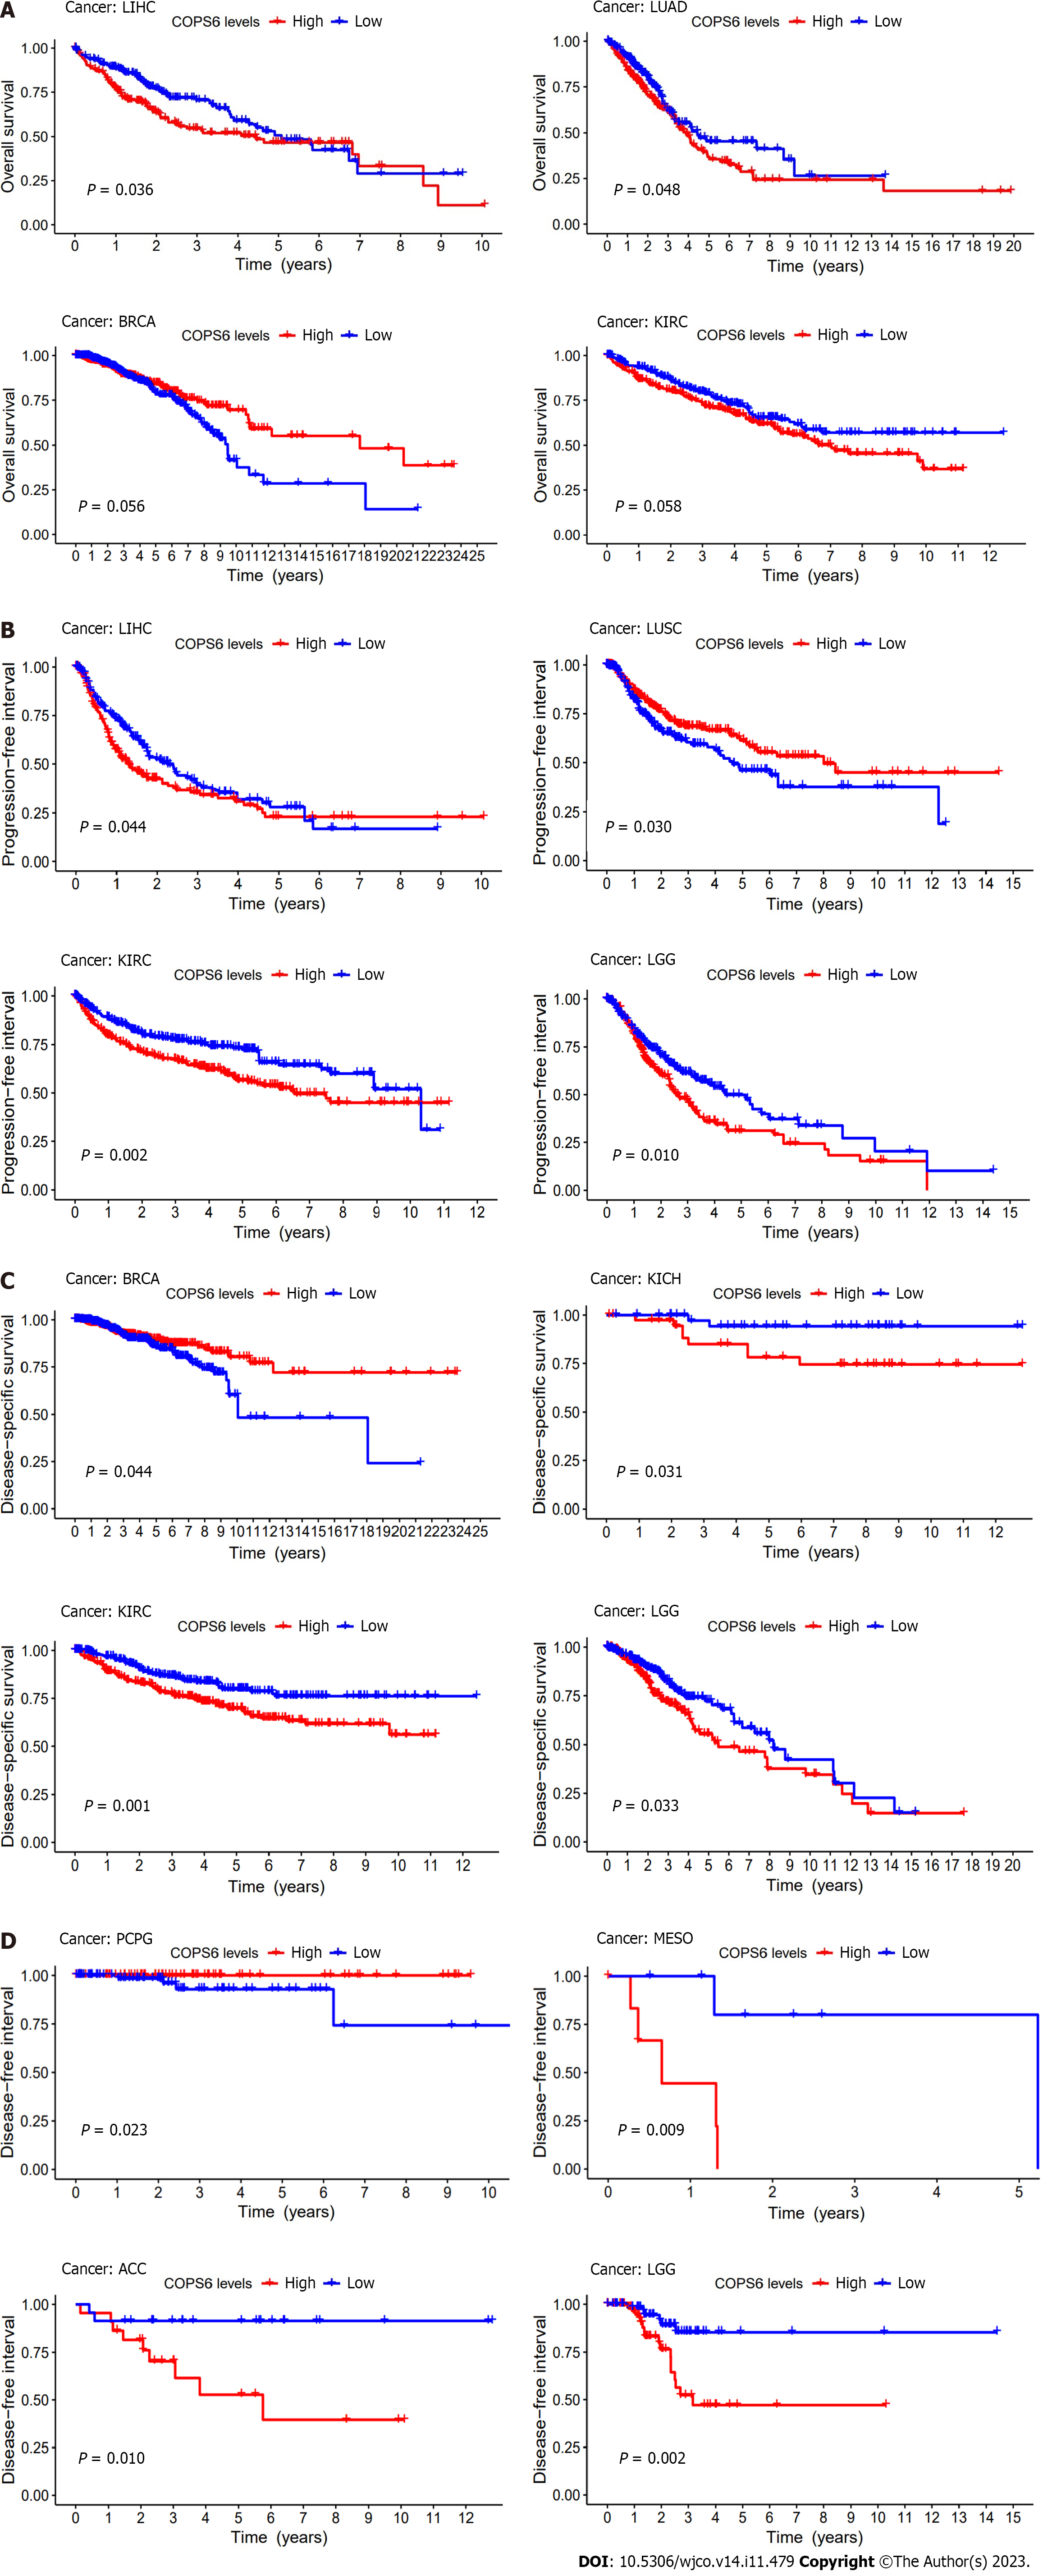
Figure 4 Kaplan-Meier survival analysis of COP9 signalosome subunit 6 in the The Cancer Genome Atlas database performed in R software.
A: Overall survival analysis. B: Progression-free interval analysis; C: Disease-specific survival analysis; D: Disease-free interval analysis. ACC: Adrenocortical carcinoma; BRCA: Breast invasive carcinoma; KIRC: Kidney renal clear cell carcinoma; LGG: Lower grade glioma; LIHC: Liver hepatocellular carcinoma; LUAD: Lung adenocarcinoma; LUSC: Lung squamous cell carcinoma; MESO: Mesothelioma.
Figure 5 Mutation analysis of COP9 signalosome subunit 6.
A: Mutation frequency and types visualized through the cBioPortal website; B: Three-dimensional structure highlighting the R197C/H mutation site in COP9 signalosome subunit 6 (COPS6); C: Mutation sites depicted in the cBioPortal website; D: Survival analysis of COPS6 mutations in pan-cancer; E: Correlation of COPS6 with tumor mutational burden (tumor mutational burden) in pan-cancer using R software; F: Correlation of COPS6 with microsatellite instability (microsatellite instability) in pan-cancer using R software; G: Promoter methylation levels of COPS6 in prostate adenocarcinoma (PRAD), lung squamous cell carcinoma (LUSC), head and neck squamous cell carcinoma (HNSC), breast invasive carcinoma (BRCA), bladder cancer (BLCA), and kidney renal clear cell carcinoma (KIRC) accessed through the UALCAN website. OS: Overall survival; DFS: Disease-free survival; PFS: Progression-free survival; DSS: Disease-specific survival.
Figure 6 Immune infiltration analysis of COP9 signalosome subunit 6 in the The Cancer Genome Atlas database using the TIMER2 website.
A: Heatmap depicting the correlation between COP9 signalosome subunit 6 (COPS6) and CD8+ T cells; B: Scatter plot illustrating the relationship between COPS6 and CD8+ T cells; C: Heatmap displaying the correlation between COPS6 and cancer-associated fibroblasts; D: Scatter plot demonstrating the relationship between COPS6 and cancer-associated fibroblasts; E: Heatmap indicating the correlation between COPS6 and macrophages; F: Scatter plot showing the relationship between COPS6 and macrophages; G: Heatmap presenting the correlation between COPS6 and natural killer (NK) cells; H: Scatter plot depicting the relationship between COPS6 and NK cells. TPM: Transcripts per million.
Figure 7 Correlation analysis and enrichment analysis of COPS6.
A: Heatmap displaying the top 5 genes correlated with COPS6 in pan-cancer accessed through the TIMER2 website; B: Scatter plot illustrating the correlation between COPS6 and the top 5 genes in pan-cancer using the GEPIA2 website; C: Protein-protein interaction network of COPS6 obtained from the STRING database; D: Intersection of COPS6-related genes screened in GEPIA2 and STRING, resulting in GPS1 and TCEB2; E: Kyoto Encyclopedia of Genes and Genomes enrichment analysis of the combined COPS6-related genes from GEPIA2 and STRING; F: Gene ontology enrichment analysis of the combined COPS6-related genes from GEPIA2 and STRING. TPM: Transcripts per million.
- Citation: Wang SL, Zhuo GZ, Wang LP, Jiang XH, Liu GH, Pan YB, Li YR. Computational exploration of the significance of COPS6 in cancer: Functional and clinical relevance across tumor types. World J Clin Oncol 2023; 14(11): 479-503
- URL: https://www.wjgnet.com/2218-4333/full/v14/i11/479.htm
- DOI: https://dx.doi.org/10.5306/wjco.v14.i11.479


