Copyright
©The Author(s) 2023.
World J Clin Oncol. Nov 24, 2023; 14(11): 459-470
Published online Nov 24, 2023. doi: 10.5306/wjco.v14.i11.459
Published online Nov 24, 2023. doi: 10.5306/wjco.v14.i11.459
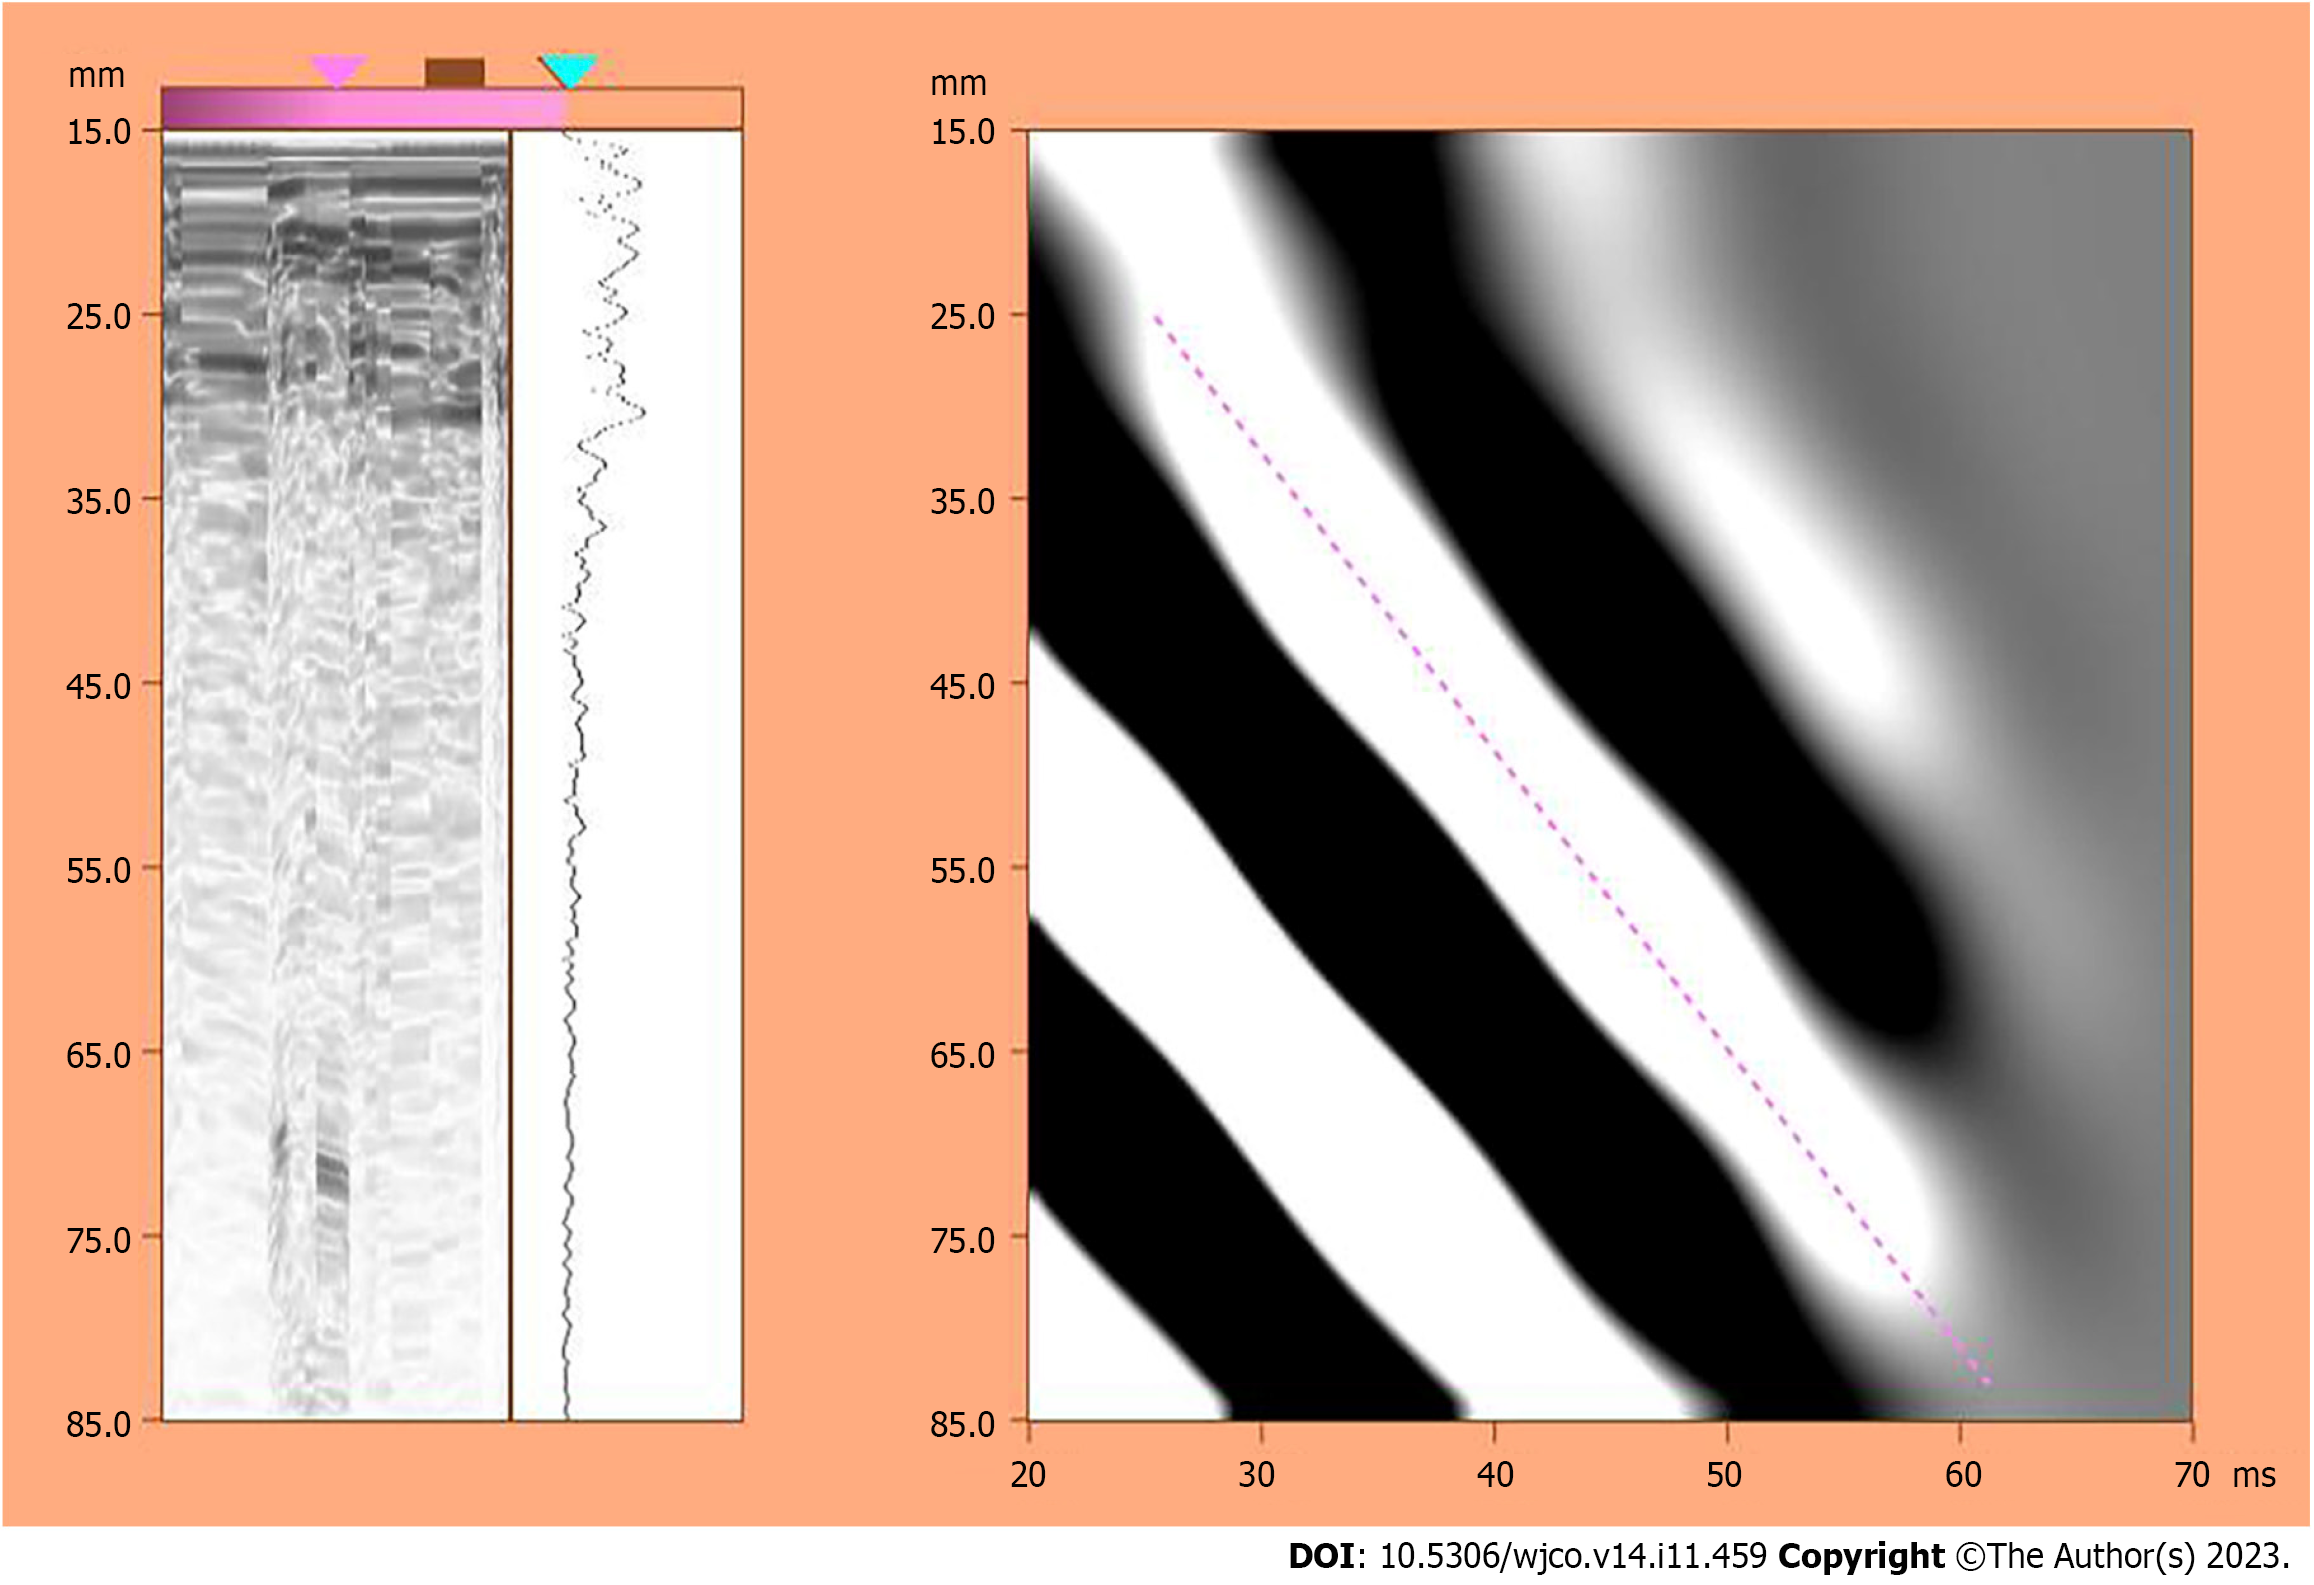
Figure 1 Schematic diagram of transient elastography results of the liver.
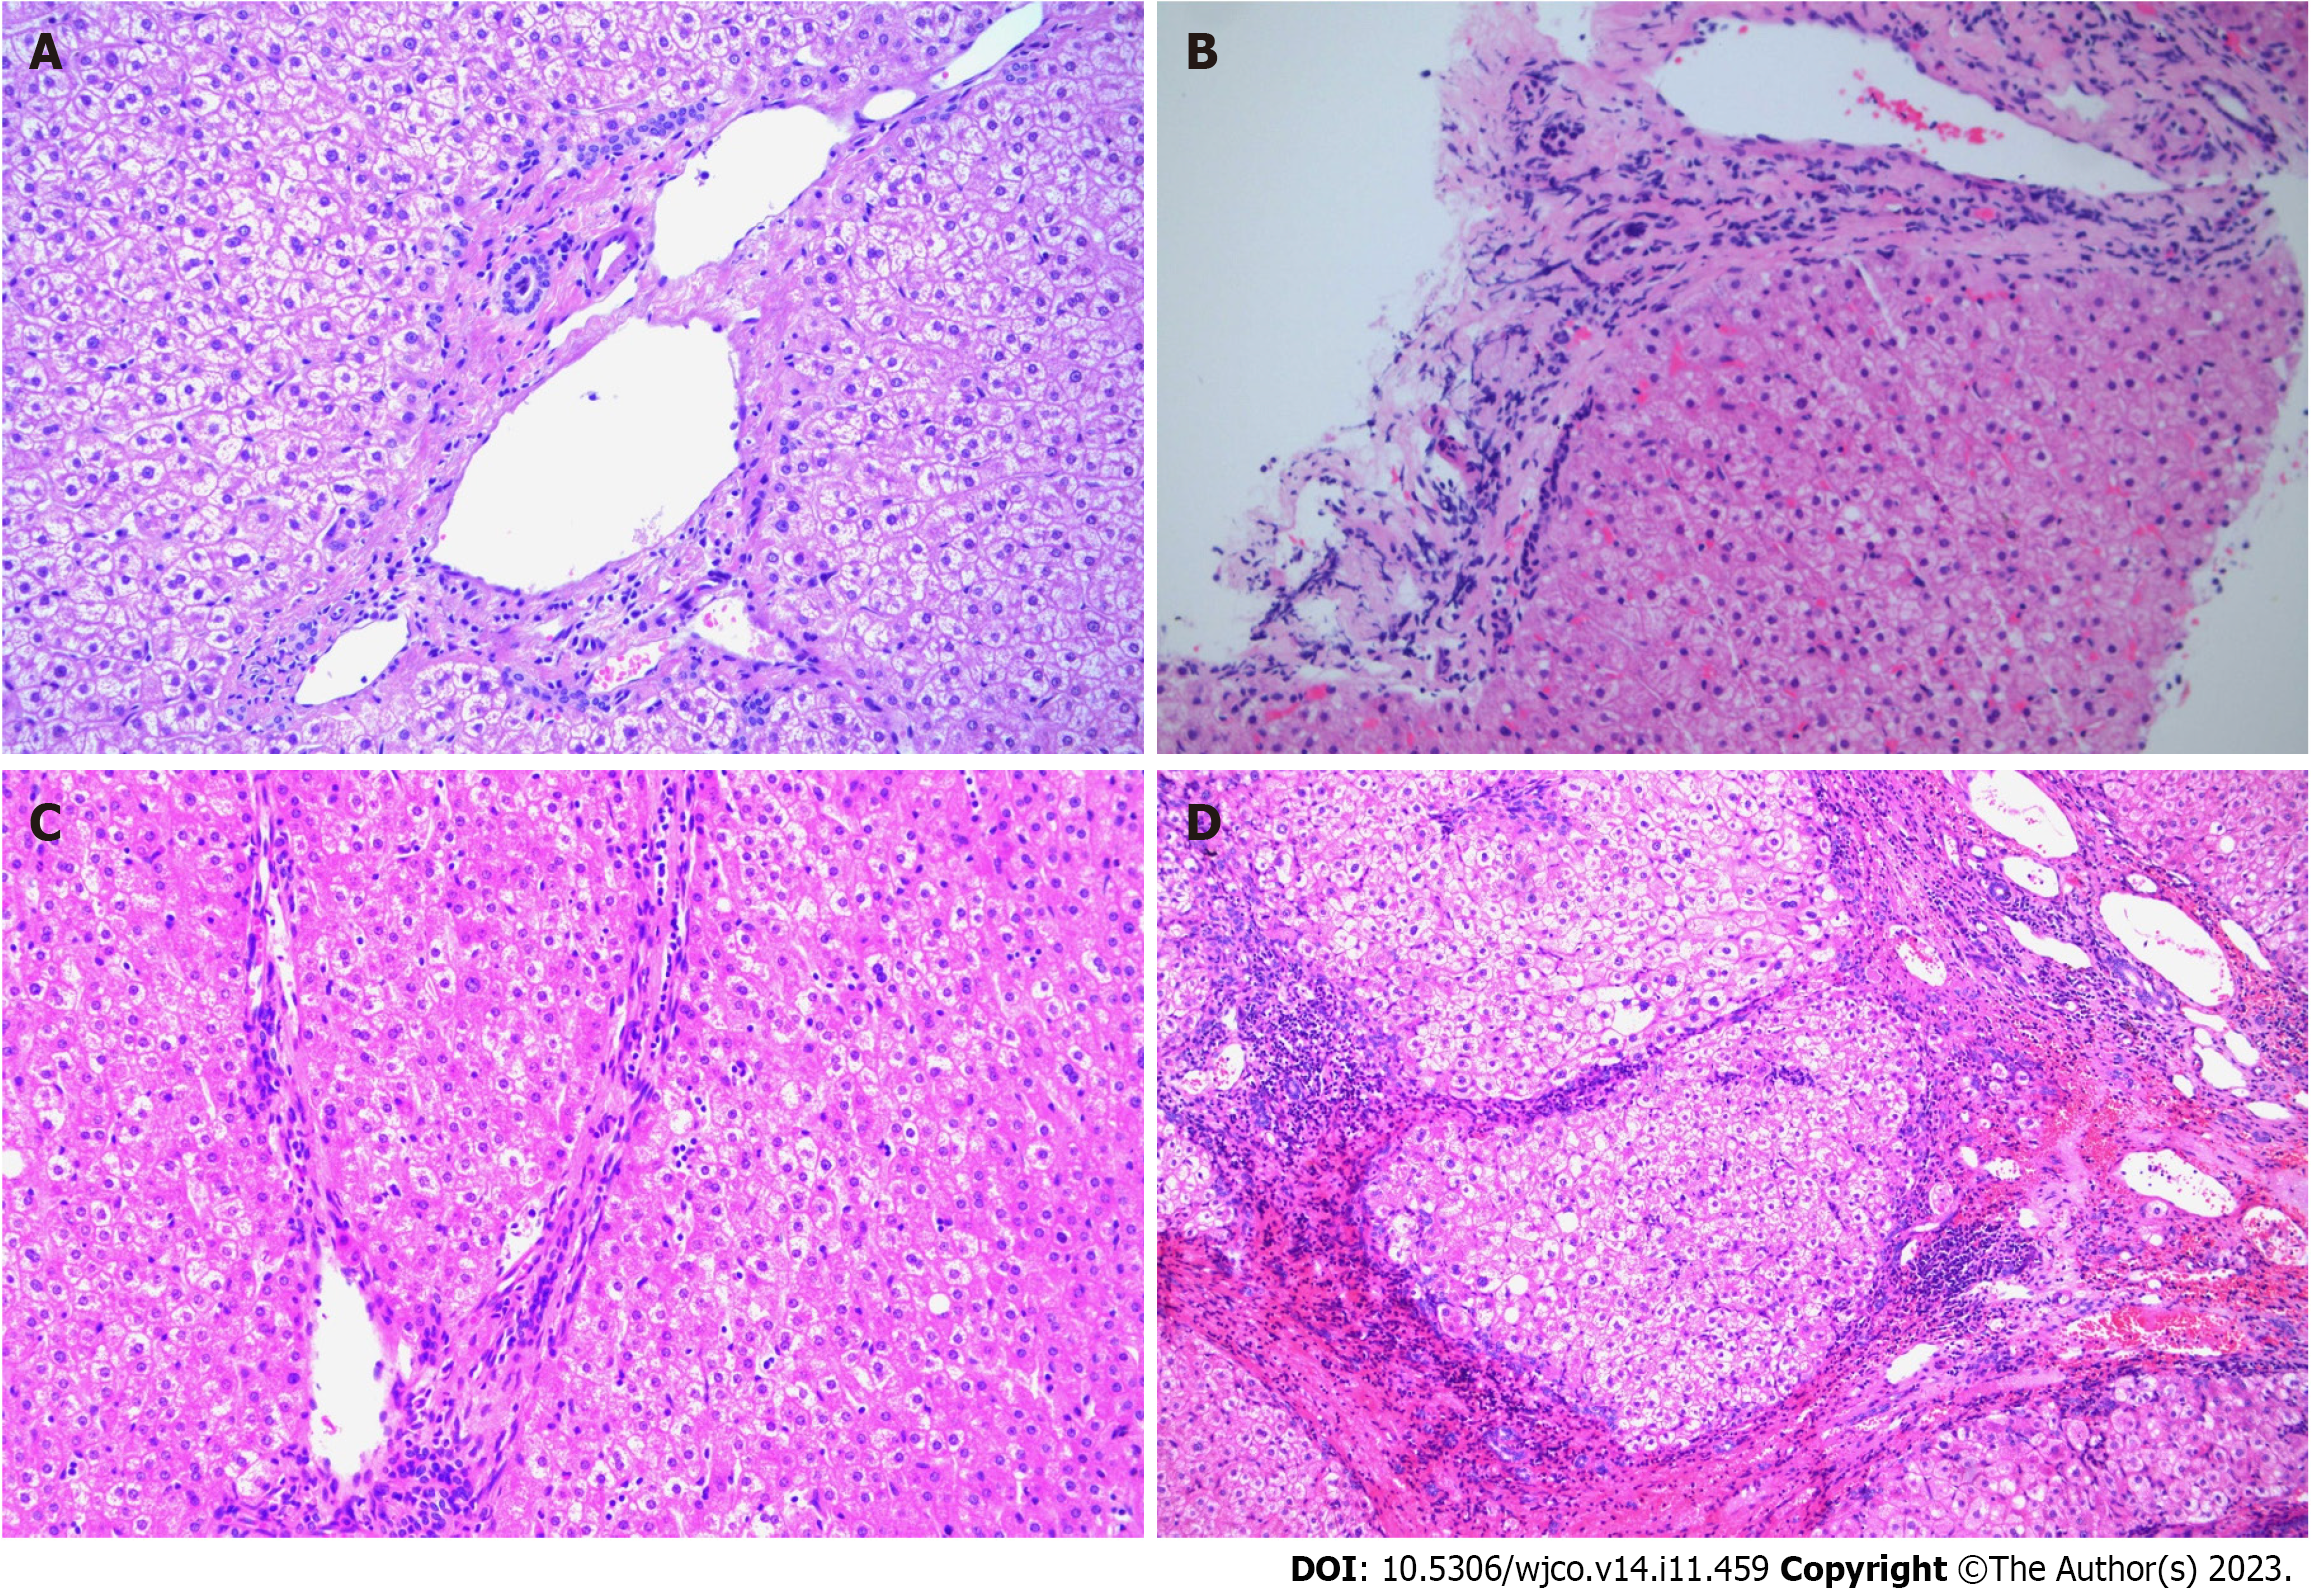
Figure 2 The different stages of liver fibrosis in 35 cases of hemihepatectomy (hepatic encephalopathy × 200).
A: Stage S1; B: Stage S2; C: Stage S3; D: Stage S4.
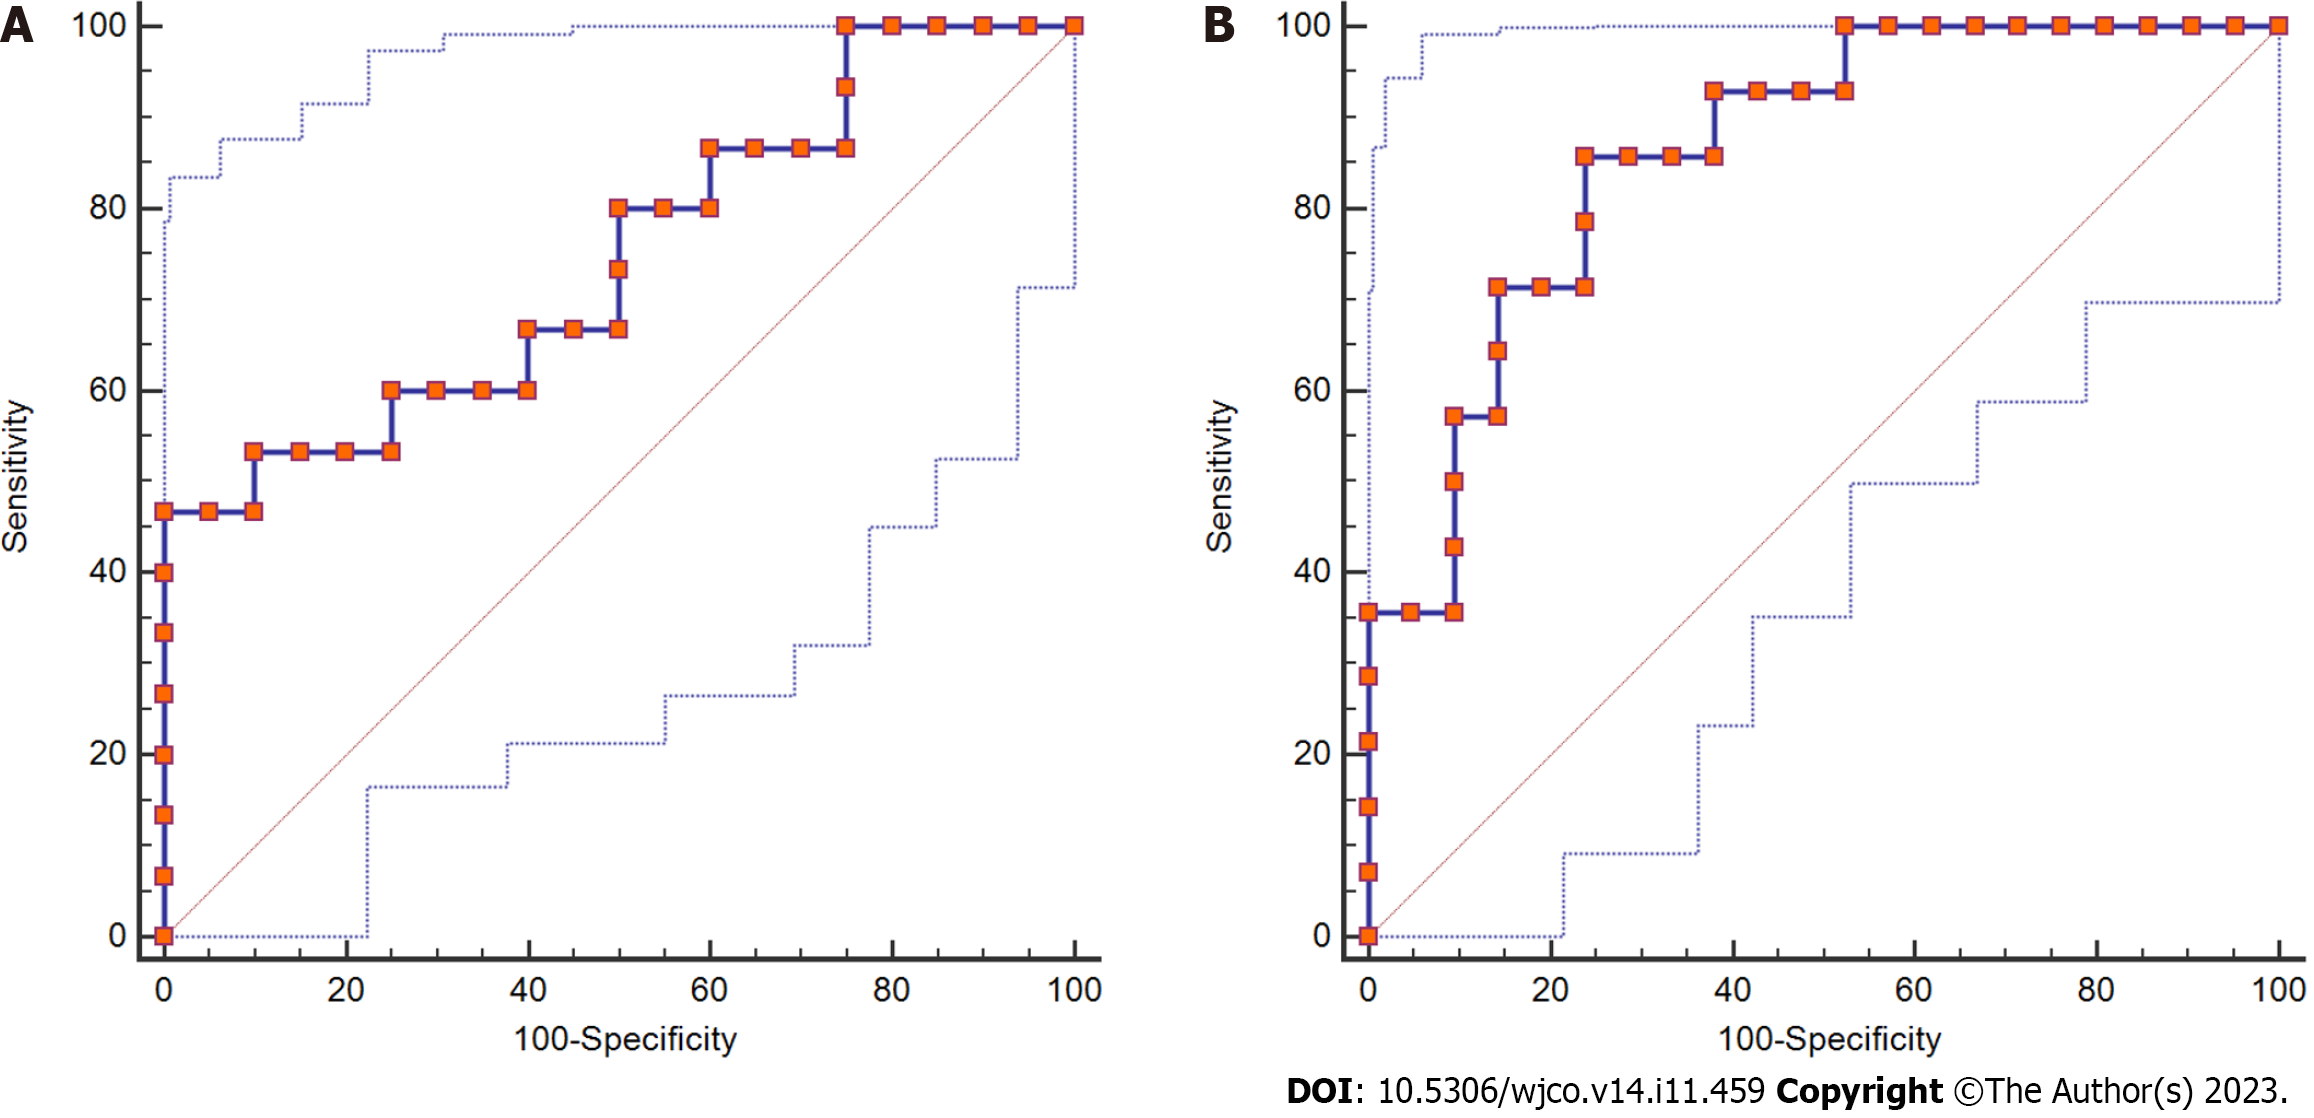
Figure 3 The receiver operating characteristic curve of the standard residual liver volume in different stages of liver fibrosis.
A: Stages S2-S3; B: Stage S4.
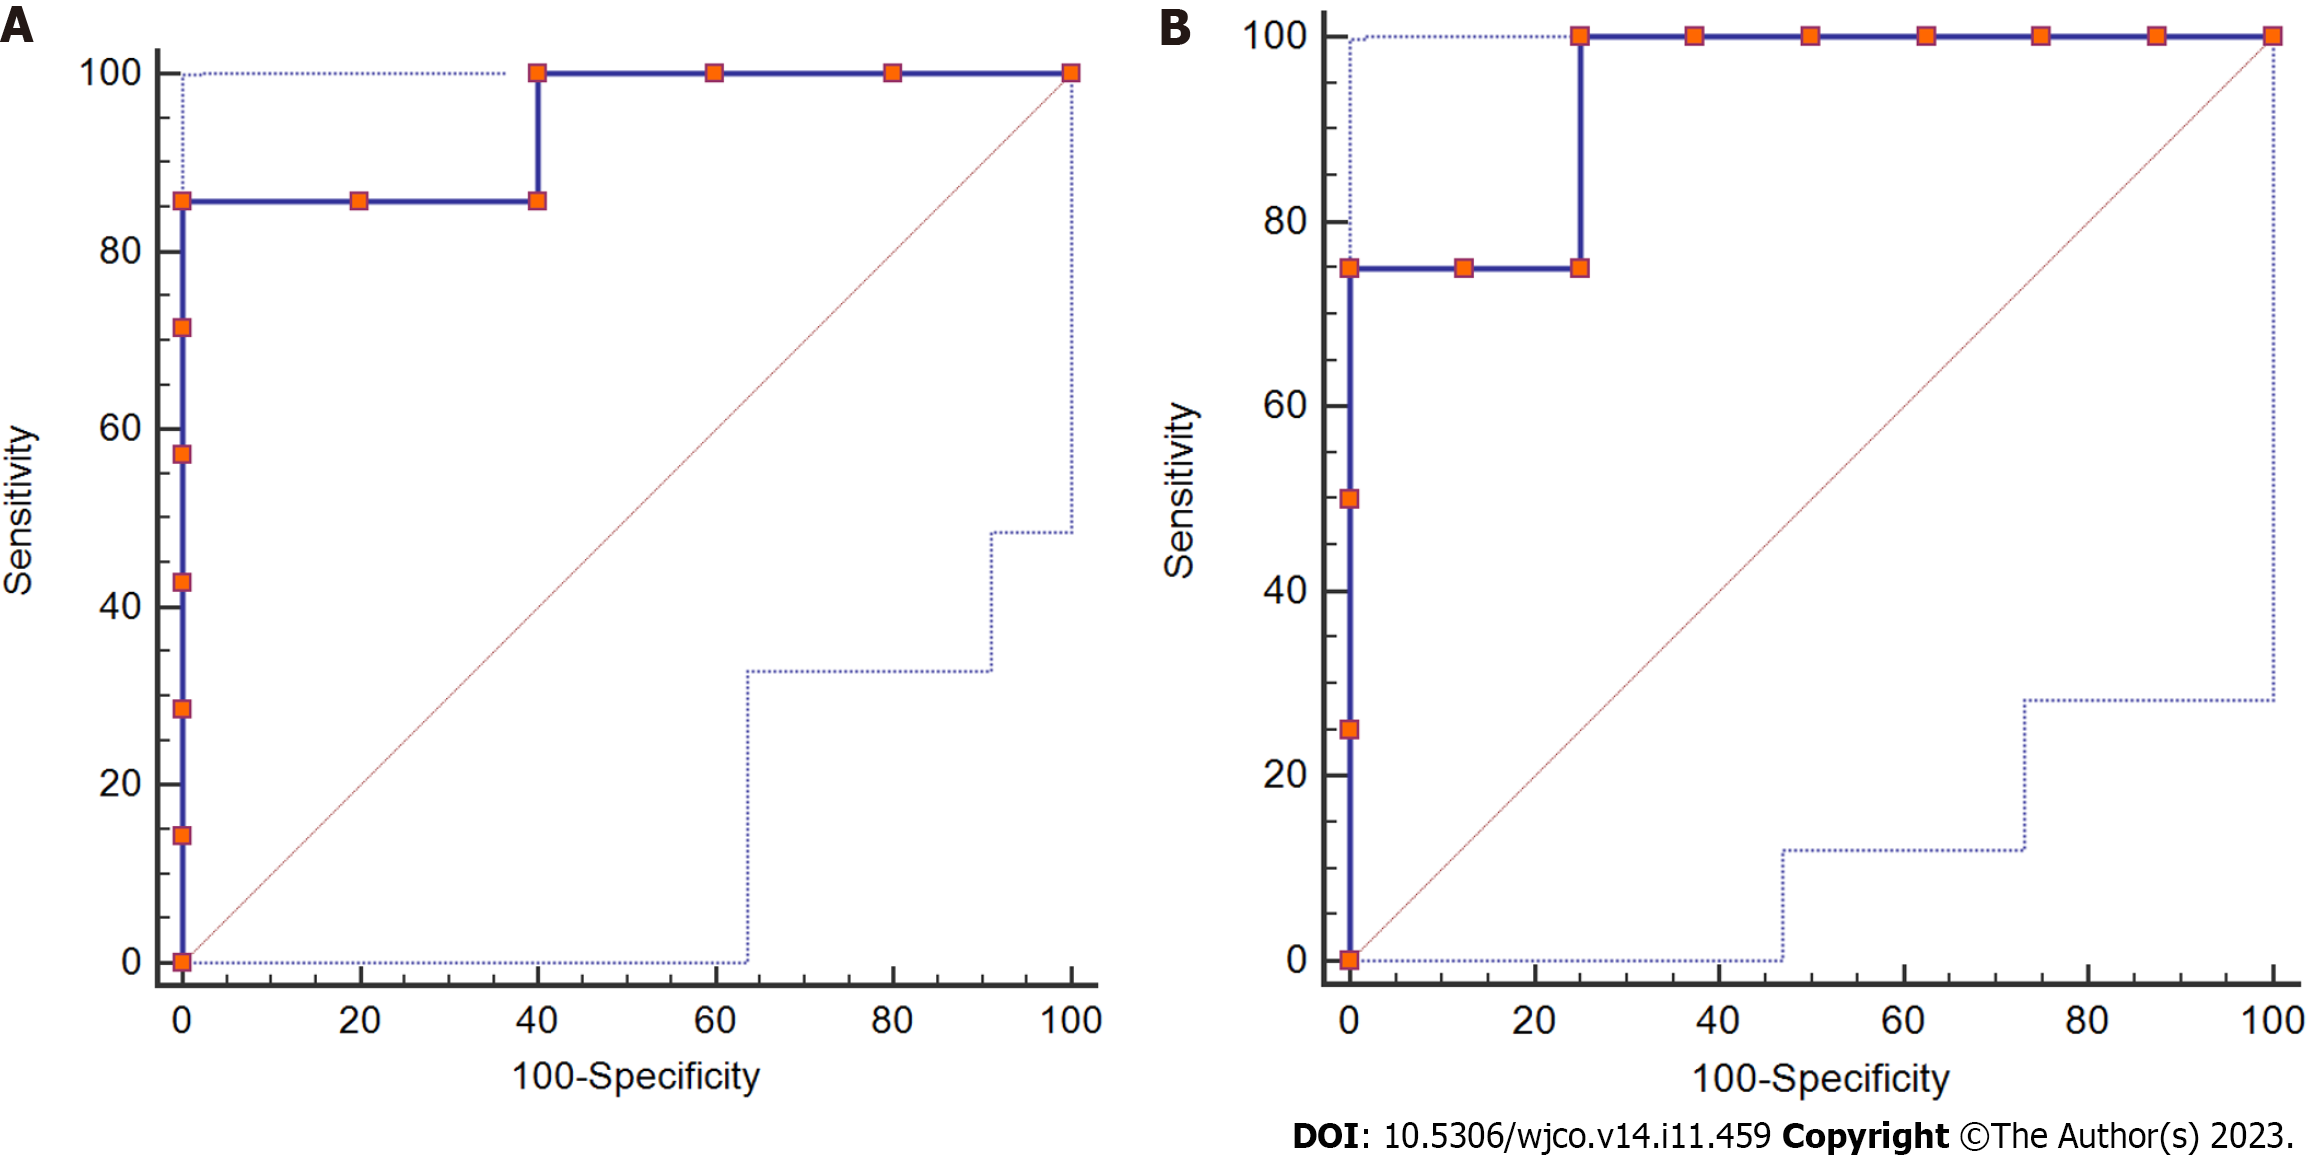
Figure 4 The receiver operating characteristic curve of the standard residual liver volume in different stages of liver fibrosis in patients with liver dysfunction.
A: Stage S2-S3; B: Stage S4.
- Citation: Yue ZQ, Zhang P, Yan S, Ju LL, Wang HX, Yuan LX, Chen L, Wu JZ, Cao YL. Clinical study of standard residual liver volume and transient elastography in predicting poor prognosis of patients after hemihepatectomy. World J Clin Oncol 2023; 14(11): 459-470
- URL: https://www.wjgnet.com/2218-4333/full/v14/i11/459.htm
- DOI: https://dx.doi.org/10.5306/wjco.v14.i11.459


