Copyright
©The Author(s) 2023.
World J Clin Oncol. Jan 24, 2023; 14(1): 13-26
Published online Jan 24, 2023. doi: 10.5306/wjco.v14.i1.13
Published online Jan 24, 2023. doi: 10.5306/wjco.v14.i1.13
Figure 1 Comparative principal component analysis and heatmap analysis of up-regulated mRNAs between non-radiated and radiated KYSE-180 cell samples.
A and B: Principal component analysis. Samples were clustered into two groups: 0 Gy group vs 12 Gy group (A) and 0 Gy group vs 30 Gy group (B); C and D: Heatmap analysis. Upregulated genes are indicated in red whereas downregulated ones are indicated in green. The expression of mRNAs in radiated samples was comparatively higher than that in non-radiated samples: 0 Gy group vs 12 Gy group (C) and 0 Gy group vs 30 Gy group (D); E: Venn diagram of radioresistance-promoting mRNAs associated with prognosis in esophageal squamous cell carcinoma.
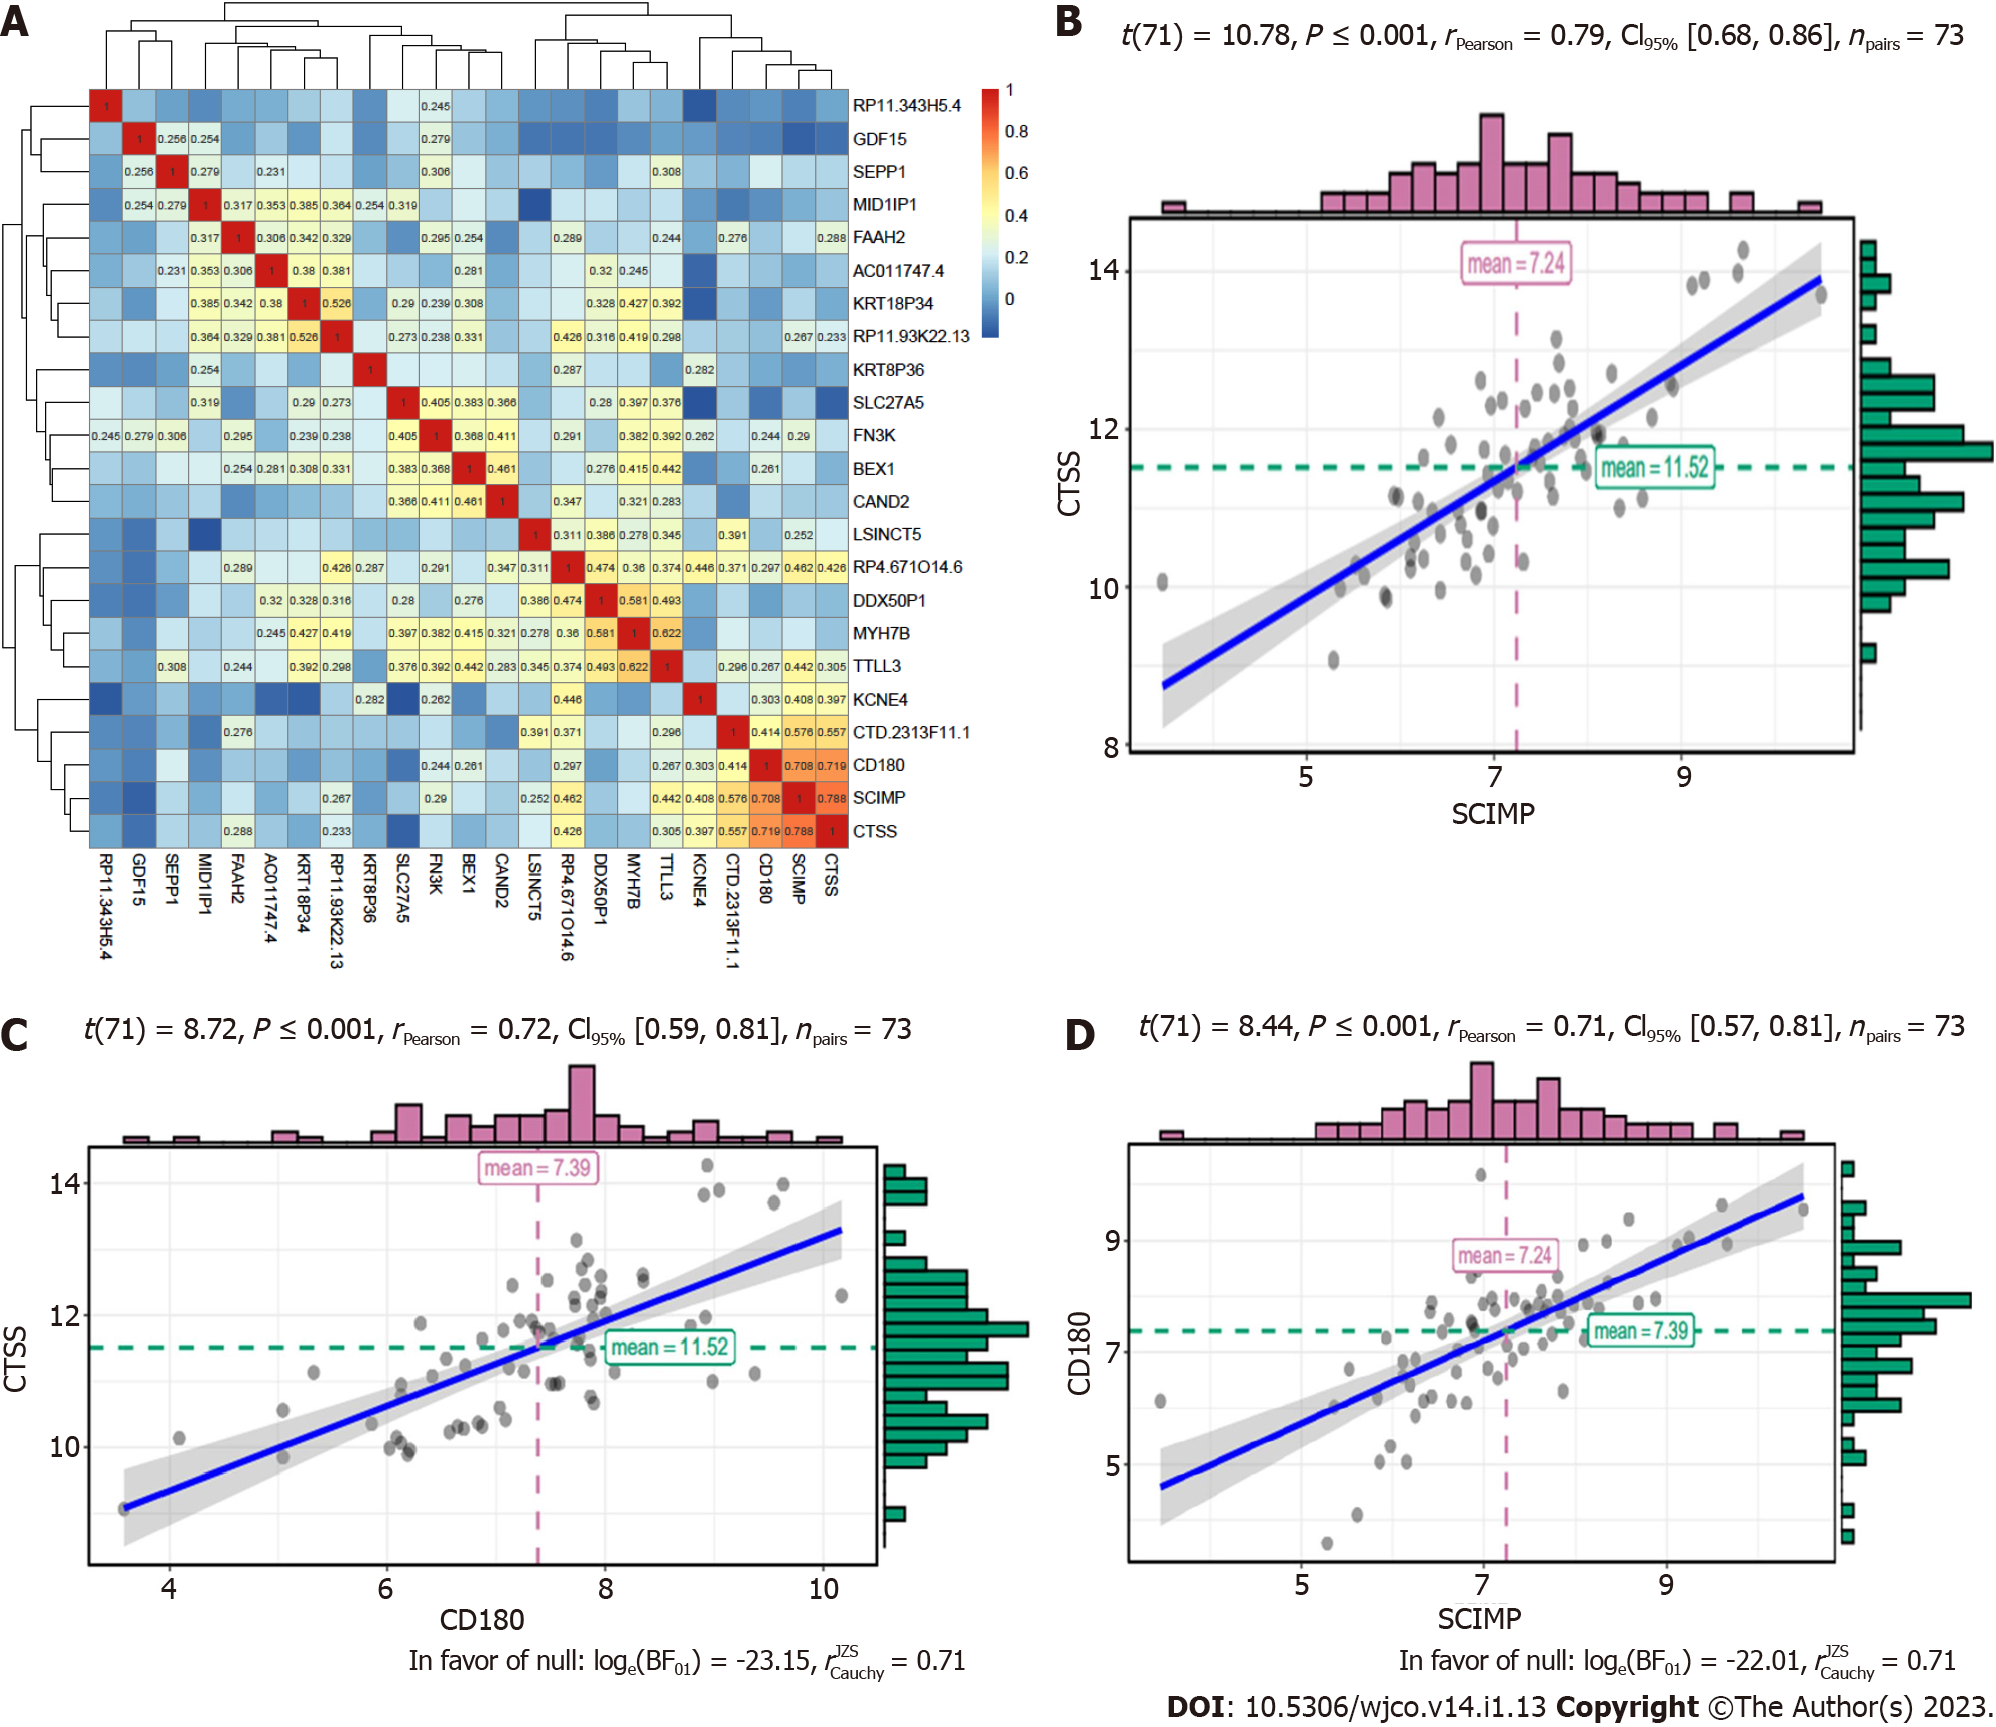
Figure 2 Heatmap and scattergram depicting the correlations of mRNAs.
A: Heatmap showing correlations of 23 mRNAs contributing to radioresistance; B-D: Scattergram showing correlations between two of the three mRNAs: CTSS vs SCIMP (B), CTSS vs CD180 (C), and CD180 vs SCIMP (D).
Figure 3 Kaplan-Meier curves.
A: Kaplan-Meier survival curves by expression of CTSS, SCIMP, and CD180 based on data from TCGA database; B: Forest plot established with a hazard ratio calculated through multivariate Cox regression model adjusting for age, gender, grade, and stage (P < 0.05); C: Receiver operating characteristic analysis for 1- and 3-year overall survival prediction; D-F: Risk score distribution for patients in high risk group and low risk group. SCIMP, CD180, and CTSS had higher expression in high risk group than in low risk group; G: Kaplan–Meier survival curves for the high risk group and low risk group.
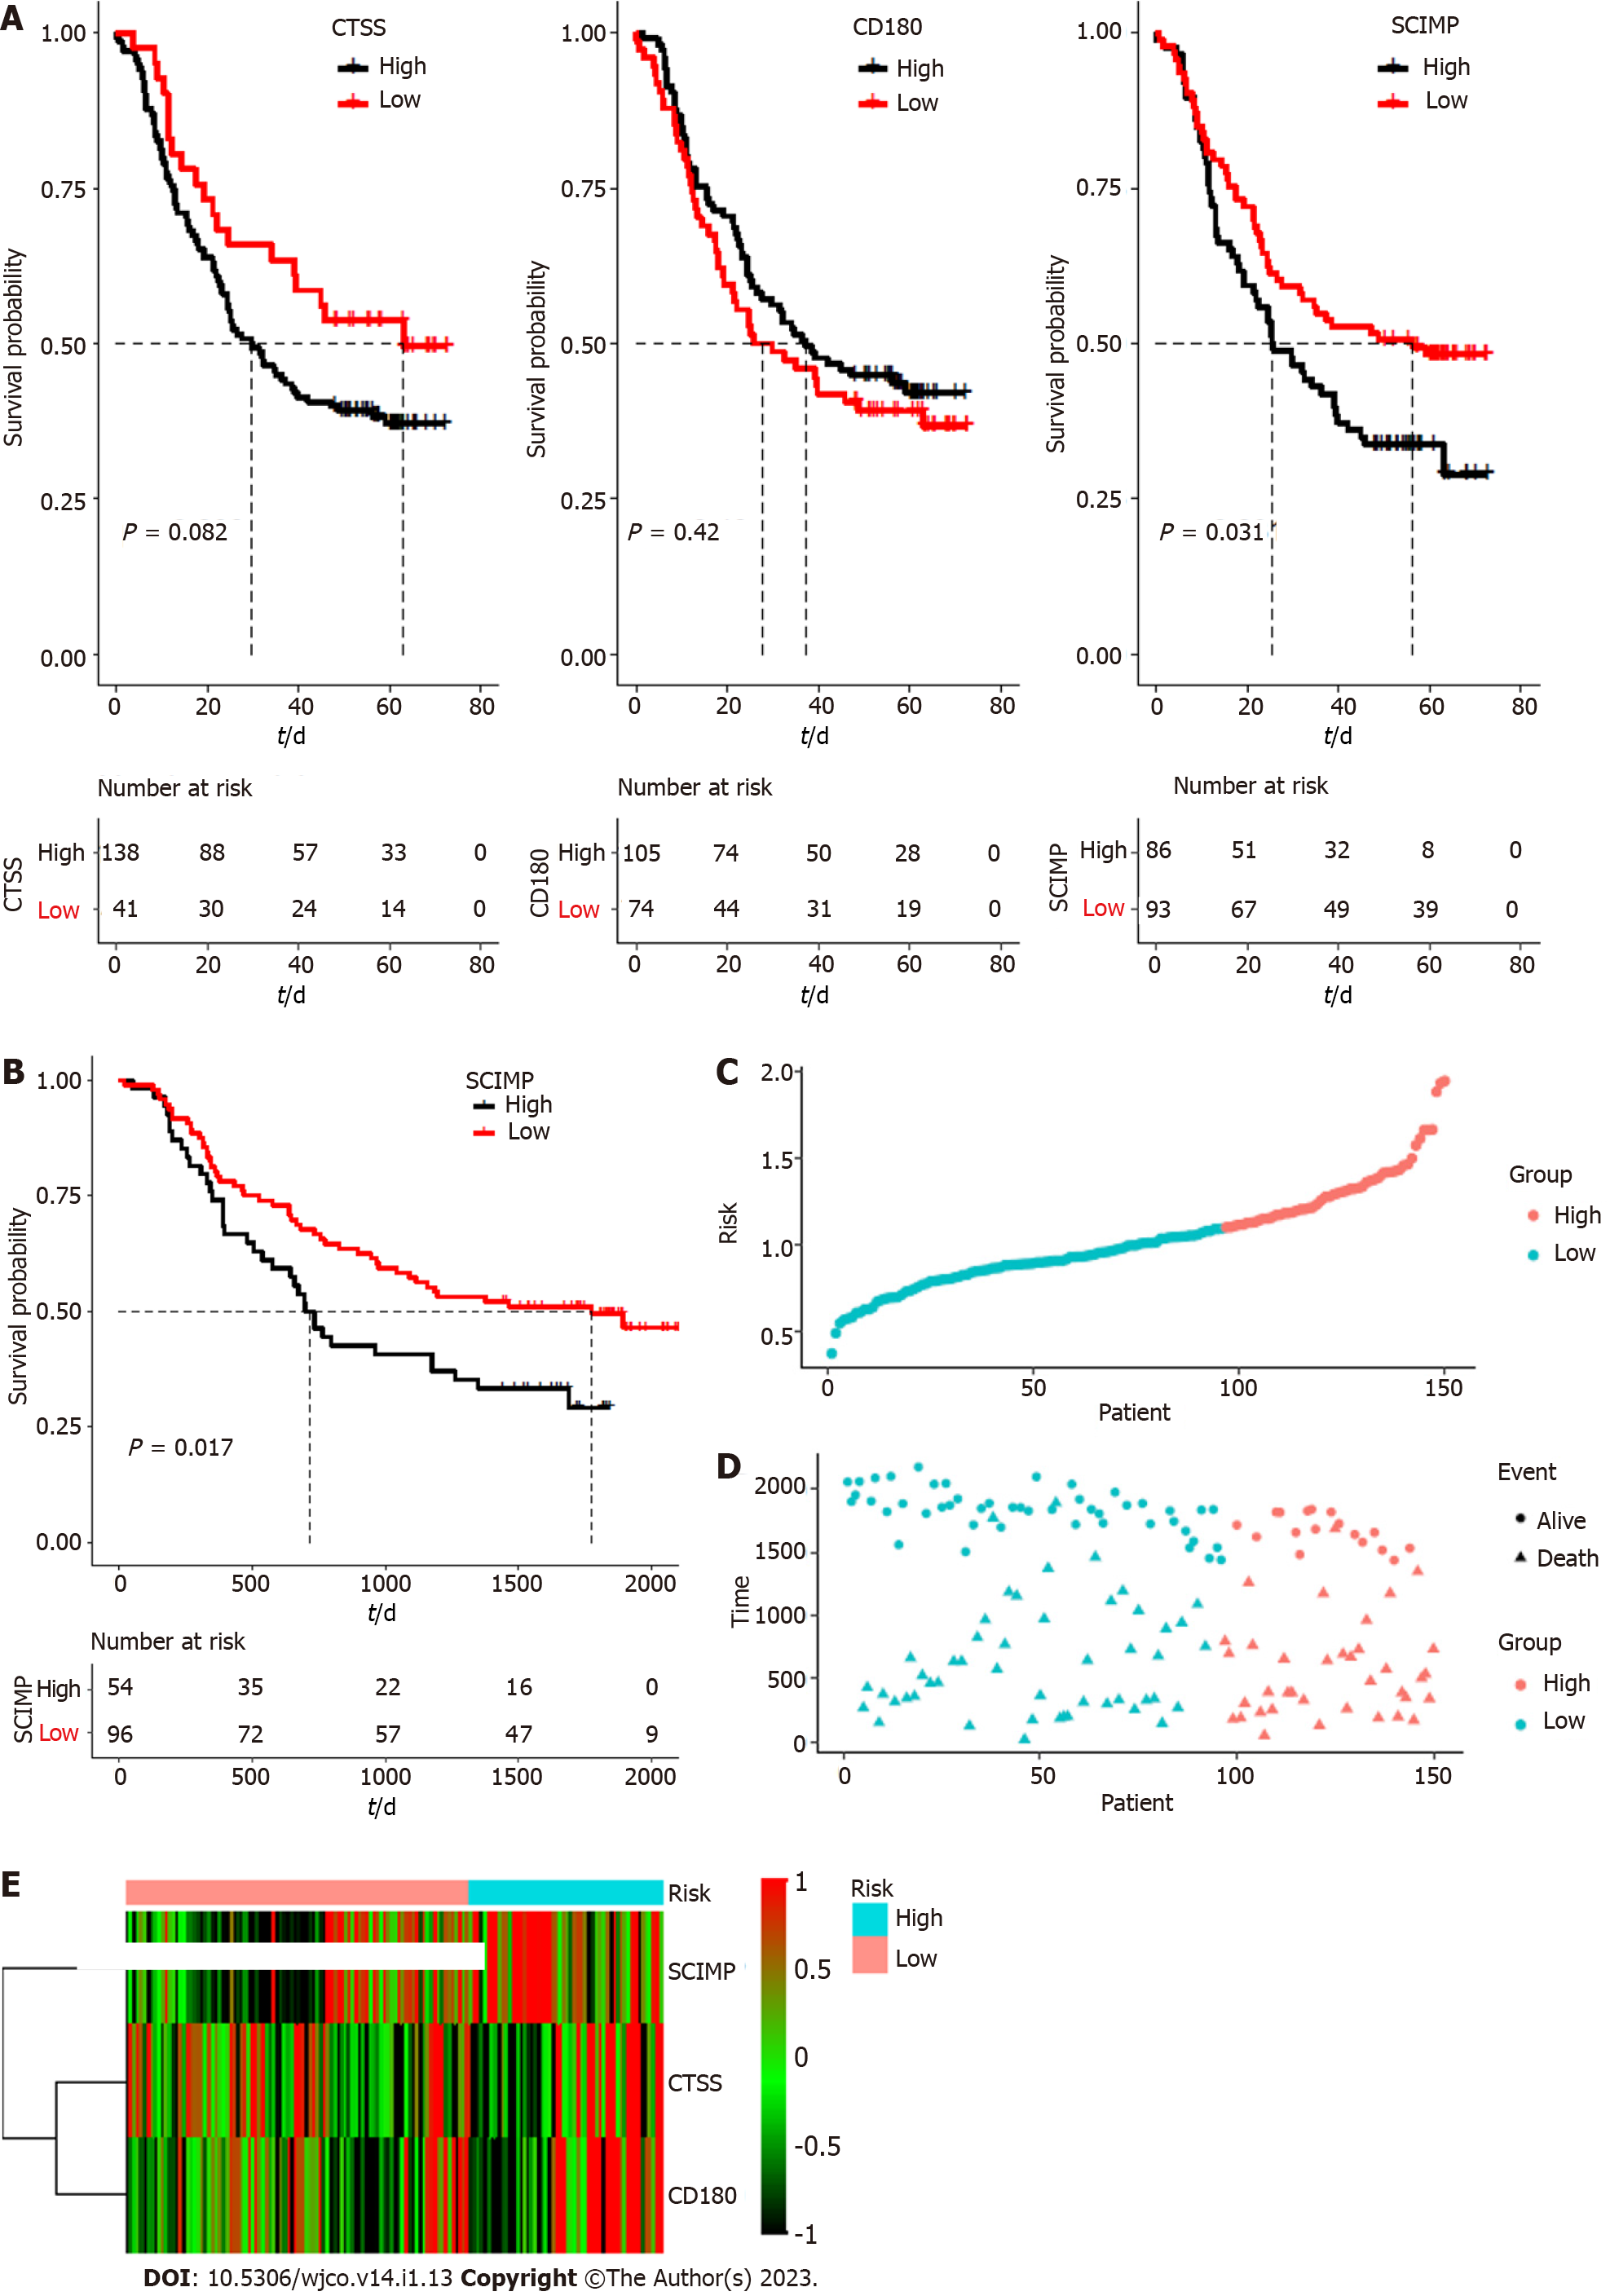
Figure 4 Validation of prognostic value of the three mRNAs based on dataset downloaded from the Gene Expression Omnibus database.
A: Kaplan–Meier survival curves for SCIMP, CD180, and CTSS based on GSE53625 dataset; B: Kaplan–Meier survival curves for the high risk group and low risk group; C-E: Risk score distribution for patients in high risk group and low risk group. SCIMP, CD180, and CTSS had higher expression in high risk group than in low risk group.
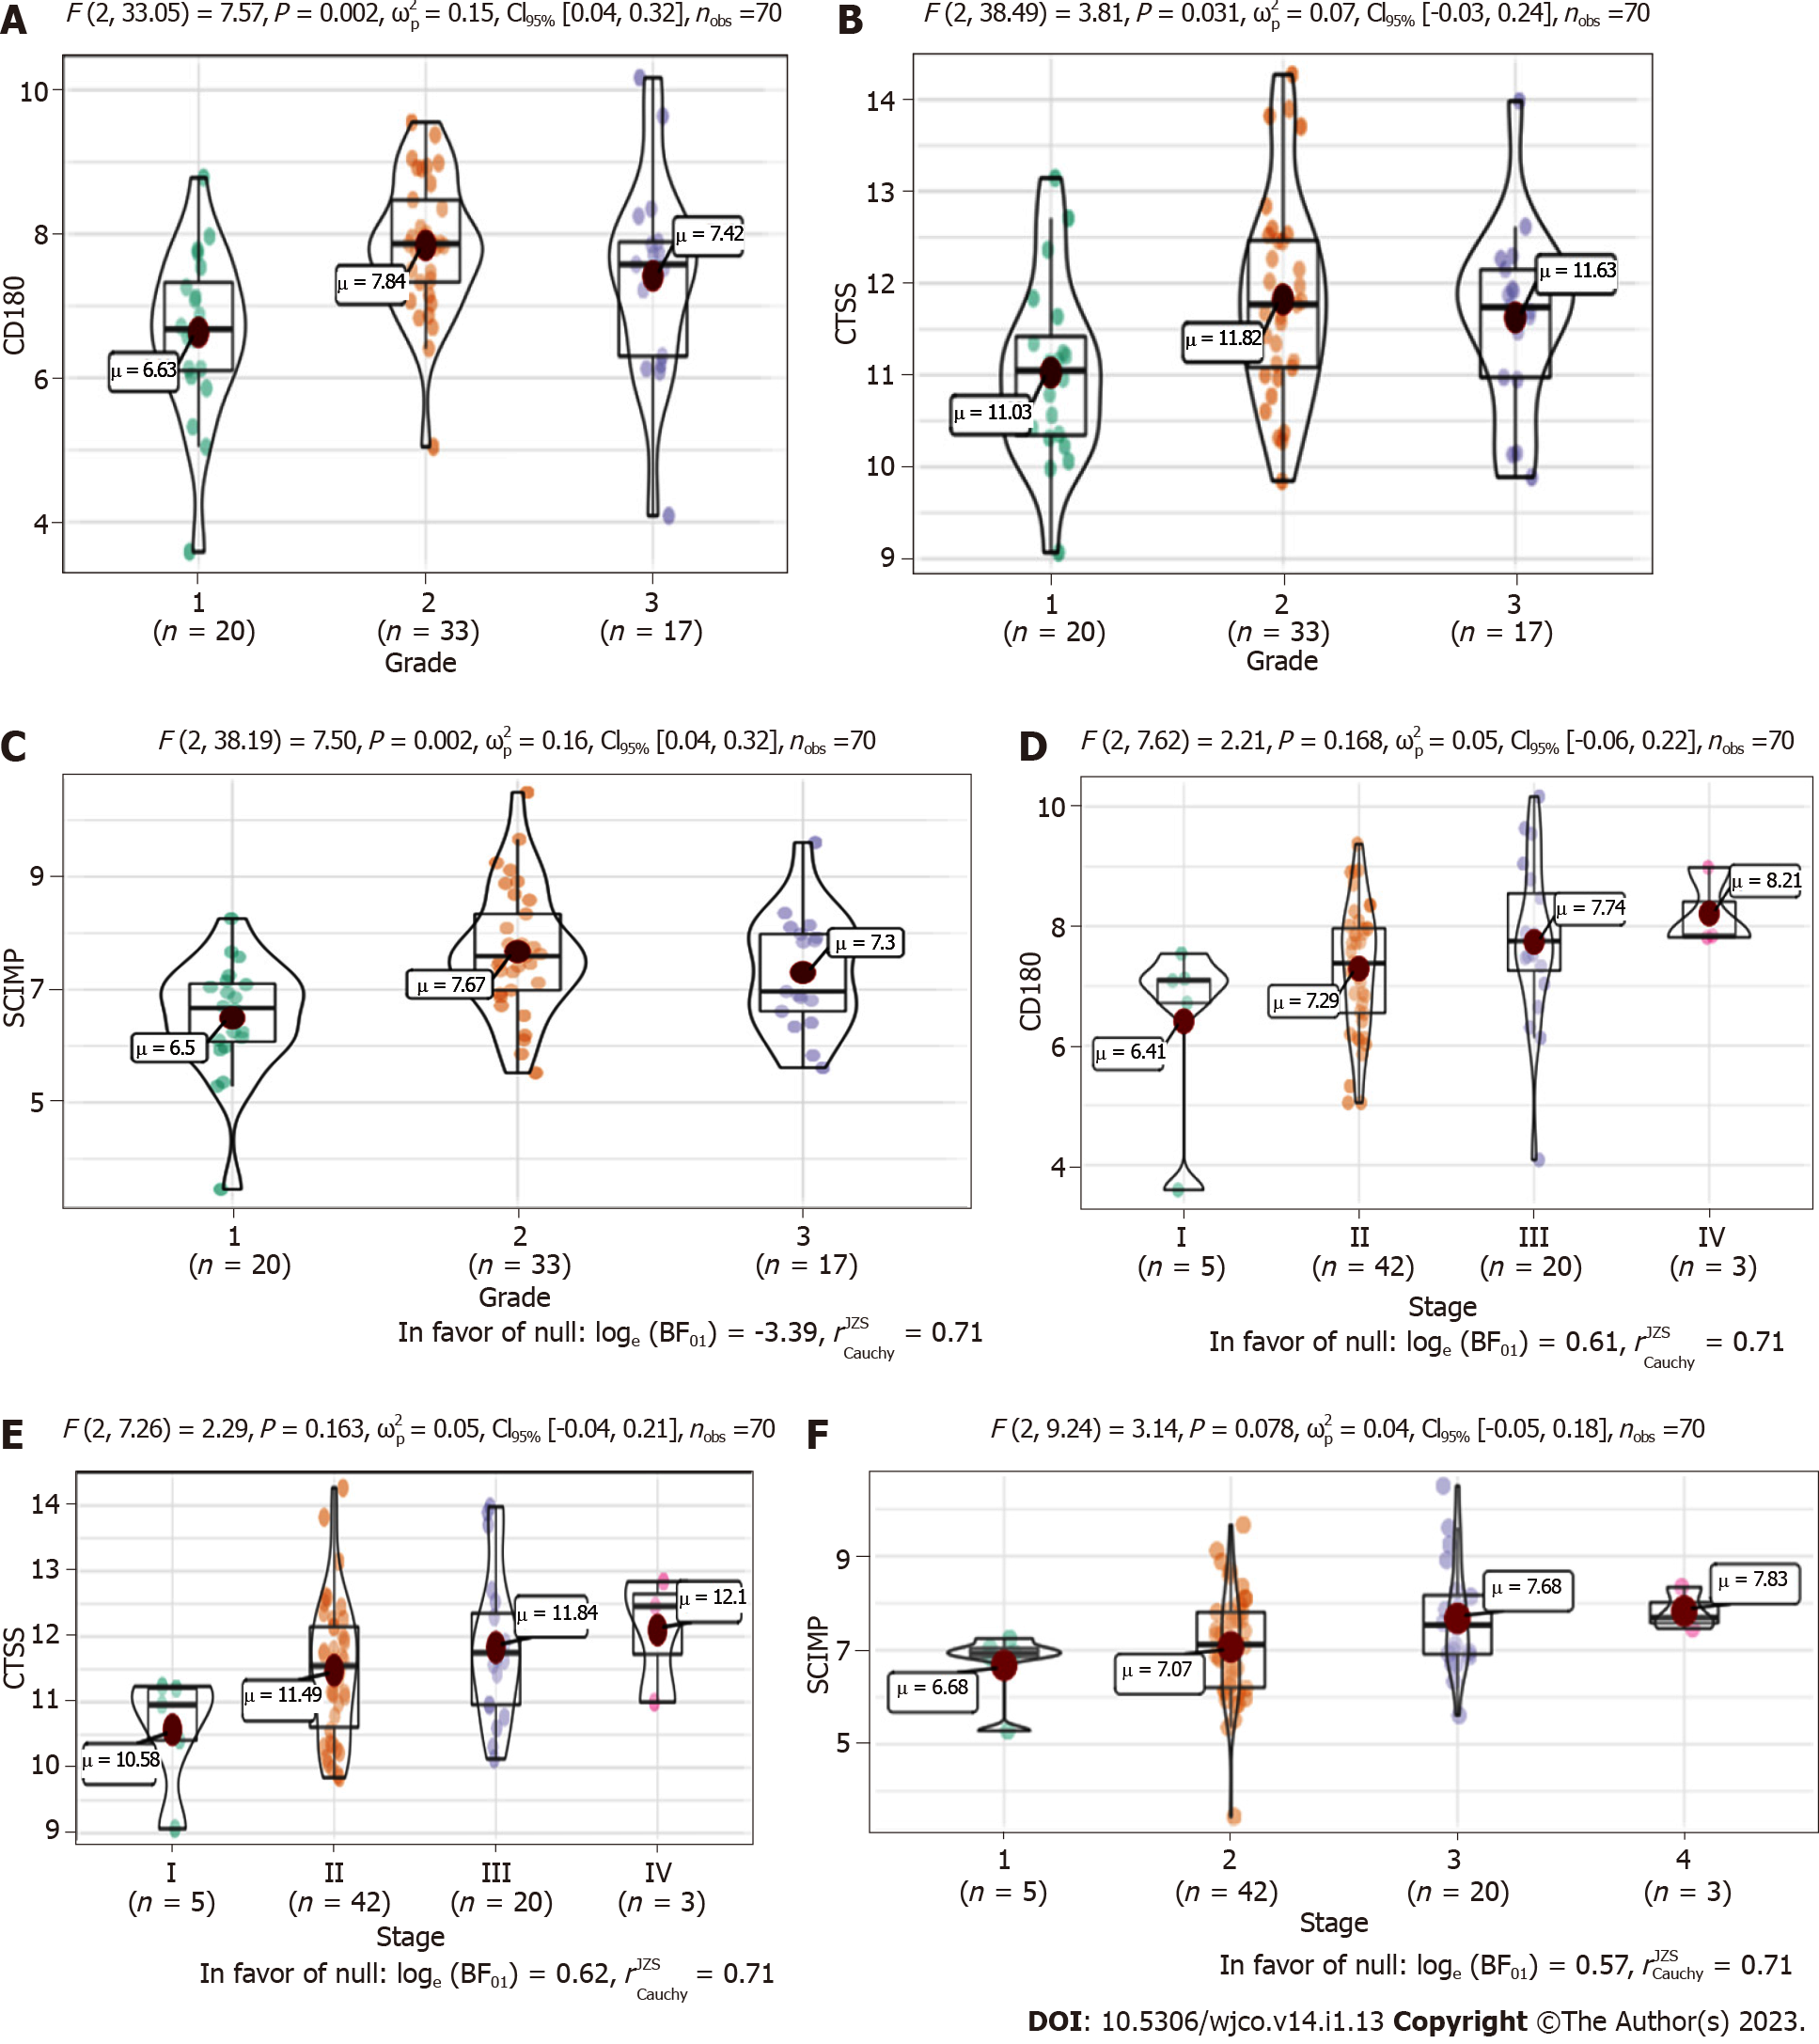
Figure 5 Association of the three radioresistance-promoting mRNAs (CTSS, CD180, and SCIMP) with tumor characteristics.
A-C: Box plots showing a positive correlation of SCIMP, CD180, and CTSS with pathological grade; D-F: Box plots showing a positive correlation of SCIMP, CD180, and CTSS with tumor-node-metastasis stage.
Figure 6 Kyoto Encyclopedia of Genes and Genomes enrichment analysis of co-expressed mRNAs.
CTSS, CD180, and SCIMP genes can interact with other co-expressed mRNAs, which were mainly enriched in 50 pathways, such as NF-kB, JAK-STAT, PD-L1 expression & PD-1 checkpoint pathway, and cell adhesion molecules signaling pathways.
- Citation: Wang XY, Beeraka NM, Xue NN, Yu HM, Yang Y, Liu MX, Nikolenko VN, Liu JQ, Zhao D. Identification of a three-gene prognostic signature for radioresistant esophageal squamous cell carcinoma. World J Clin Oncol 2023; 14(1): 13-26
- URL: https://www.wjgnet.com/2218-4333/full/v14/i1/13.htm
- DOI: https://dx.doi.org/10.5306/wjco.v14.i1.13


