Copyright
©The Author(s) 2022.
World J Clin Oncol. Jul 24, 2022; 13(7): 616-629
Published online Jul 24, 2022. doi: 10.5306/wjco.v13.i7.616
Published online Jul 24, 2022. doi: 10.5306/wjco.v13.i7.616
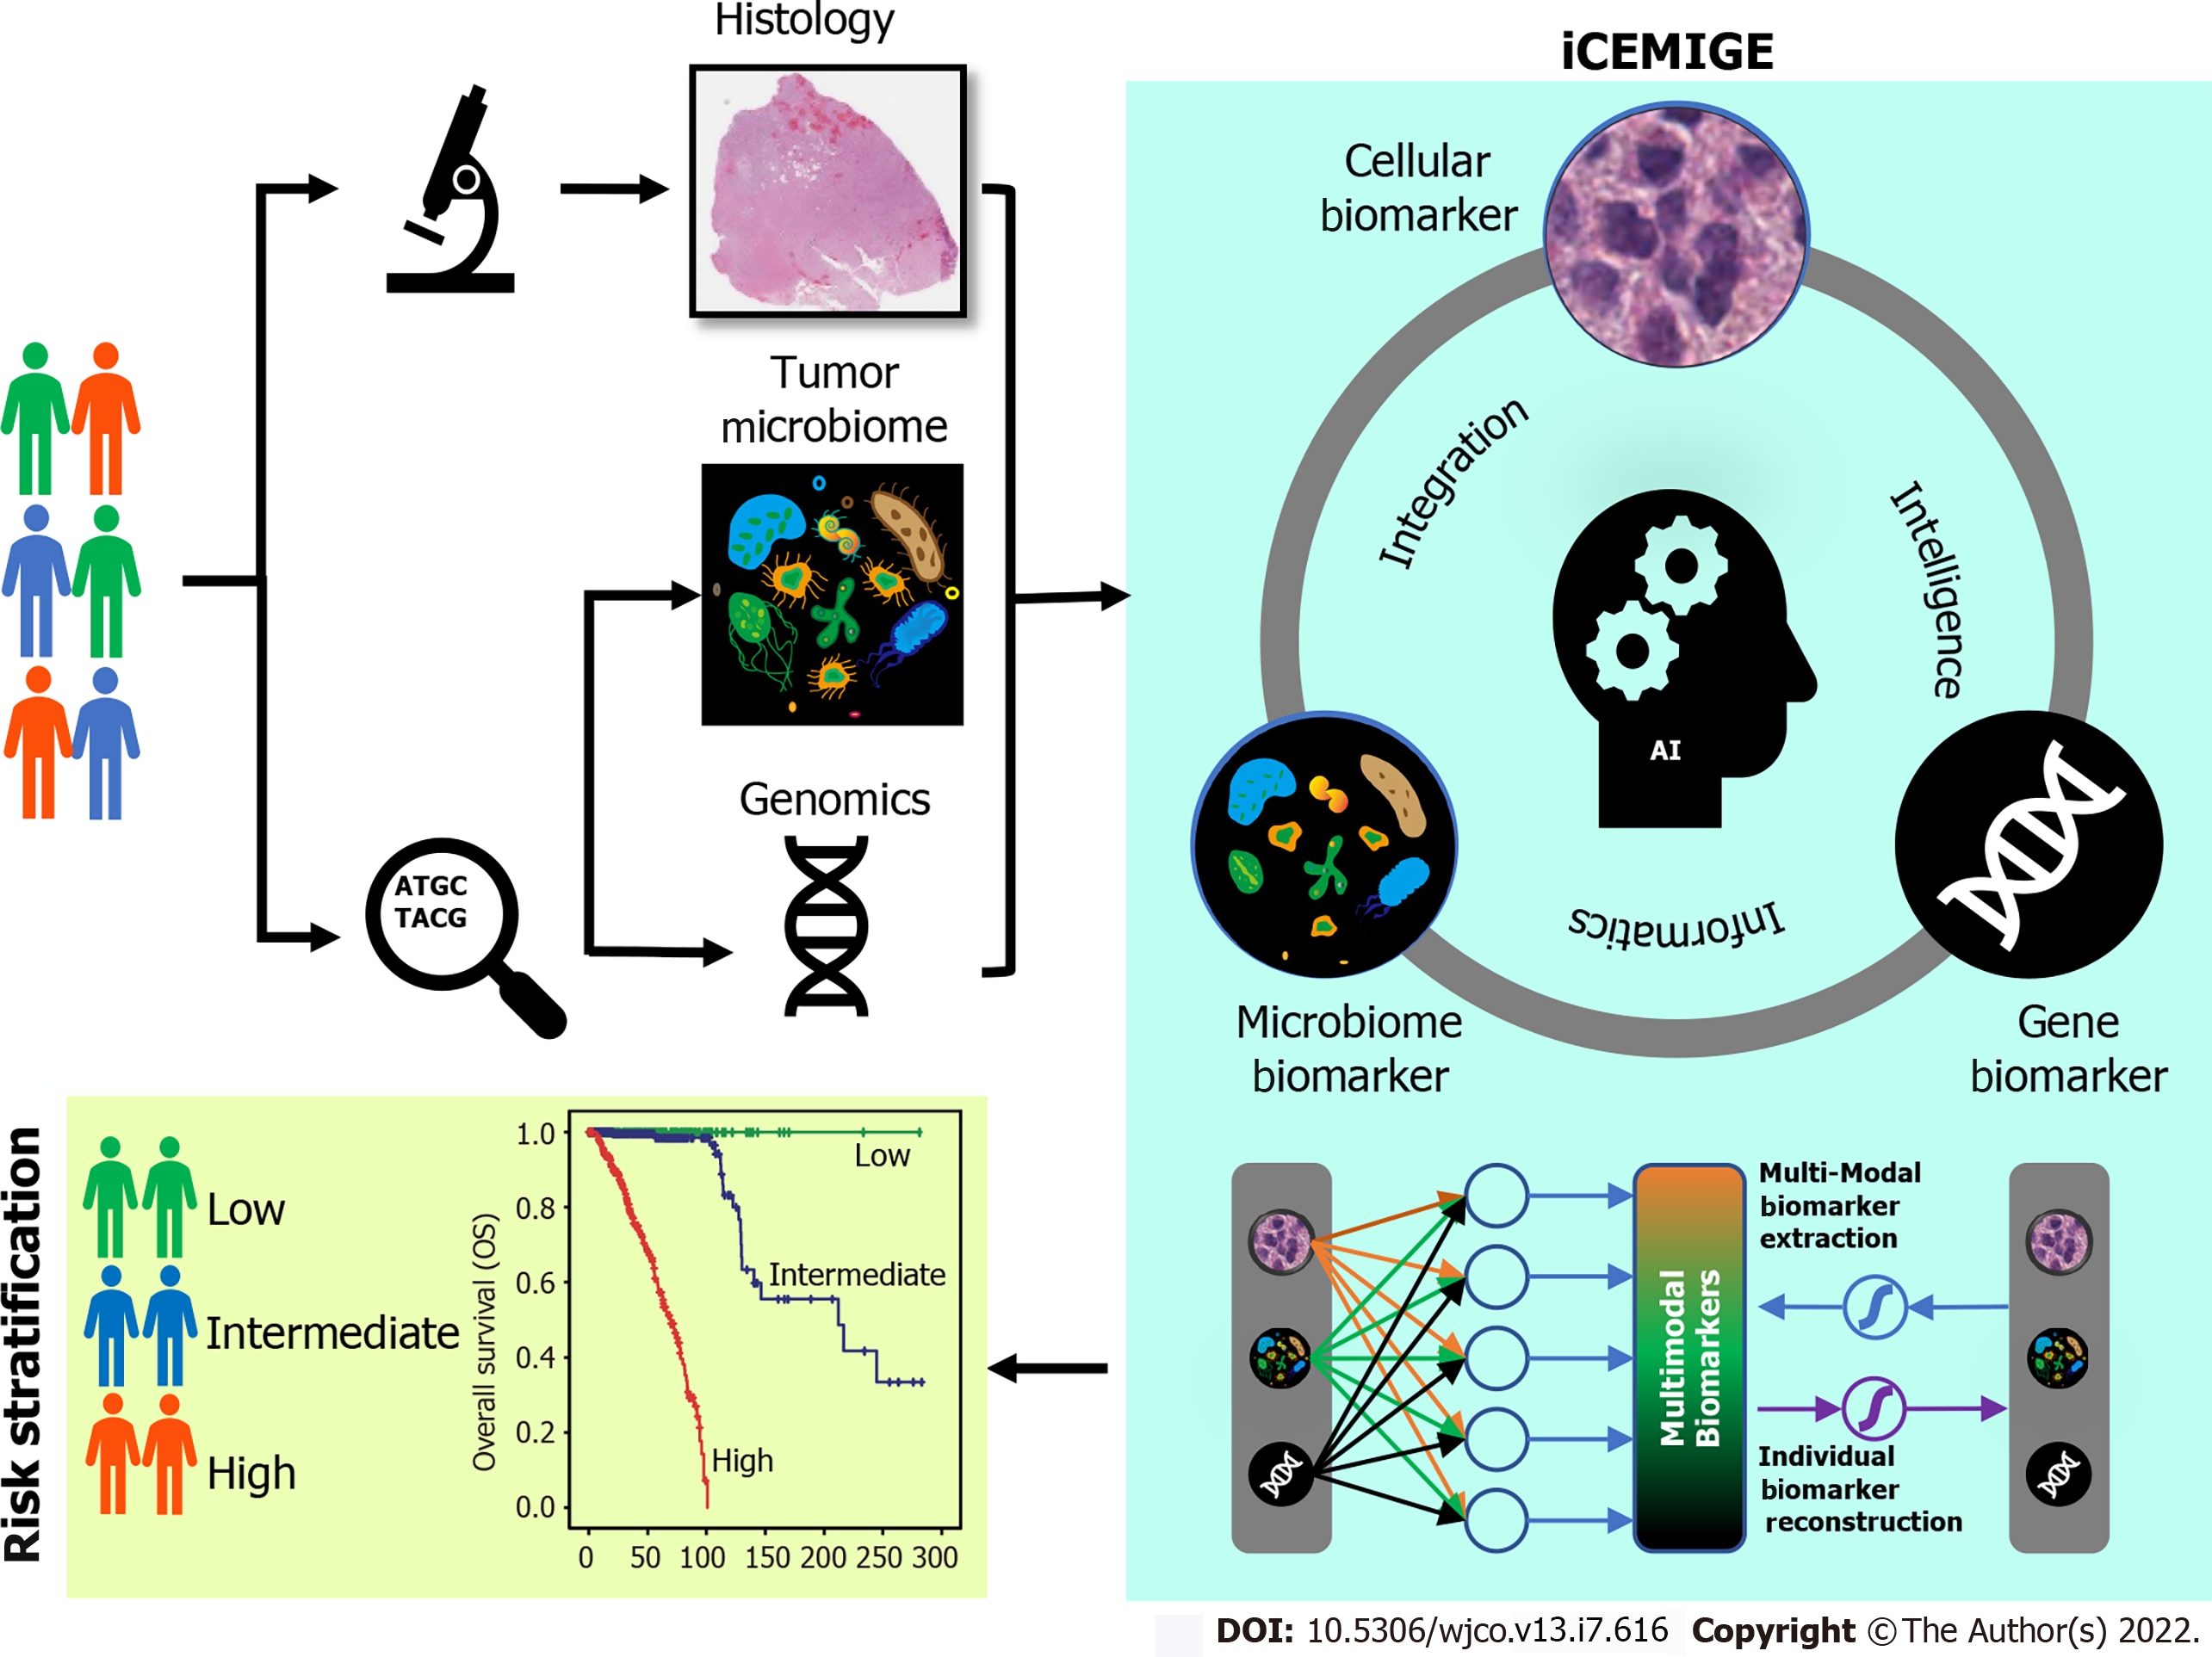
Figure 1 A schematic illustration for the study design.
Using an advanced unsupervised representation learning neural network, iCEMIGE realizes efficient and effective multi-modal biomarker mining and extraction, ensuring the optimal integration of reconstructable individual biomarkers.
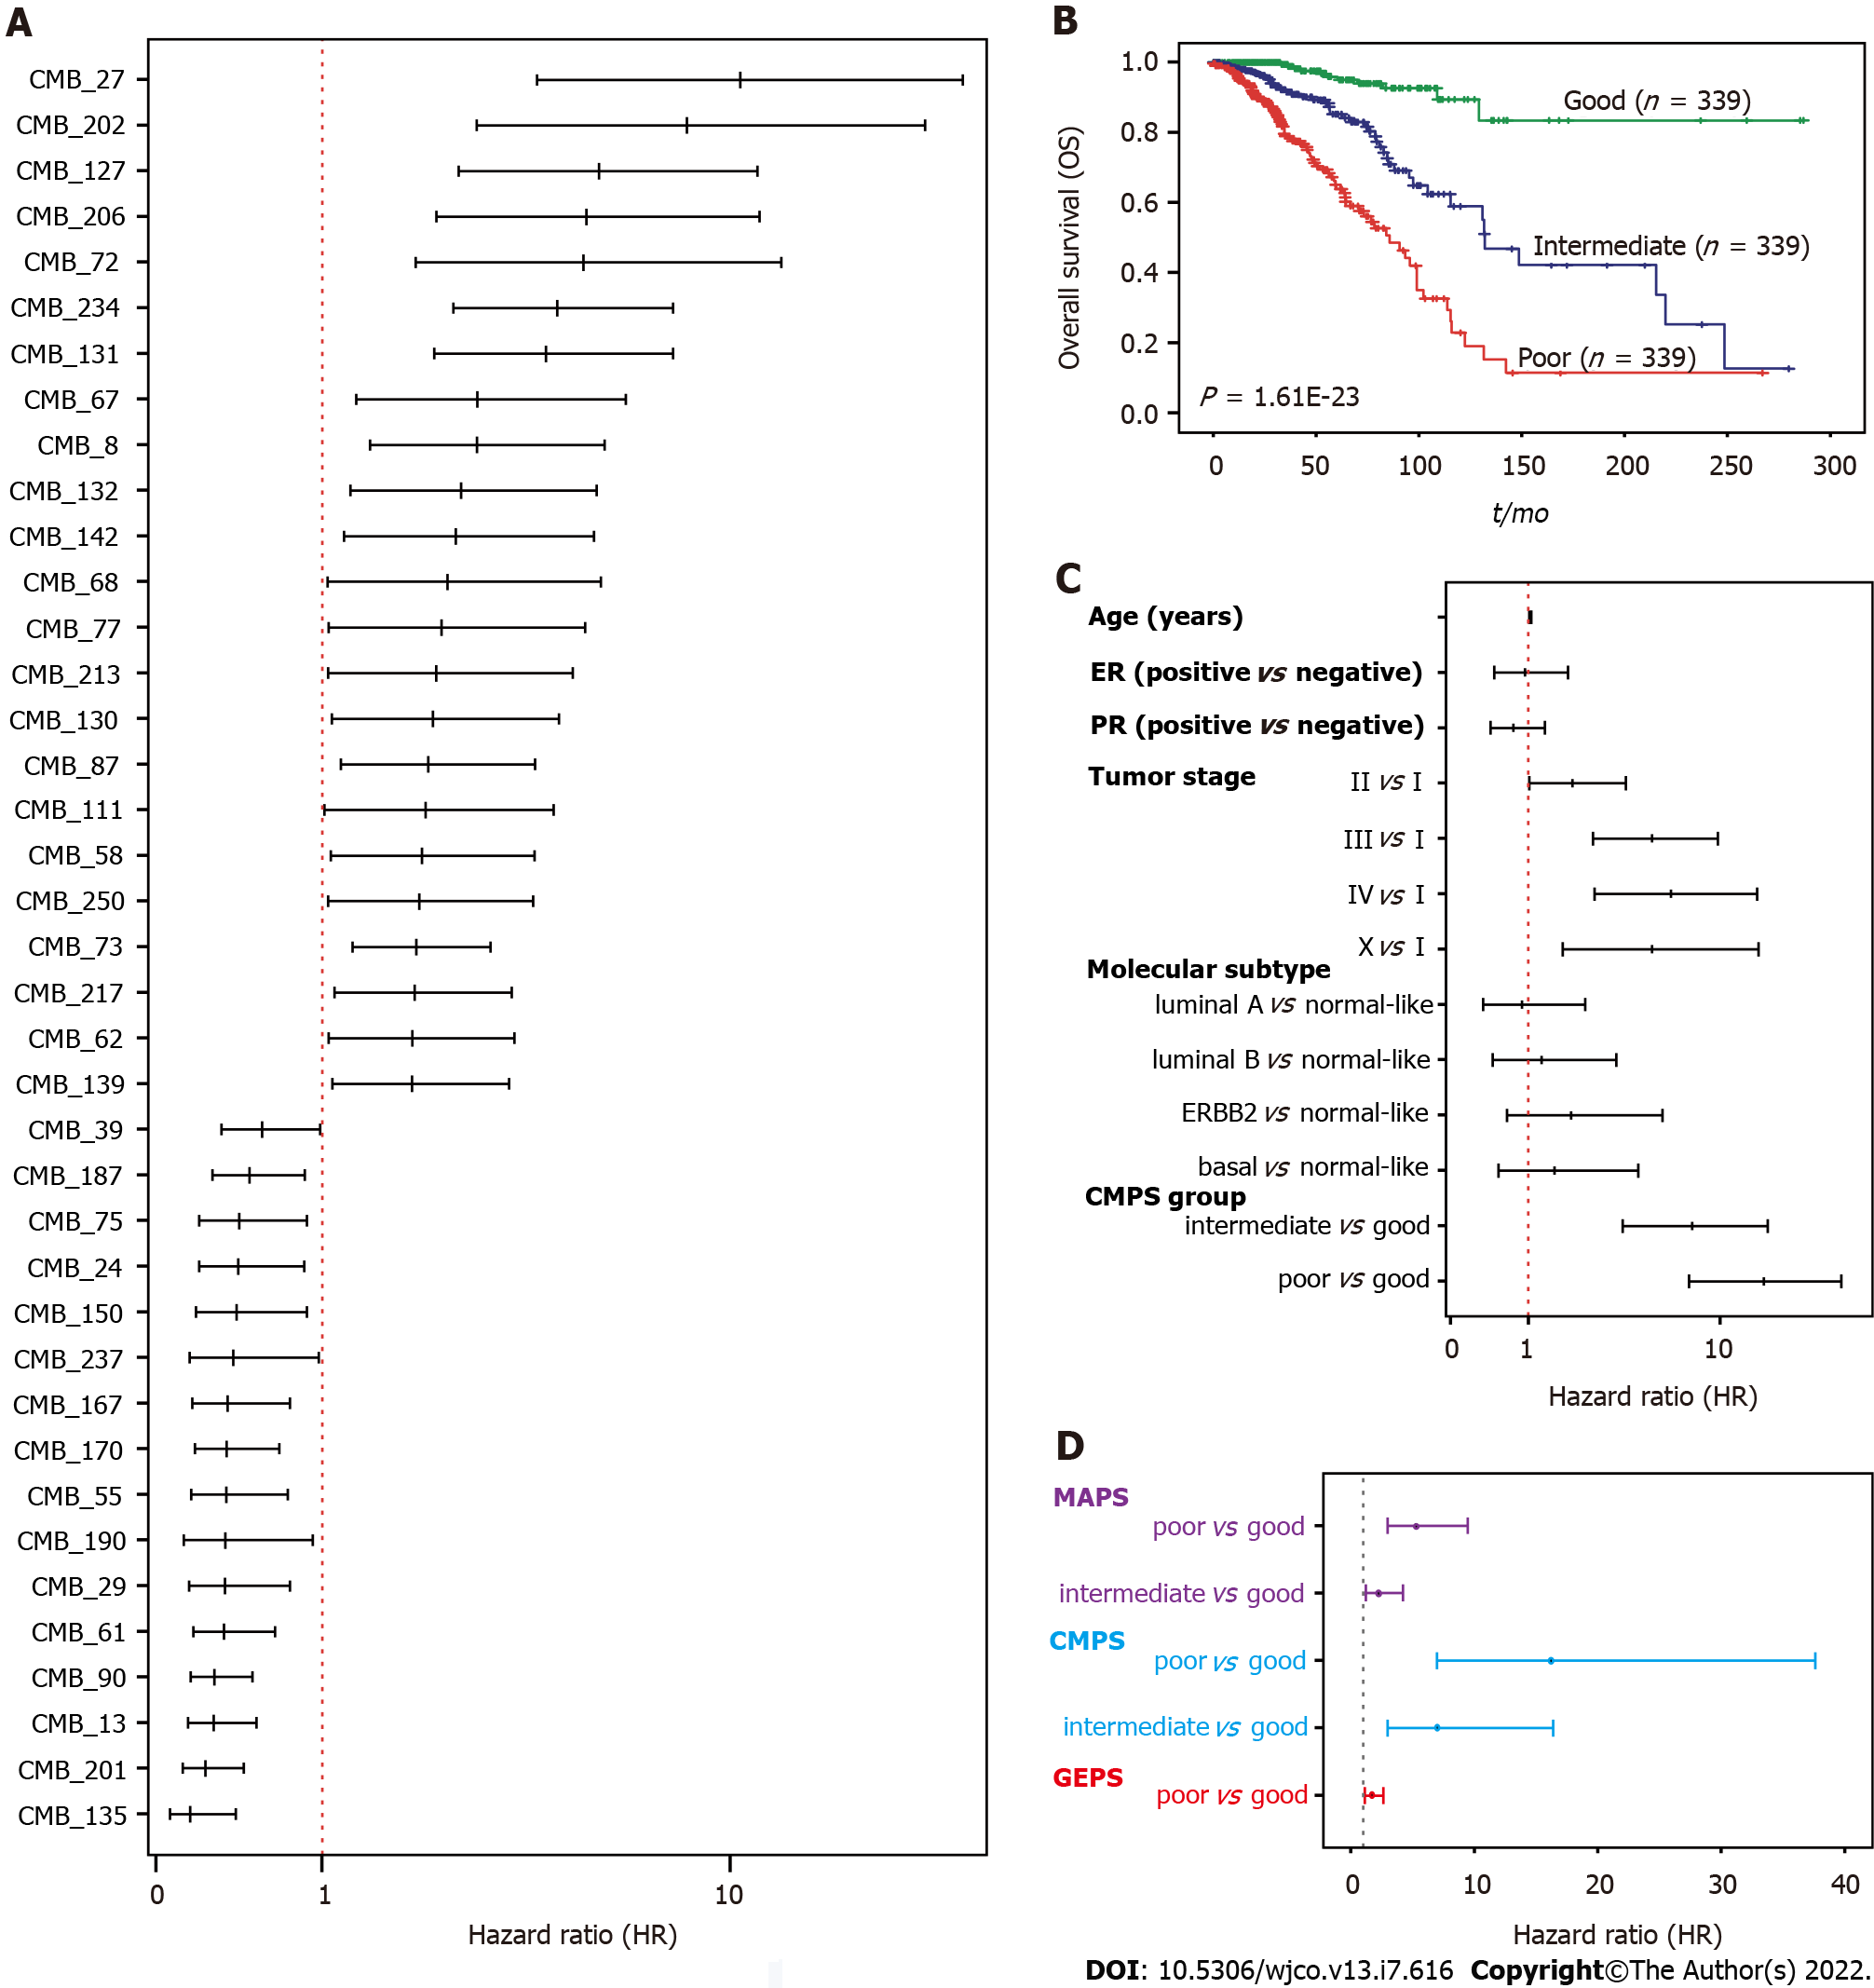
Figure 2 Prognostic value of the cellular morphometric biomarker signature.
A: Multivariate Cox regression analysis with the hazard ratio (HR) represented as a forest plot for cellular morphometric biomarkers; B: Kaplan-Meier curves on overall survival for breast cancer patients are presented with respect to the cellular morphometric prognosis score (CMPS) groups; C: Multivariate Cox regression analysis with hazard ratio (HR) represented as a forest for CMPS groups, clinical factors, and PAM50 subtypes; D: Multivariate Cox regression analysis with the HR represented as a forest plot for CMPS, MAPS, and GEPS.
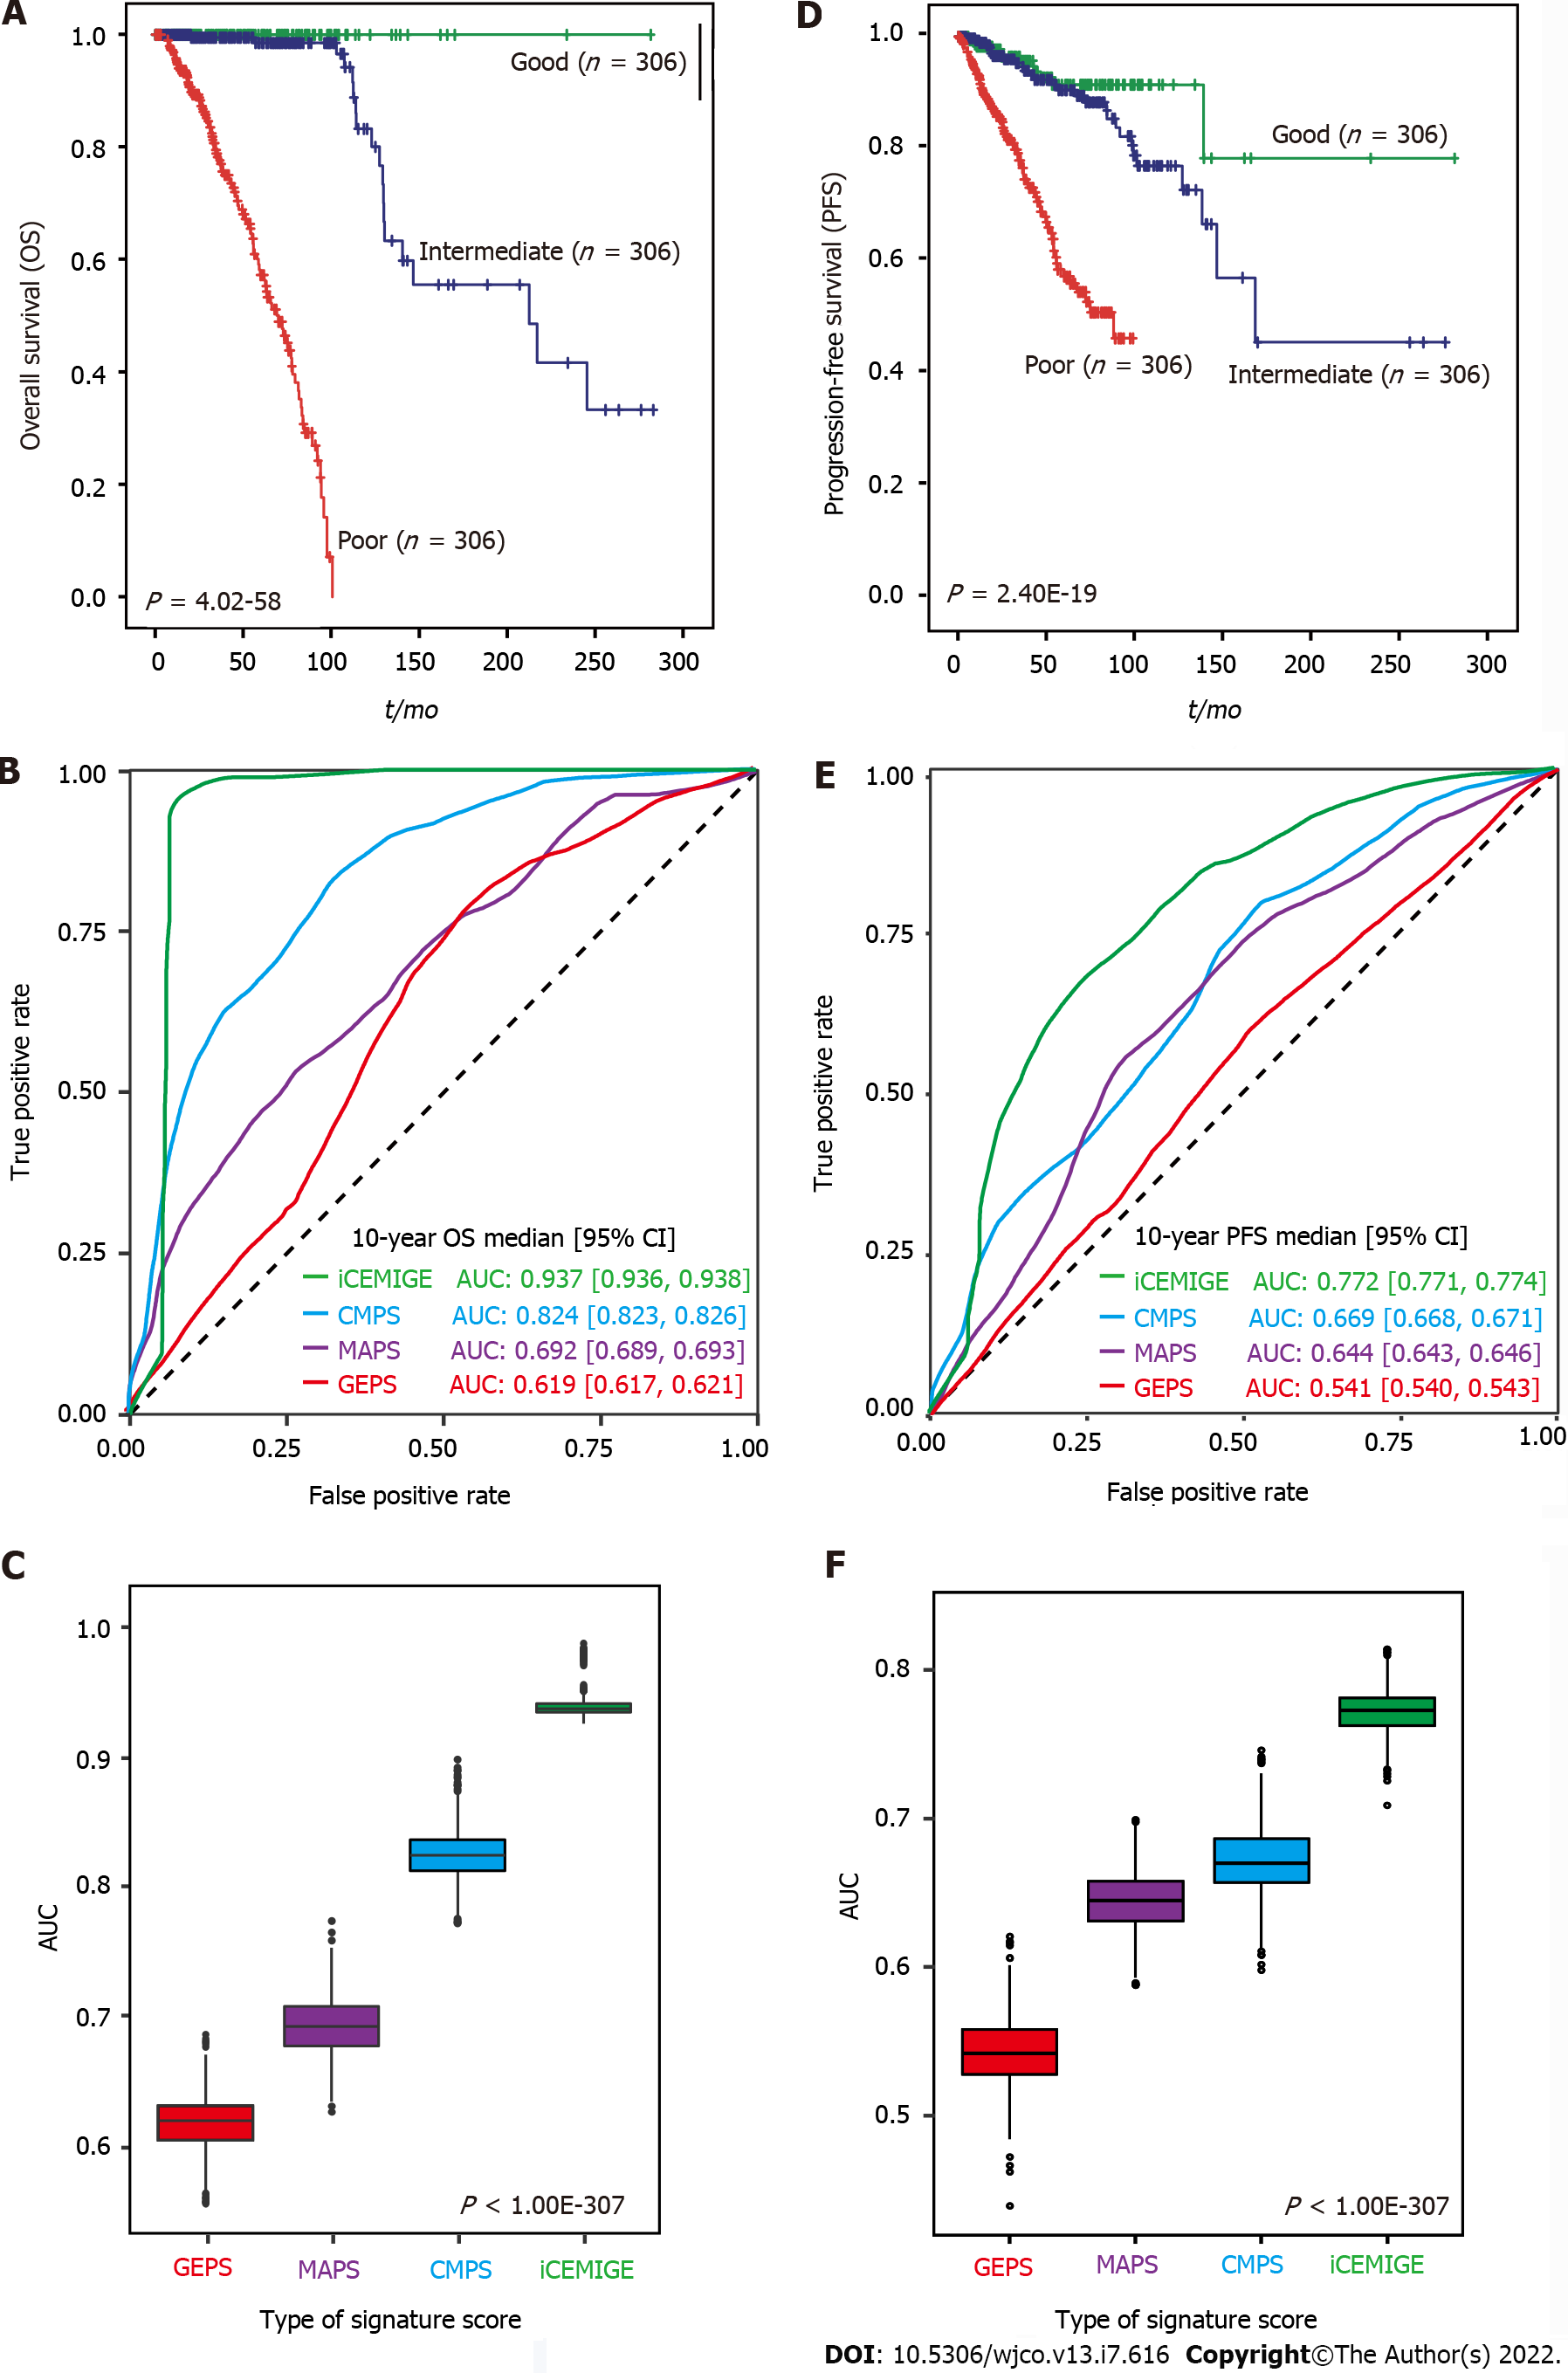
Figure 3 iCEMIGE significantly outperforms cellular morphometric prognosis score, 15-microbe abundance prognosis score, and cellular morphometric prognosis score in prognosis prediction in the Cancer Genome Atlas breast cancer cohort.
A: Kaplan-Meier overall survival (OS) curves for breast cancer (BC) patients are presented according to iCEMIGE score groups; B: ROC curves for 10-year OS prediction across different signature scores. C: Area under the curve (AUC) of 10-year OS prediction across different signature scores; D: Kaplan-Meier progress-free survival (PFS) curves for BC patients are presented according to iCEMIGE score groups; E: Receiver operating characteristic (ROC) curves for 10-year PFS prediction across different signature scores. F: AUC of 10-year PFS prediction across different signature scores. The Kaplan-Meier p-values were calculated by the log-rank test among the three groups. The P values for AUC were obtained from Kruskal-Wallis test.
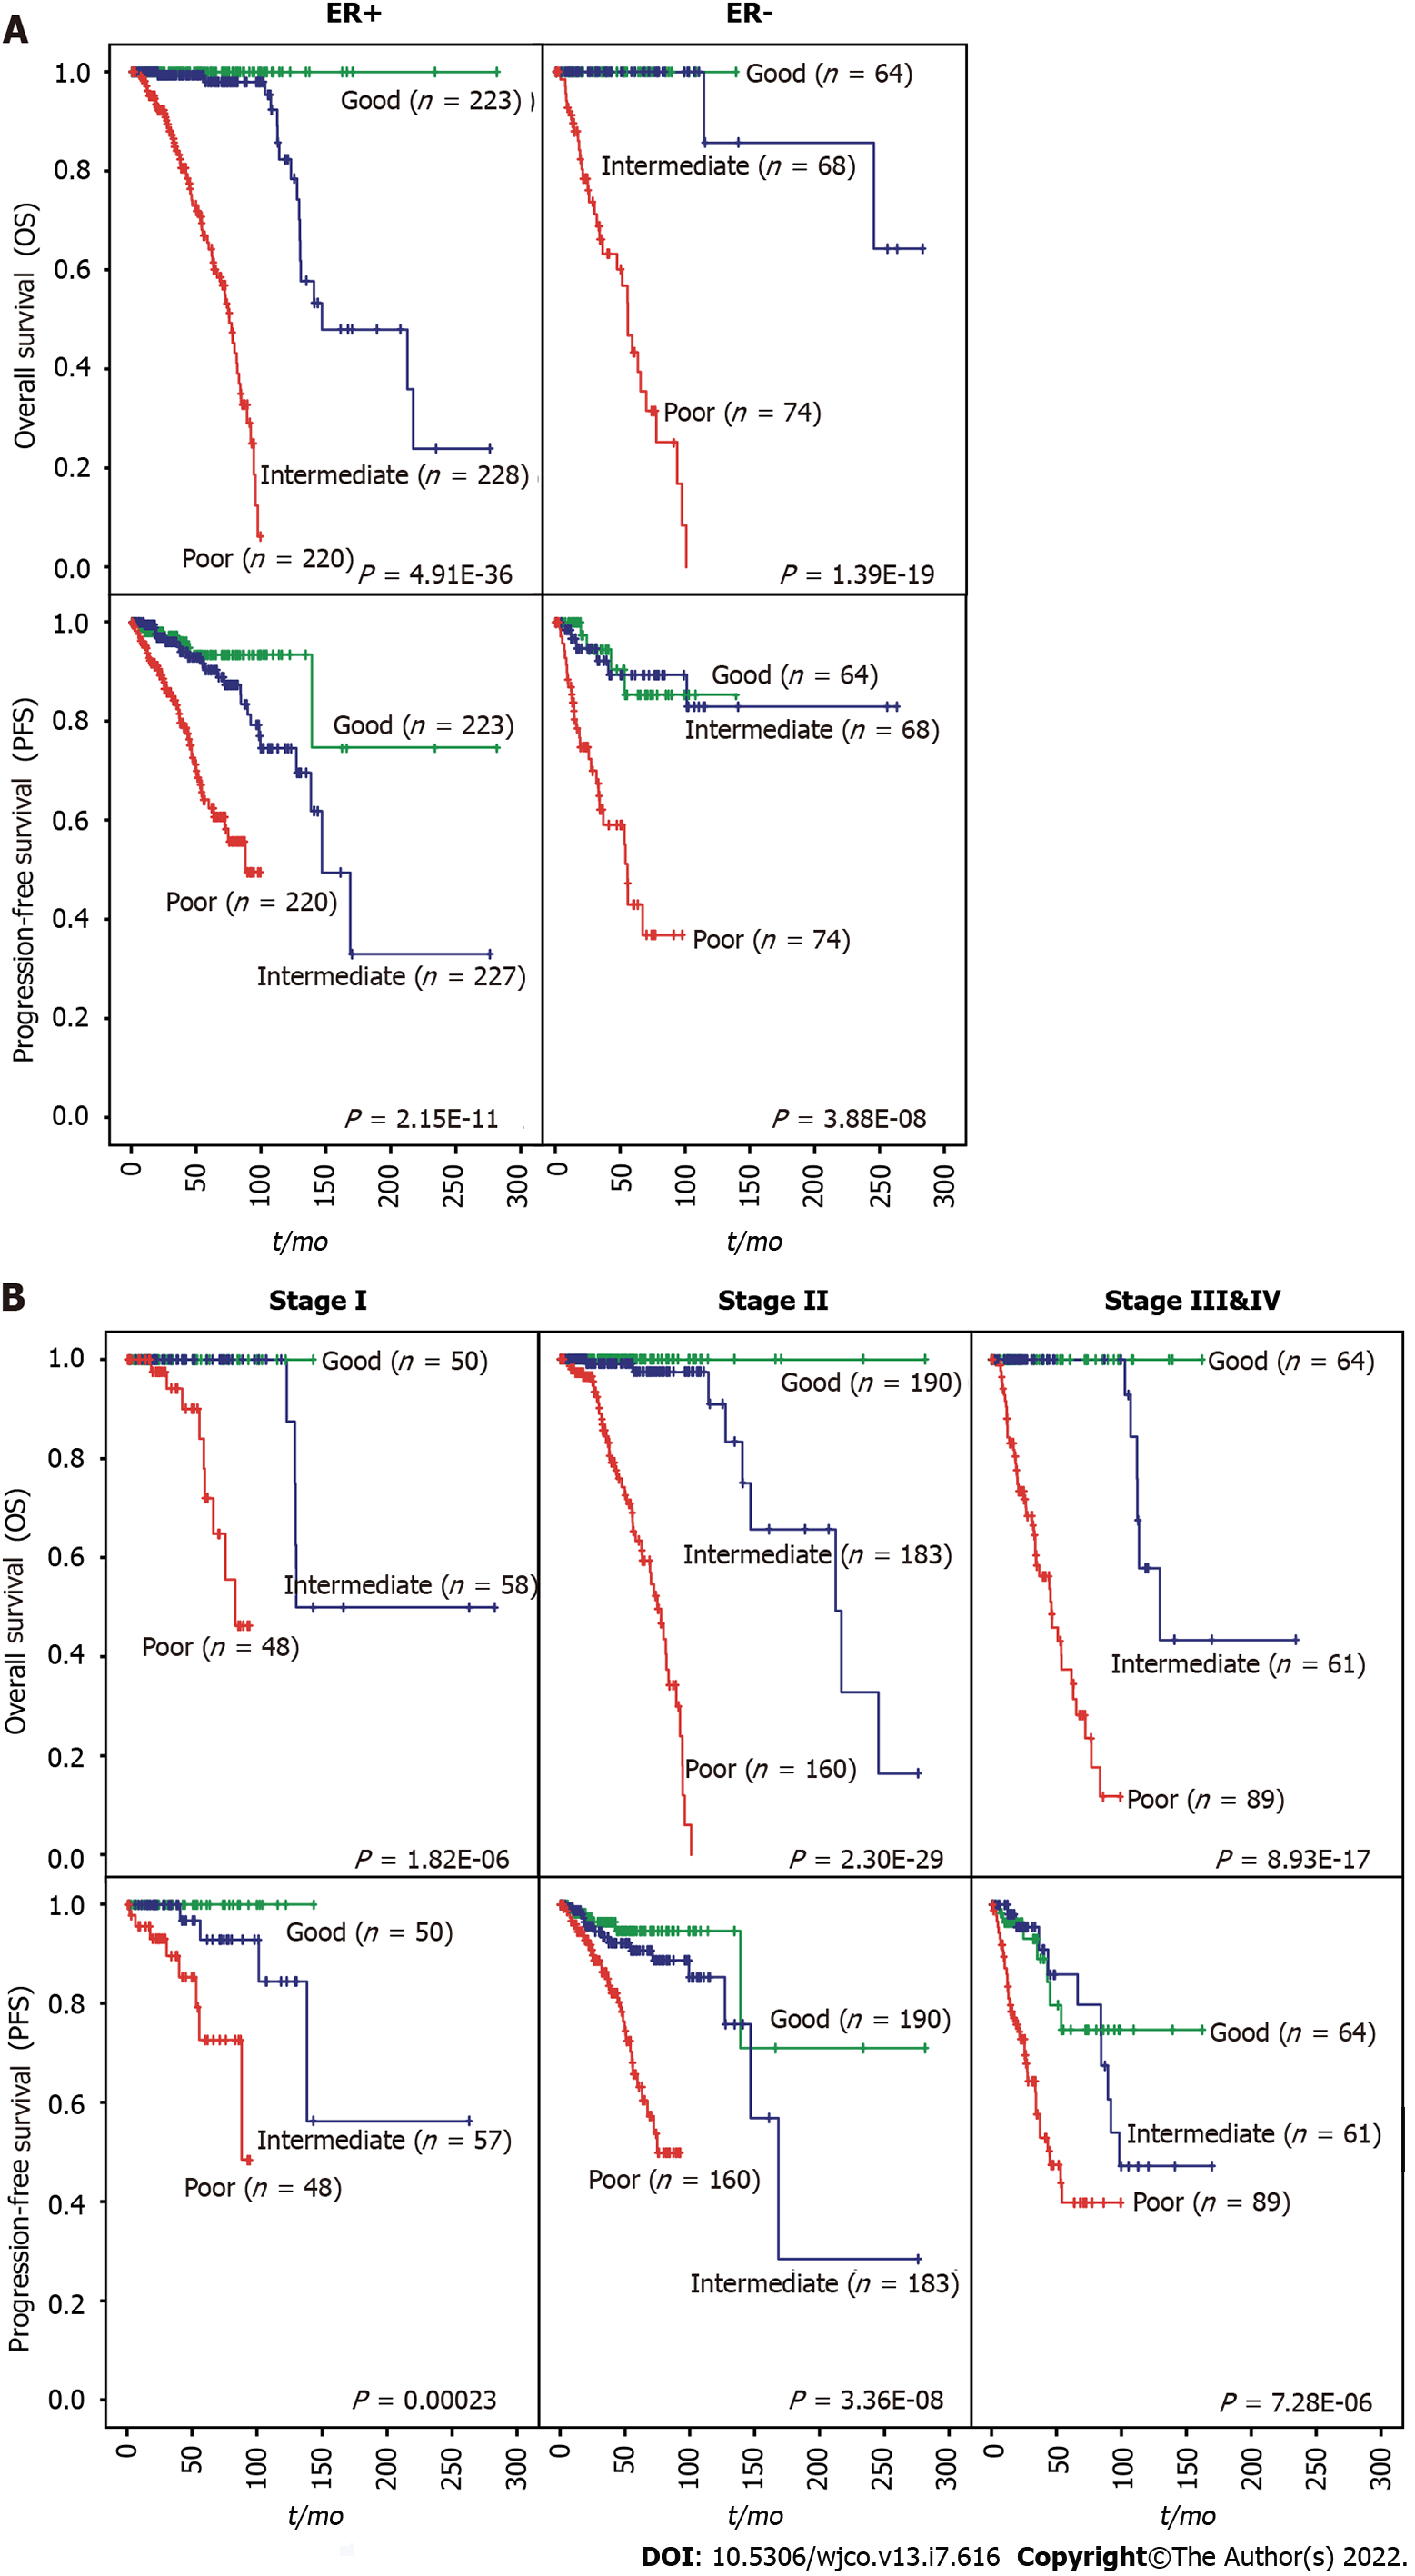
Figure 4 Prognostic value of iCEMIGE score on overall survival and progress-free survival according to ER status and tumor stage.
A: Kaplan-Meier curves on overall survival (OS) (top panel) and progress-free survival (PFS) (bottom panel) for ER+ and ER- breast cancer (BC) patients are presented according to iCEMIGE score groups; B: Kaplan-Meier curves on OS (top panel) and PFS (bottom panel) for Stage I, II, and III&IV BC patients are presented according to iCEMIGE score groups. The P values were obtained from the log-rank test among the three groups.
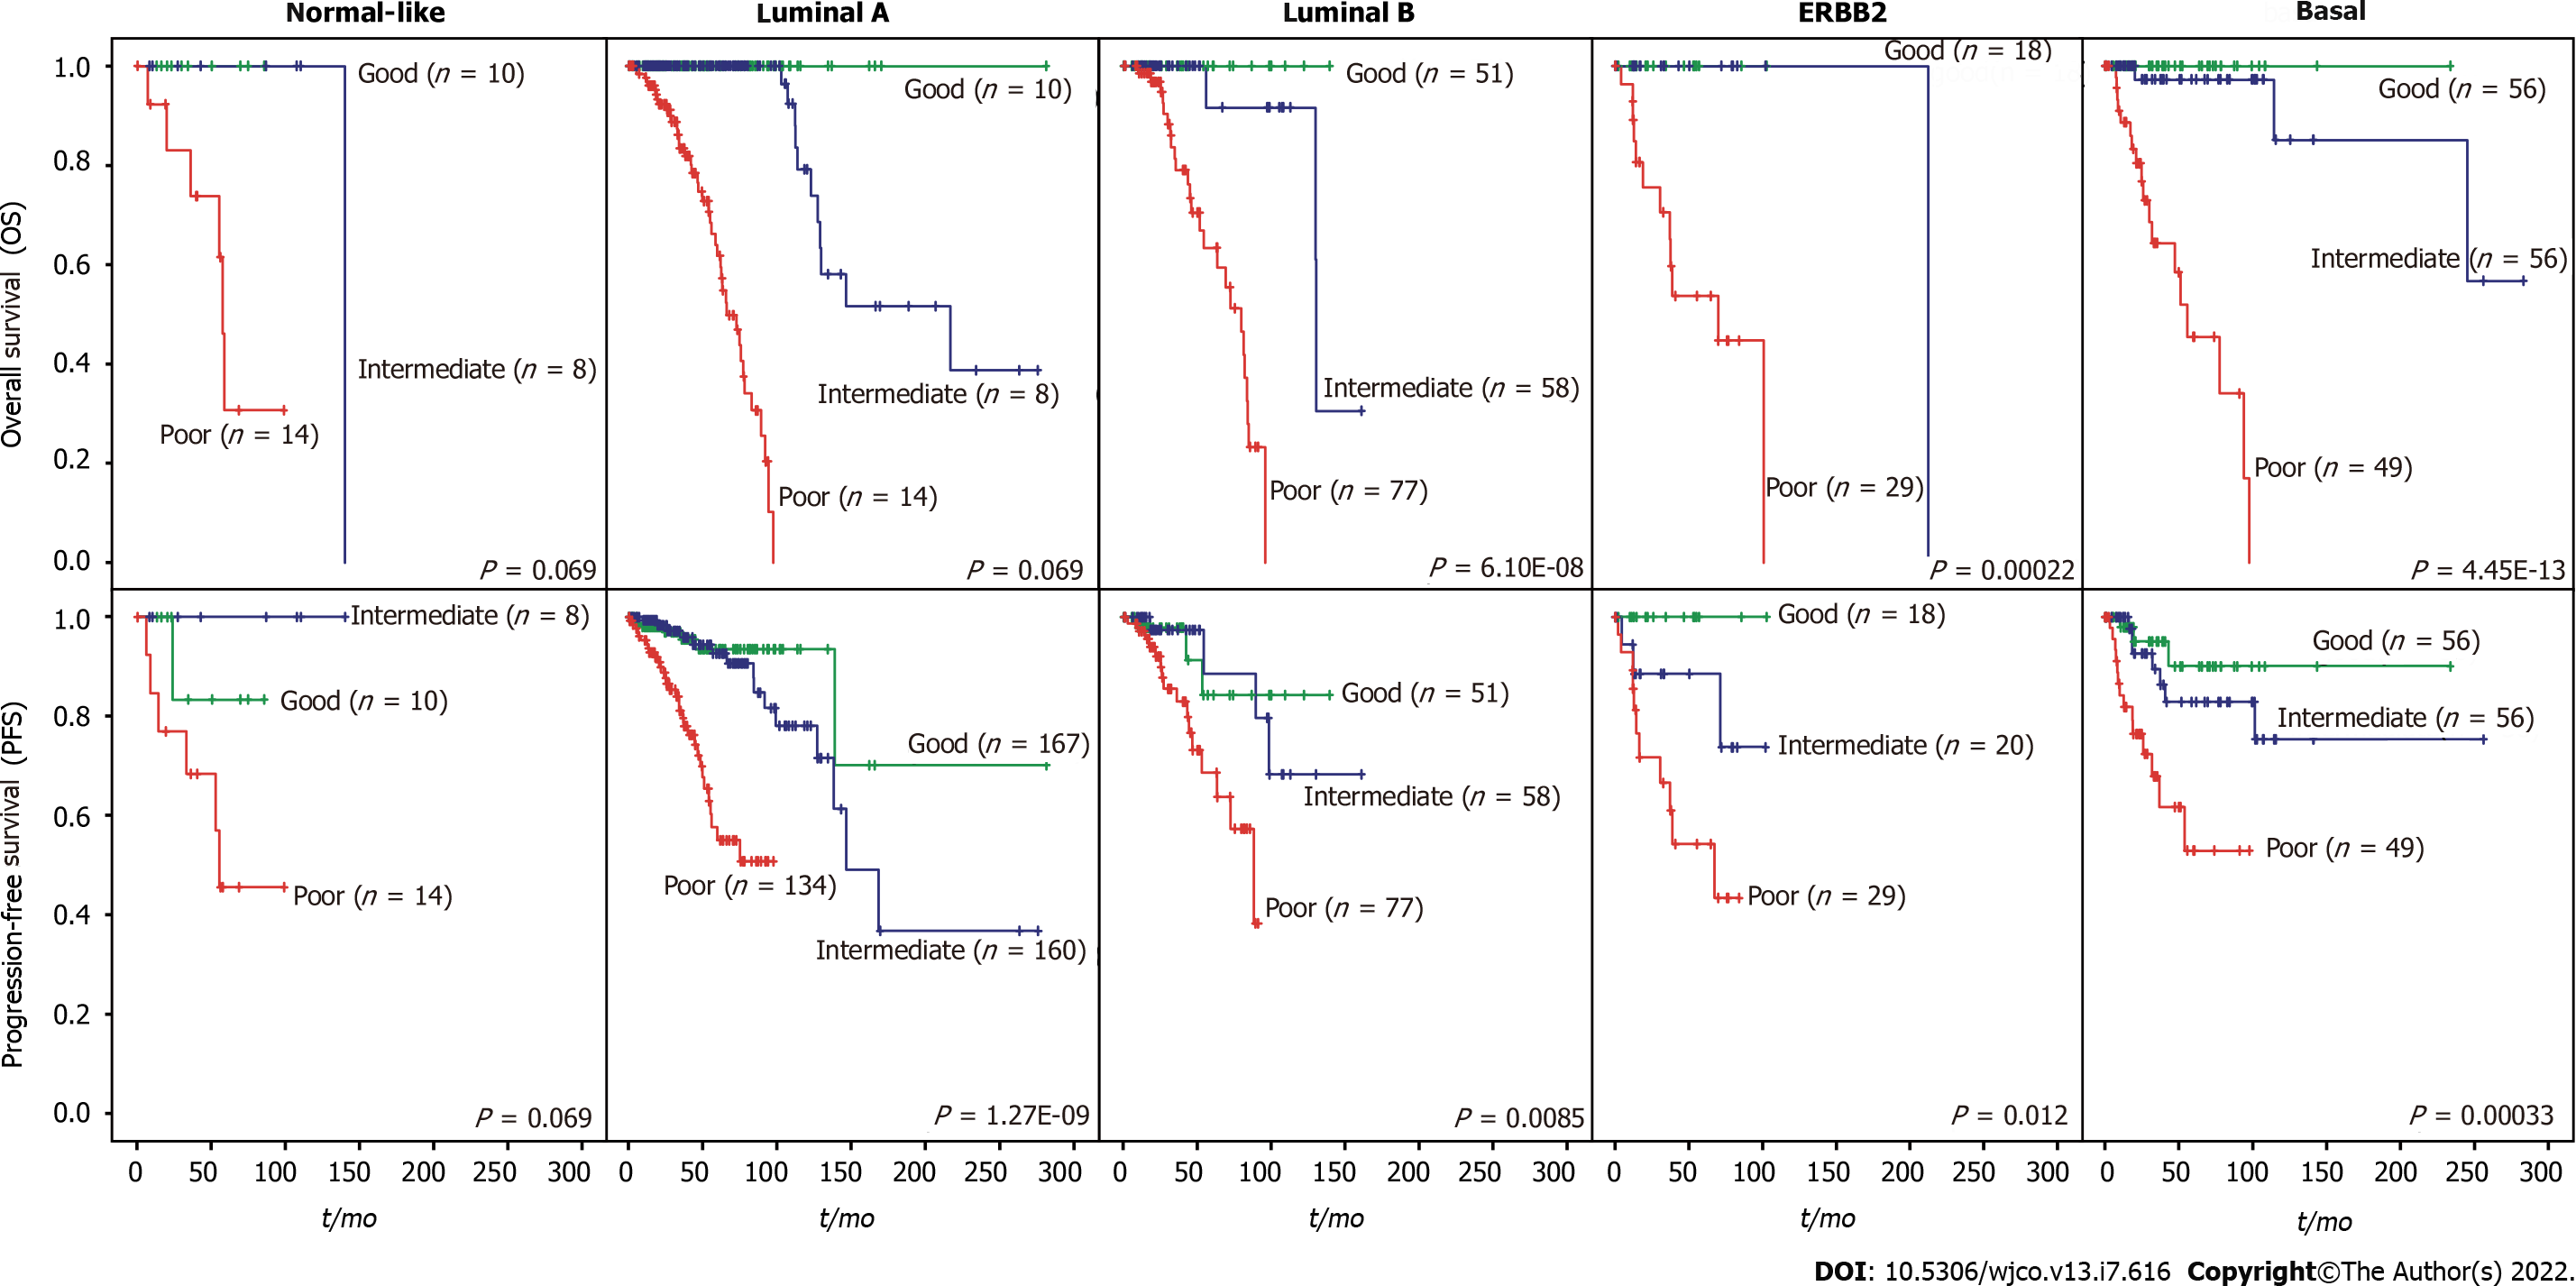
Figure 5 Prognostic value of iCEMIGE scores on overall survival and progress-free survival within different molecular subtypes.
Kaplan-Meier curves on overall survival (top panel) and progress-free survival (bottom panel) for breast cancer patients are presented with respect to the iCEMIGE score groups in different molecular subtypes. The P values were calculated by the log-rank test among the three groups.
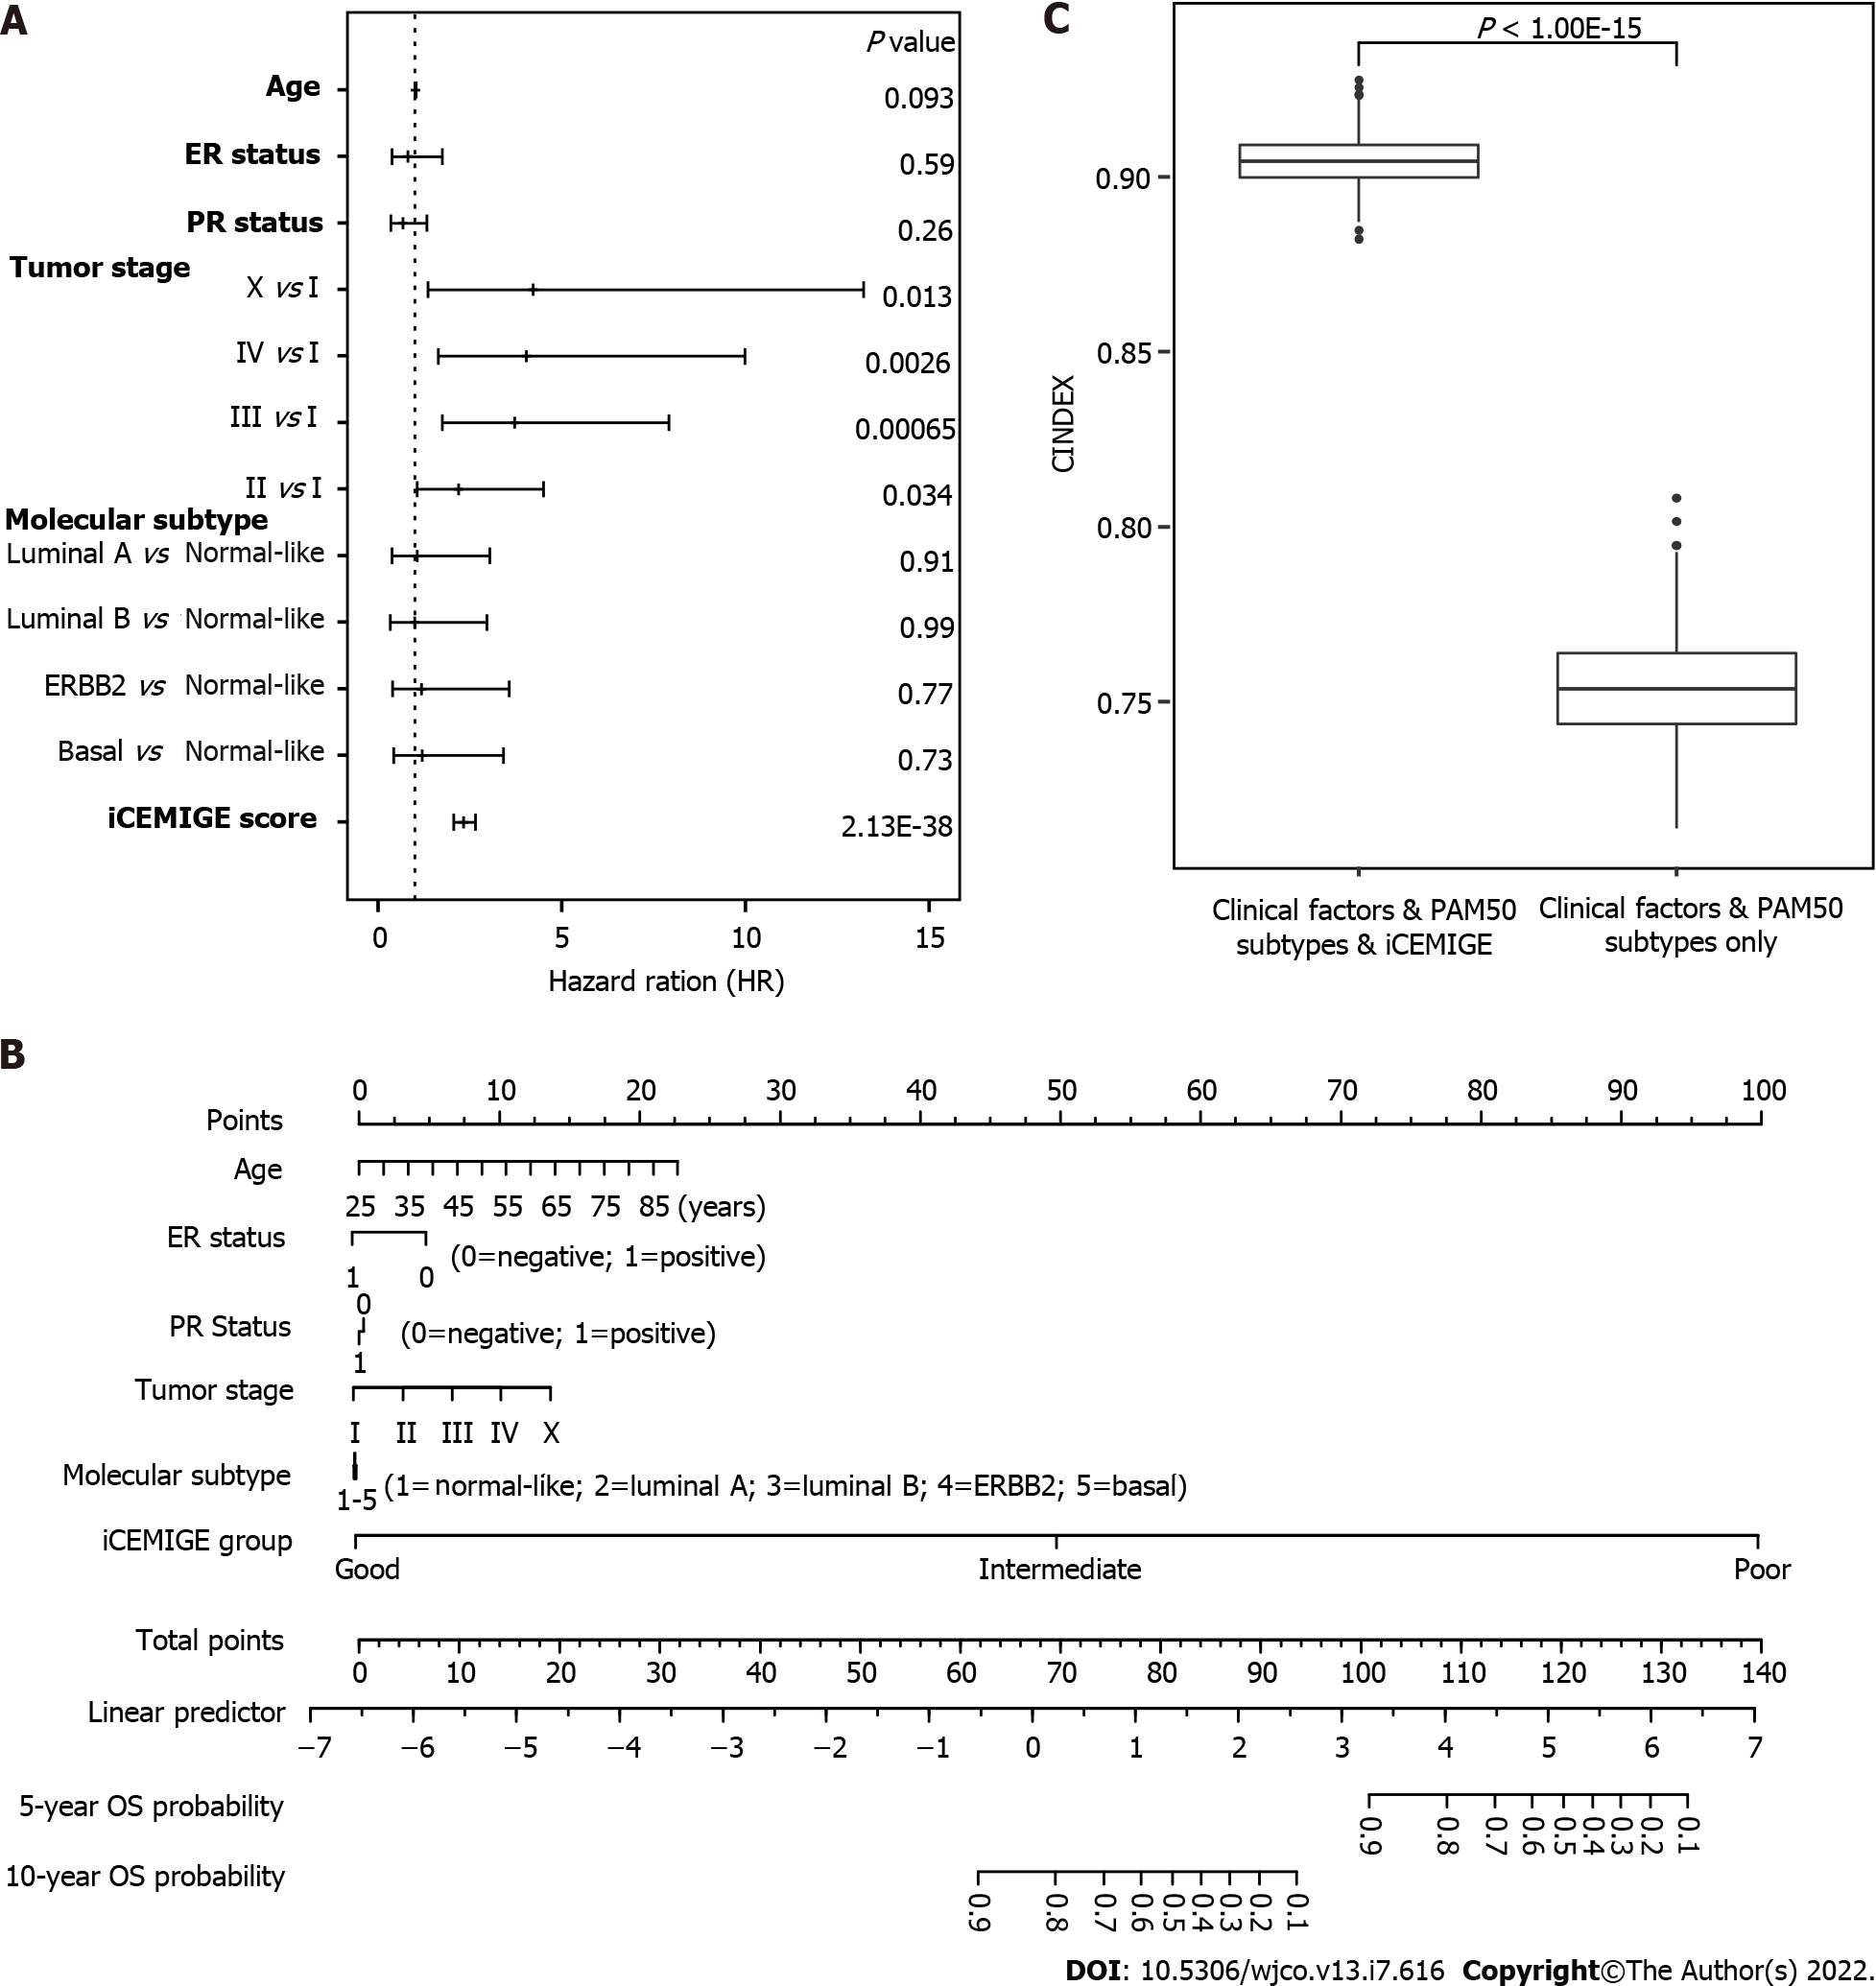
Figure 6 iCEMIGE score provides significant and additional value for overall survival prediction.
A: Multivariate Cox regression analysis of overall survival (OS) with hazard ratio represented as a forest for iCEMIGE score, clinical factors, and PAM50 subtypes; B: Nomogram for predicting OS was constructed based on integrating clinical factors and molecular subtype with iCEMIGE; C: C-index comparison for OS in different nomogram models with and without iCEMIGE. The P value was calculated by Mann-Whitney non-parametric test.
- Citation: Mao XY, Perez-Losada J, Abad M, Rodríguez-González M, Rodríguez CA, Mao JH, Chang H. iCEMIGE: Integration of CEll-morphometrics, MIcrobiome, and GEne biomarker signatures for risk stratification in breast cancers. World J Clin Oncol 2022; 13(7): 616-629
- URL: https://www.wjgnet.com/2218-4333/full/v13/i7/616.htm
- DOI: https://dx.doi.org/10.5306/wjco.v13.i7.616


