Copyright
©The Author(s) 2022.
World J Clin Oncol. Feb 24, 2022; 13(2): 147-158
Published online Feb 24, 2022. doi: 10.5306/wjco.v13.i2.147
Published online Feb 24, 2022. doi: 10.5306/wjco.v13.i2.147
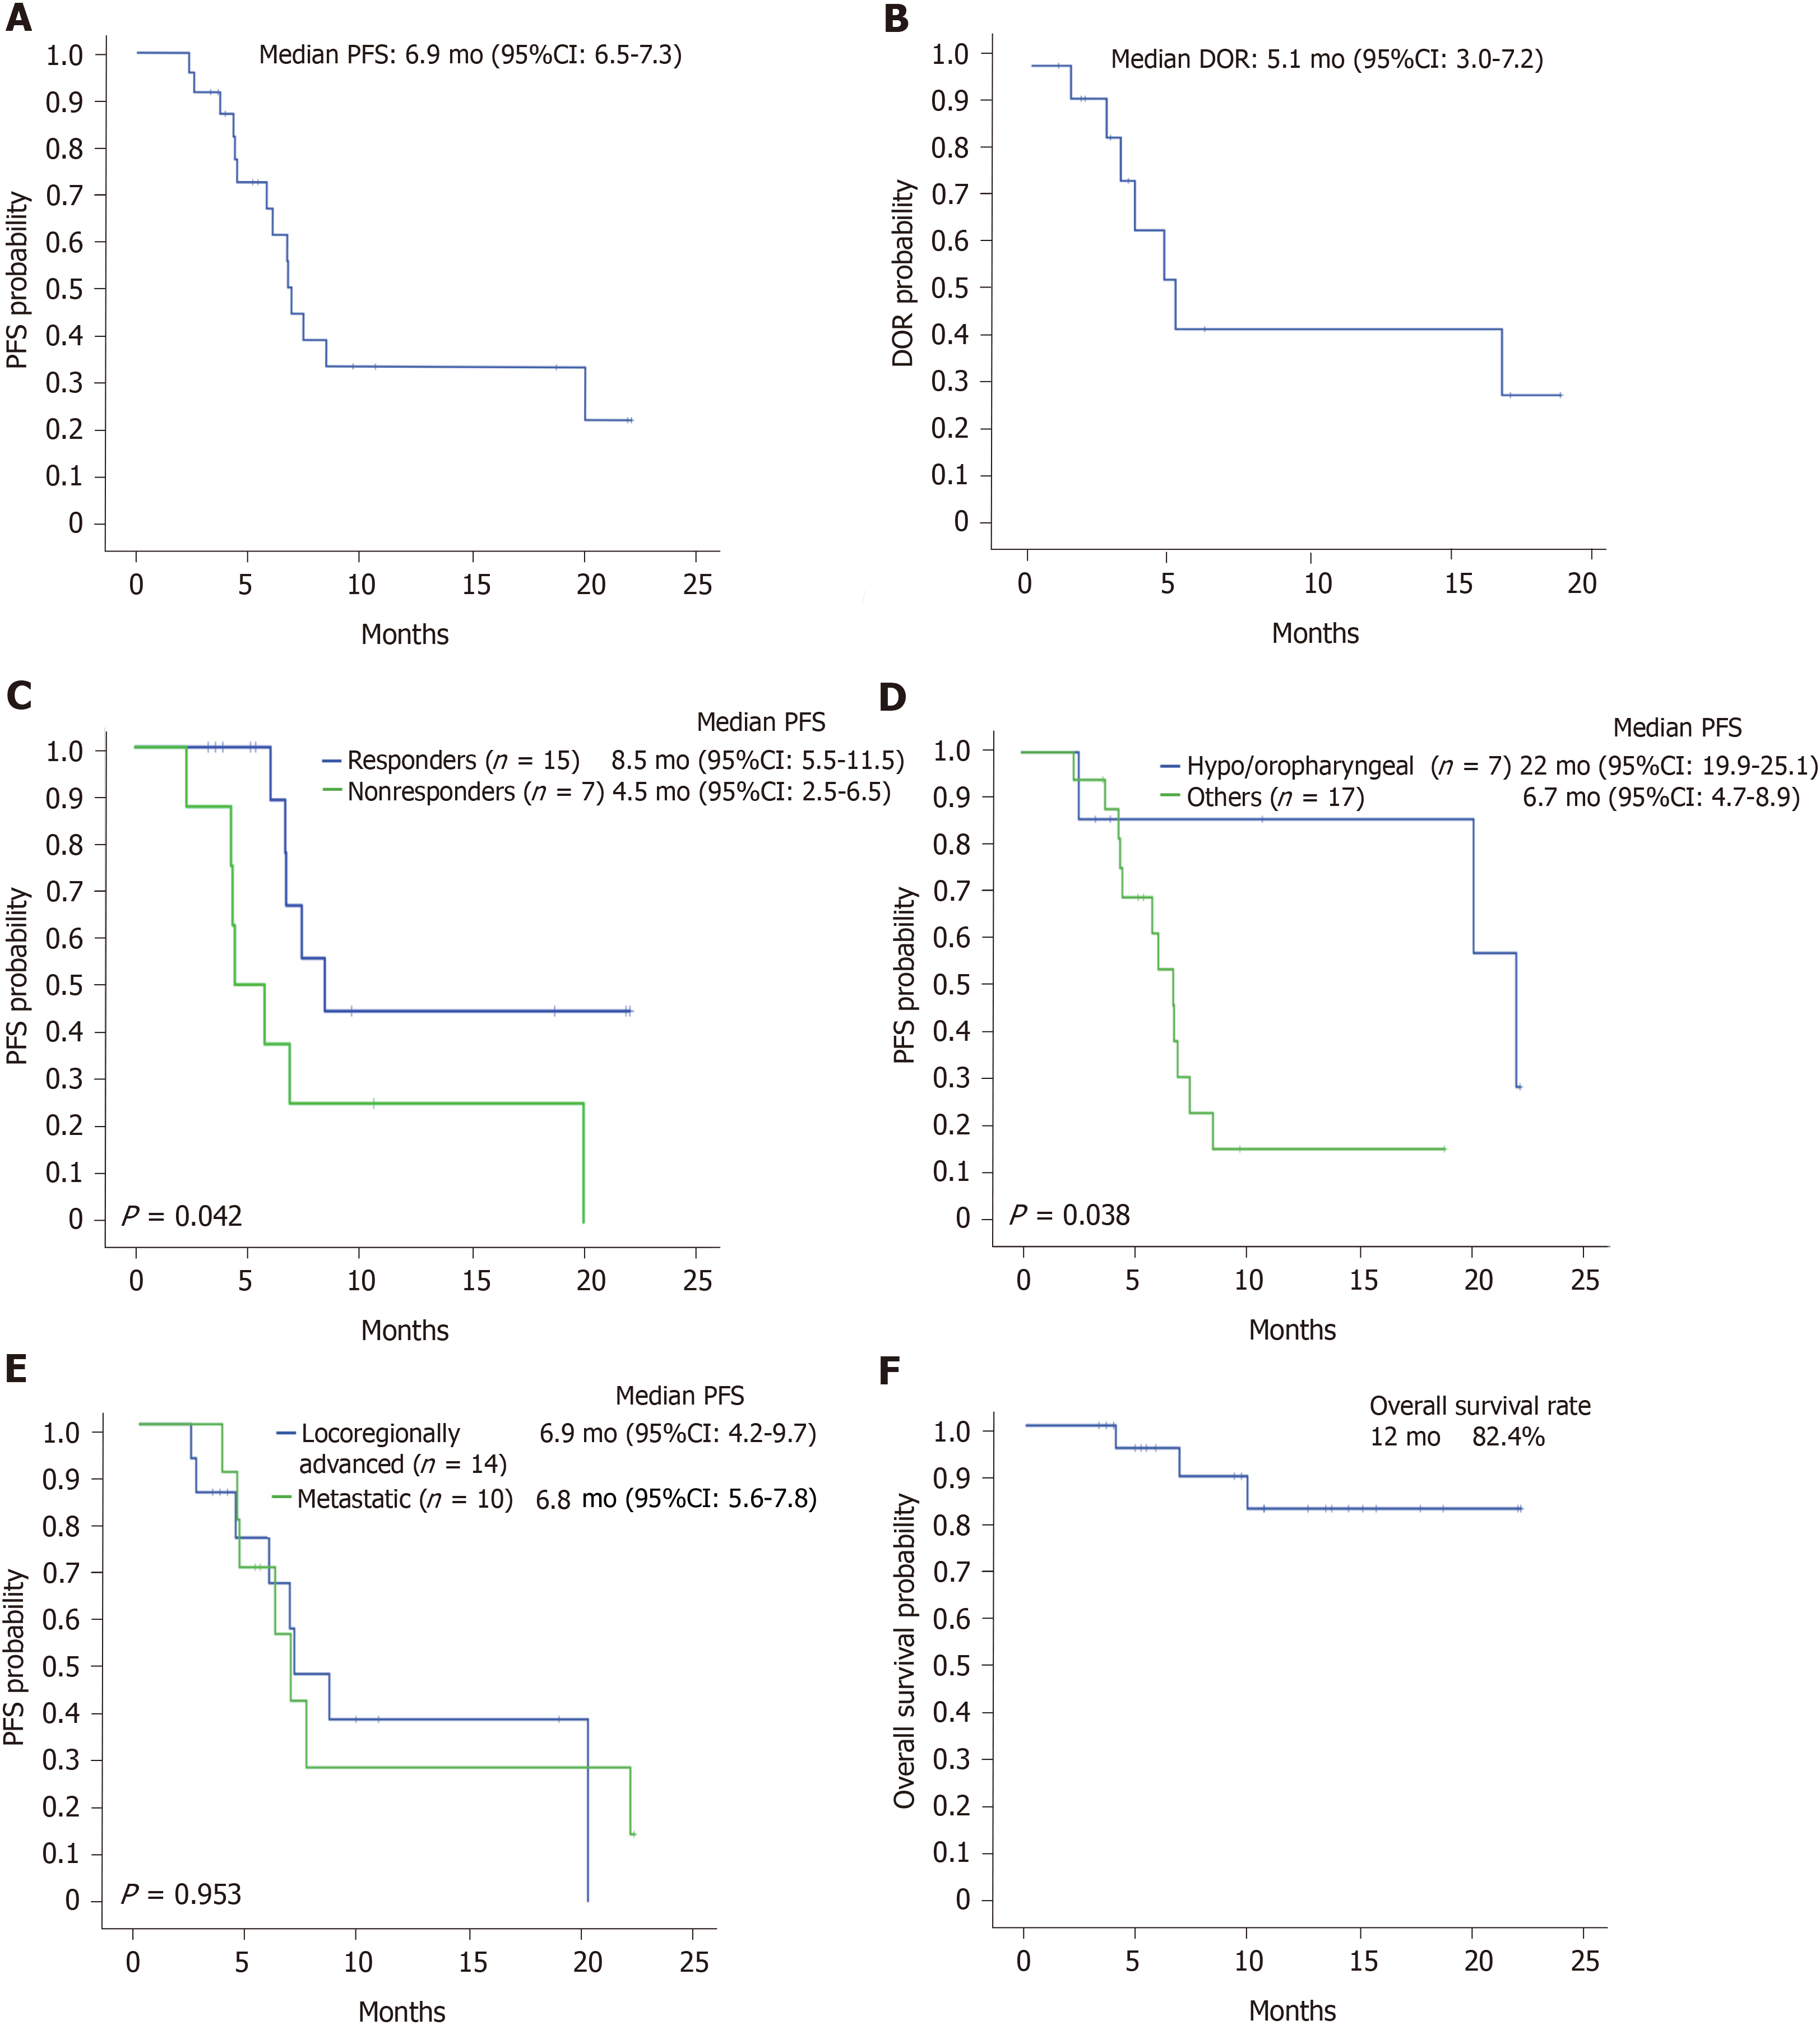
Figure 1 Kaplan–Meier curves.
A: For progression-free survival (PFS); B: For duration of response (DOR); C: For PFS according to response; D: For PFS according to primary tumor site; E: For PFS according to extent of disease at TPEx initiation; F: For overall survival. PFS: Progression-free survival.
- Citation: Falco A, Leiva M, Blanco A, Cefarelli G, Rodriguez A, Melo J, Cayol F, Rizzo MM, Sola A, Rodríguez Montani H, Chacon M, Enrico D, Waisberg F. First-line cisplatin, docetaxel, and cetuximab for patients with recurrent or metastatic head and neck cancer: A multicenter cohort study. World J Clin Oncol 2022; 13(2): 147-158
- URL: https://www.wjgnet.com/2218-4333/full/v13/i2/147.htm
- DOI: https://dx.doi.org/10.5306/wjco.v13.i2.147


