Copyright
©The Author(s) 2022.
World J Clin Oncol. Dec 24, 2022; 13(12): 967-979
Published online Dec 24, 2022. doi: 10.5306/wjco.v13.i12.967
Published online Dec 24, 2022. doi: 10.5306/wjco.v13.i12.967
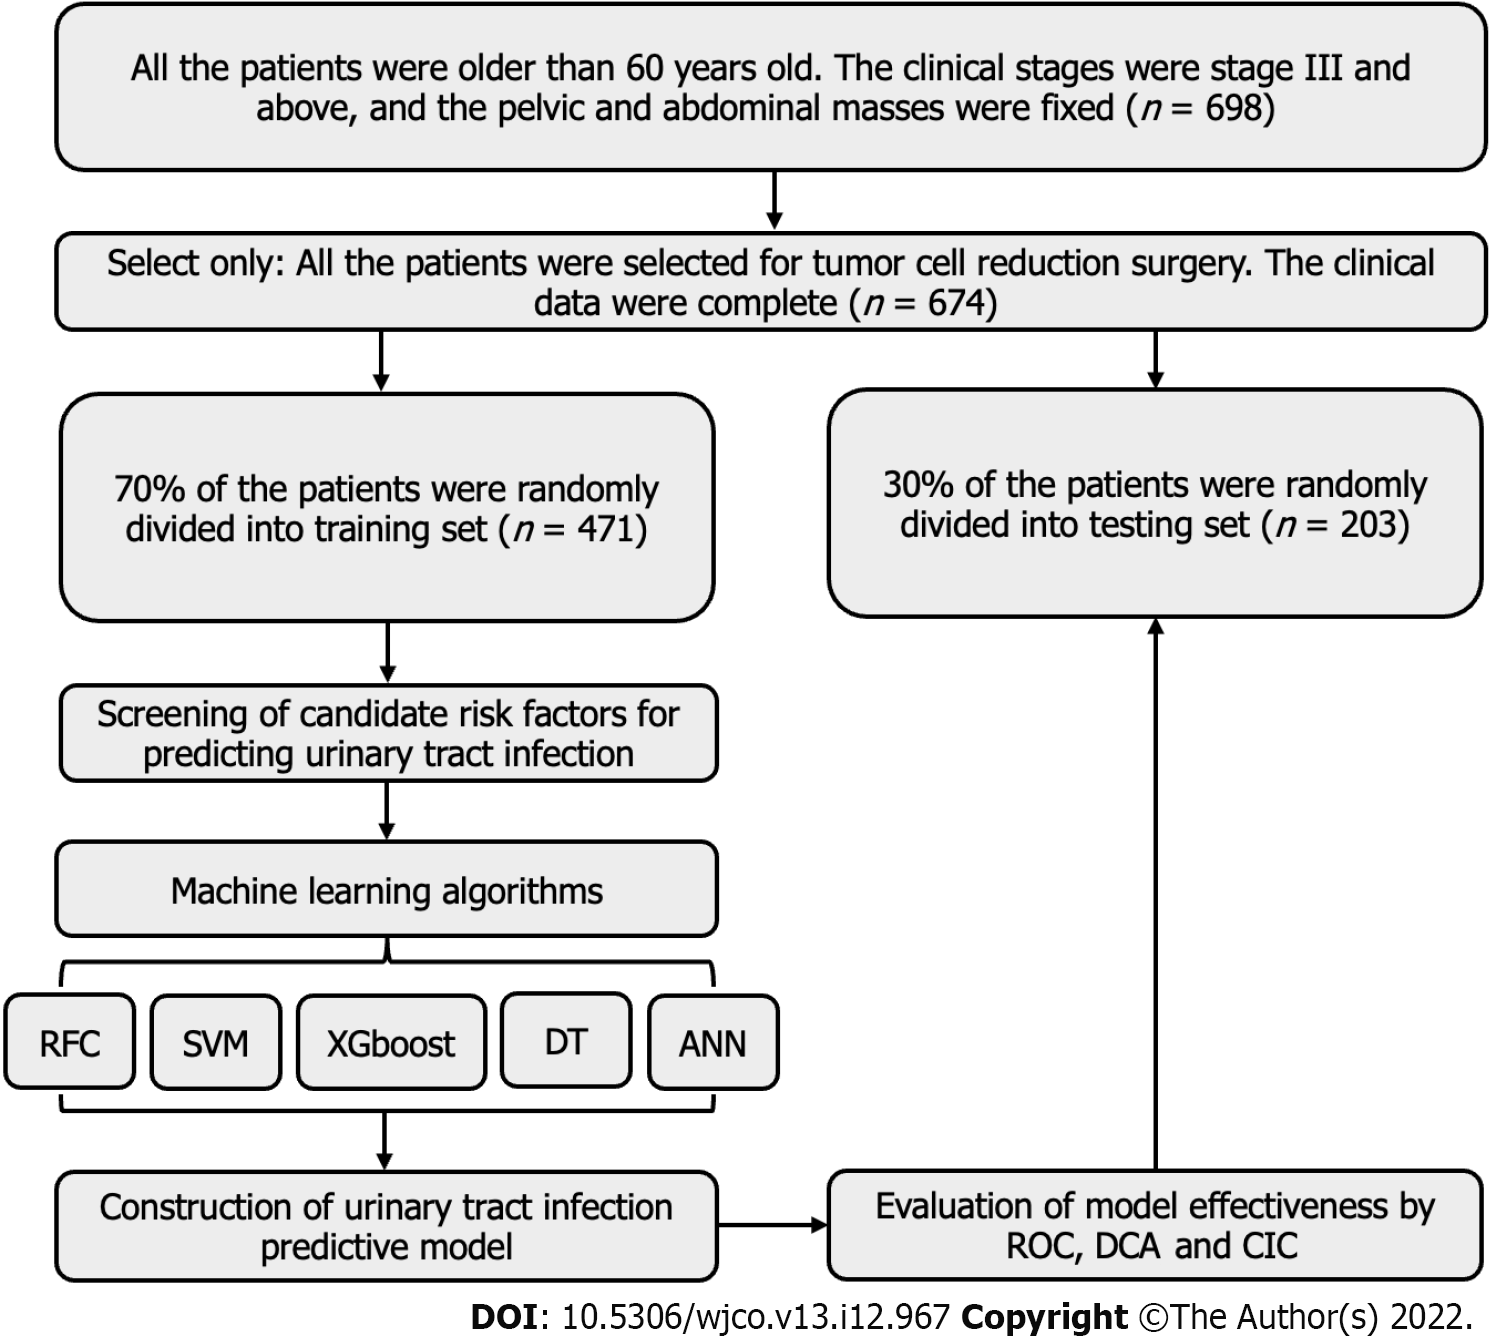
Figure 1 Flow chart of the patient selection and data process.
ANN: Artificial neural network; CIC: Clinical impact curve; DCA: Decision curve analysis; DT: Decision tree; RFC: Random forest classifier; ROC: Receiver operating characteristic curve; SVM: Support vector machine; XGboost: Extreme gradient boosting.
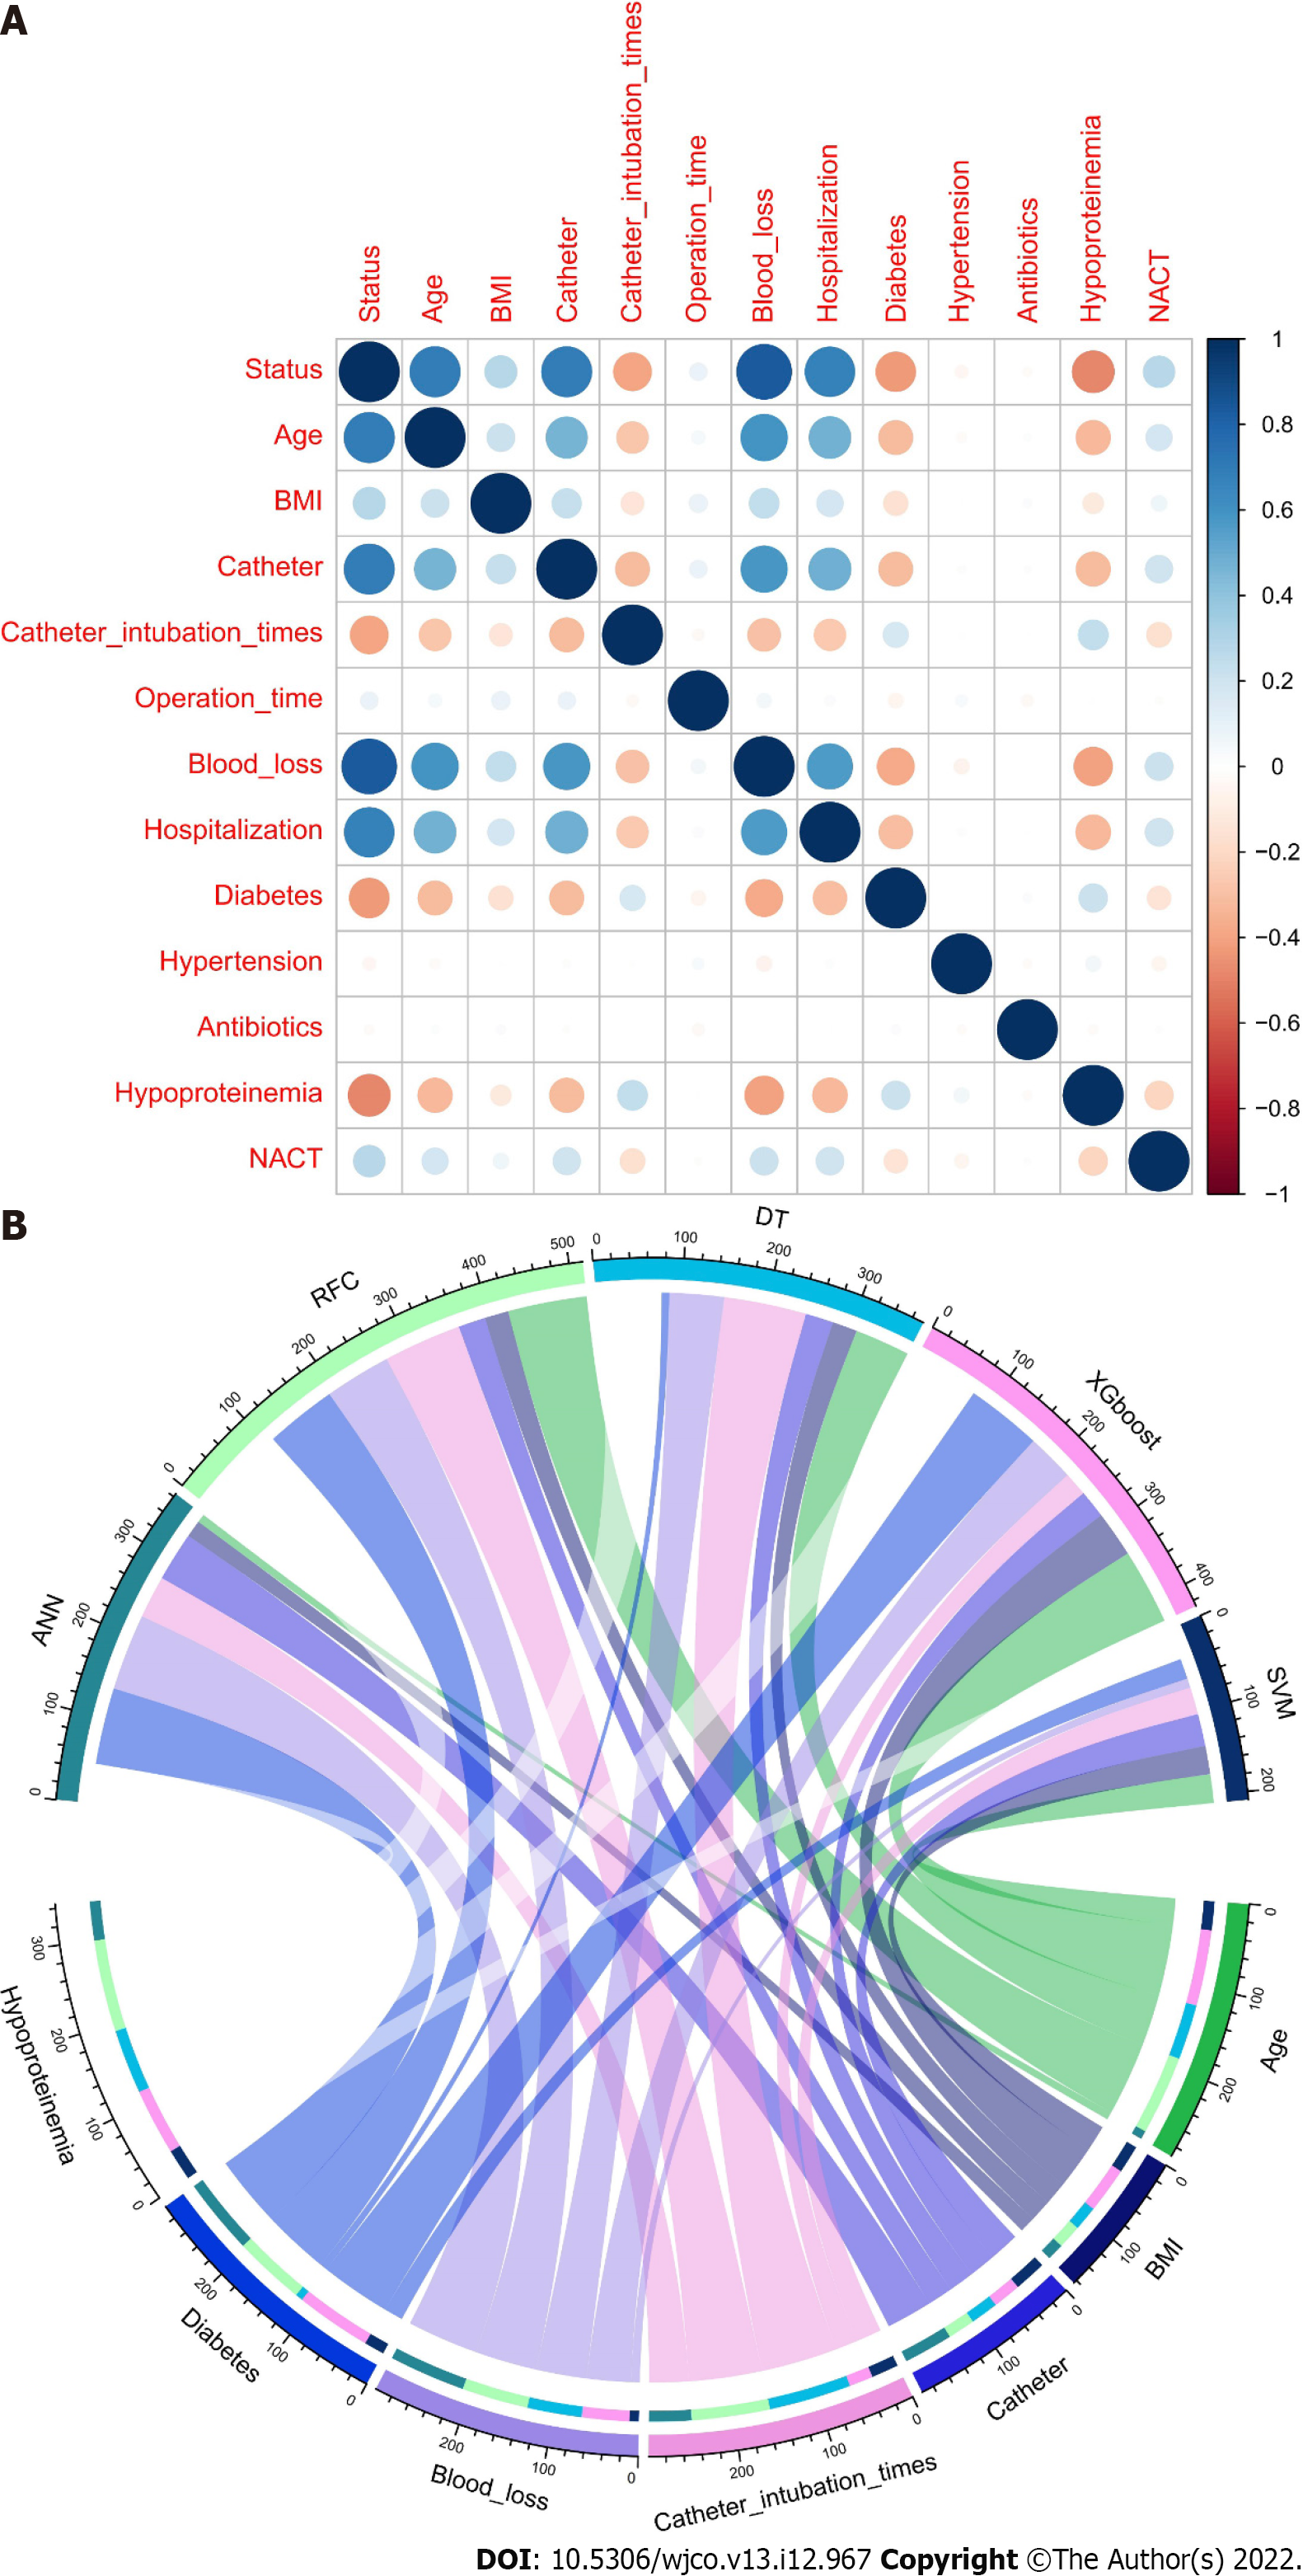
Figure 2 Variable screening and weight allocation.
A: Variable screening; B: weight allocation. ANN: Artificial neural network; BMI: Body mass index; DT: Decision tree; NACT: Neoadjuvant chemotherapy; RFC: Random forest classifier; SVM: Support vector machine; XGboost: Extreme gradient boosting.
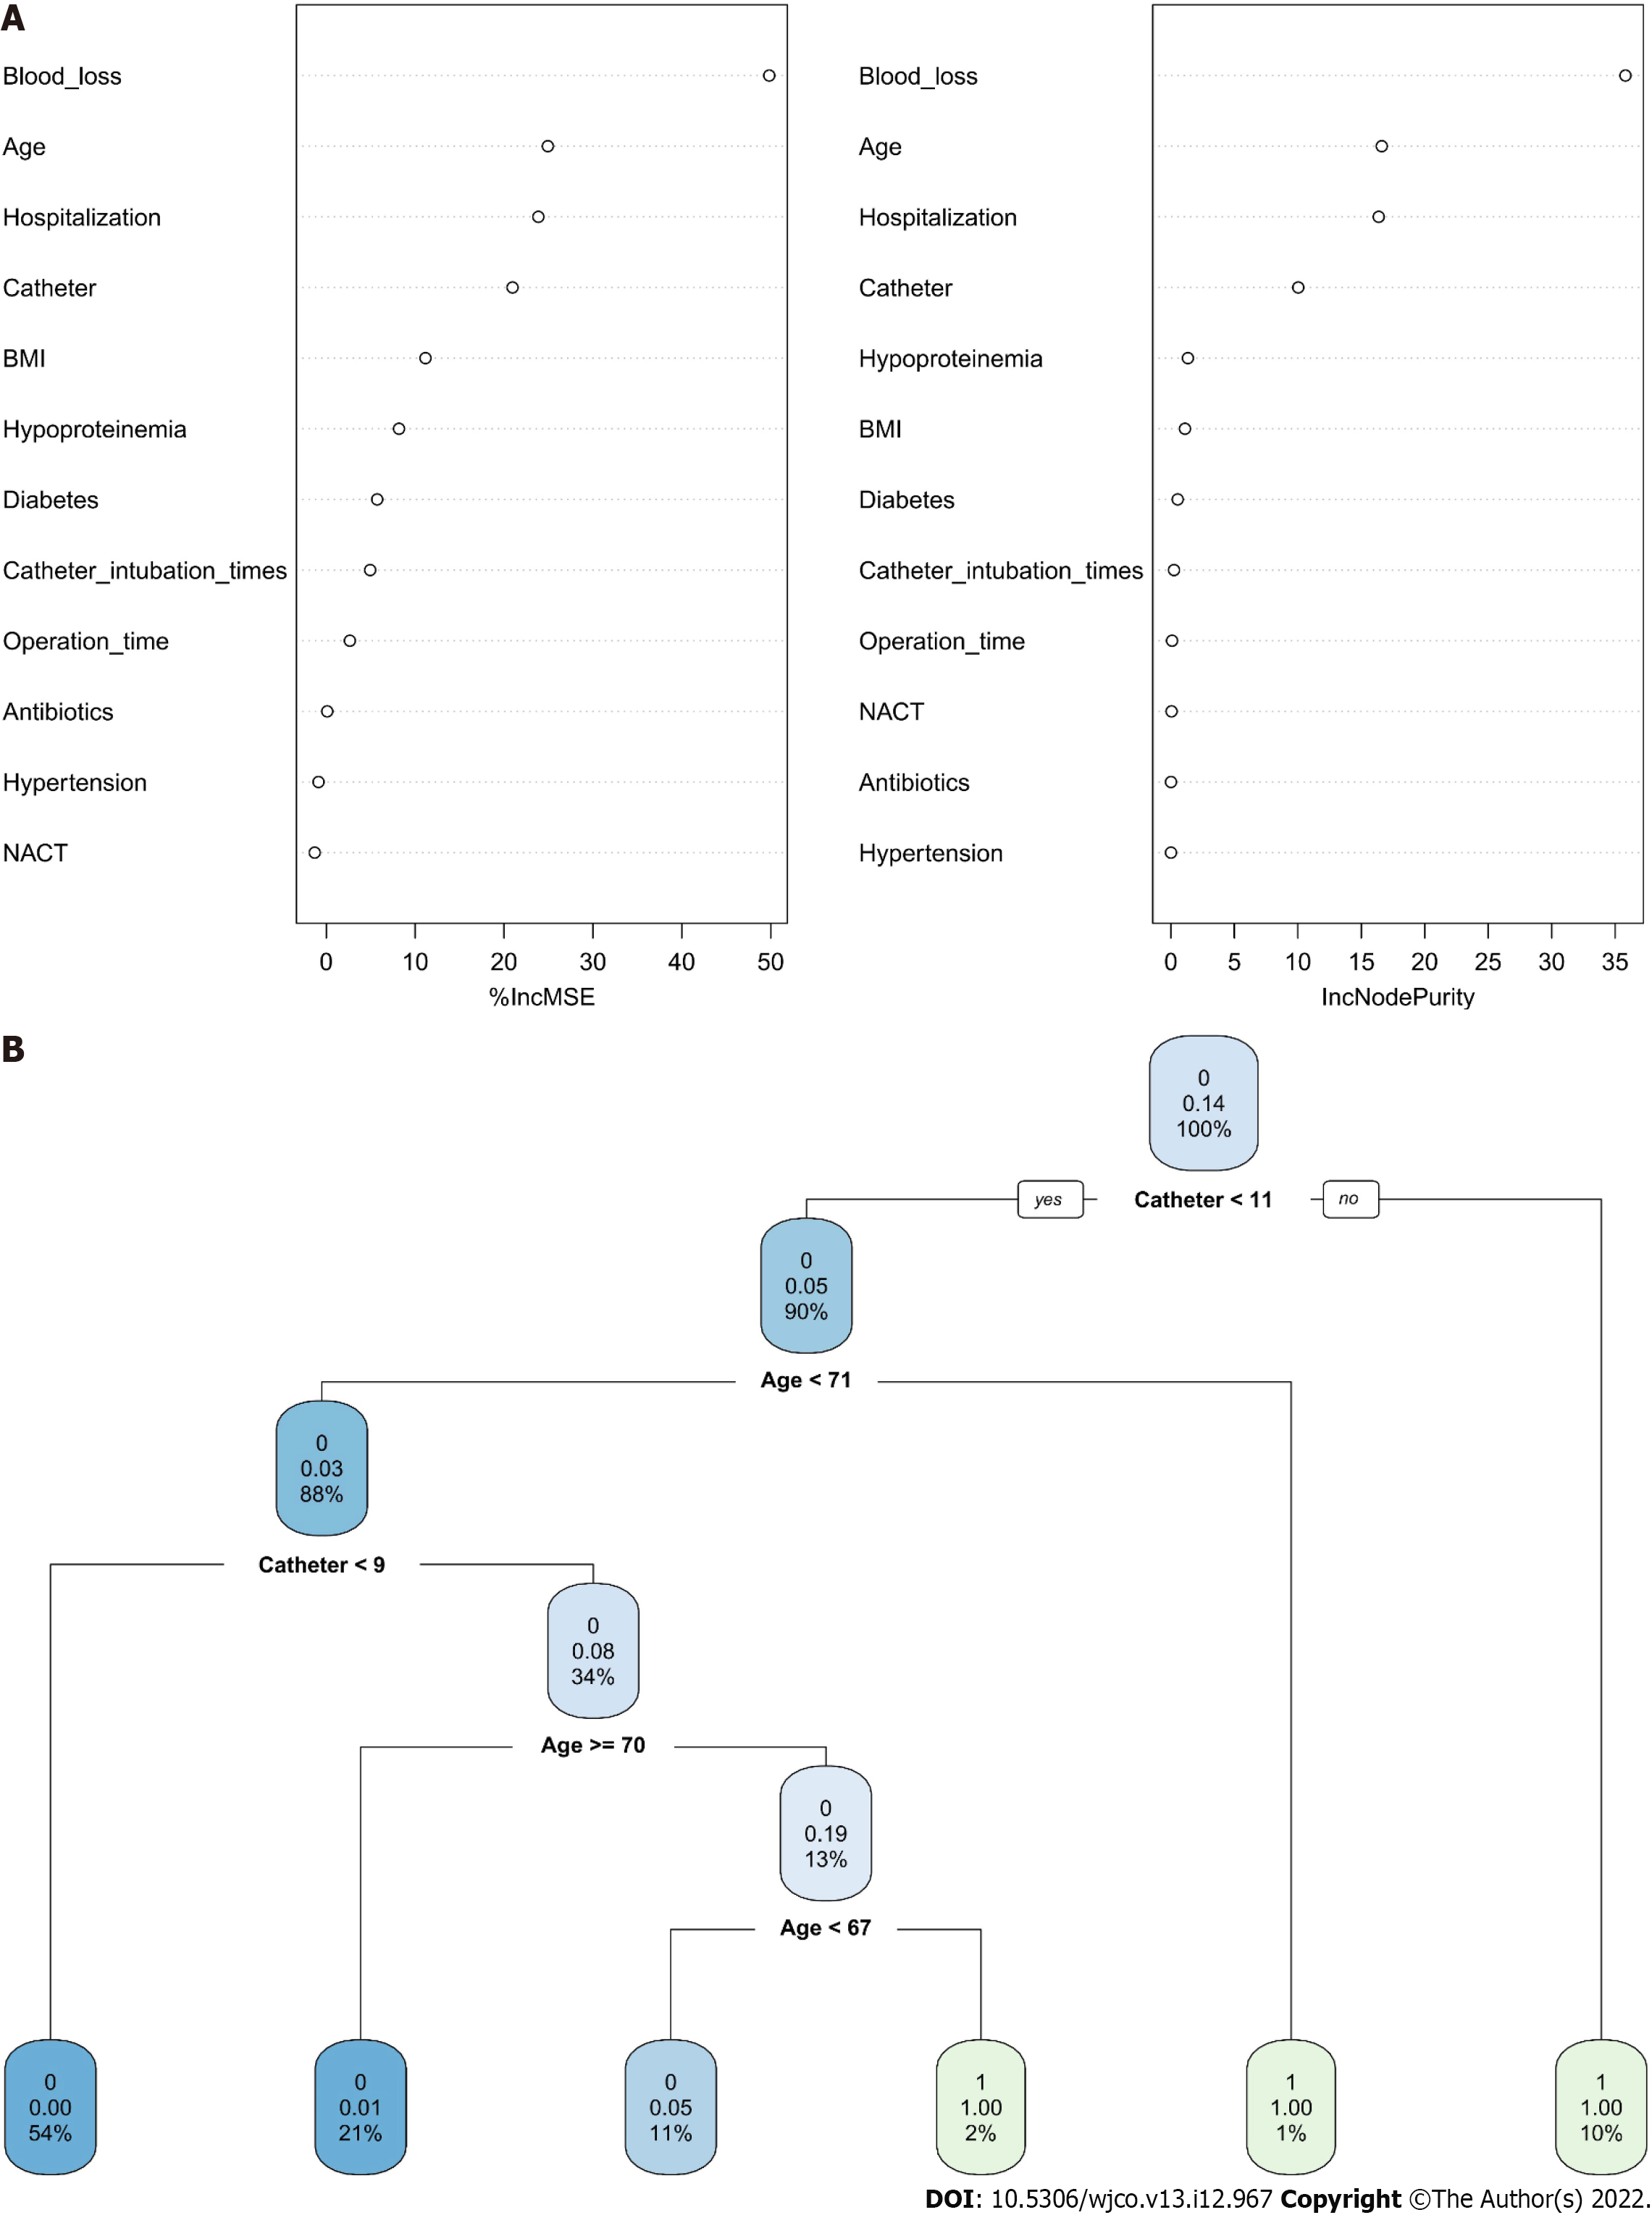
Figure 3 Predictive model visualization based on machine learning-based algorithm.
A: The random forest classifier algorithm represents a computational method for effectively navigating the free parameter space to obtain a robust model; B: At the branch of decision tree, age and catheter functioned as the irreplaceable weight in addition to clinical factor indicators. BMI: Body mass index; NACT: Neoadjuvant chemotherapy.
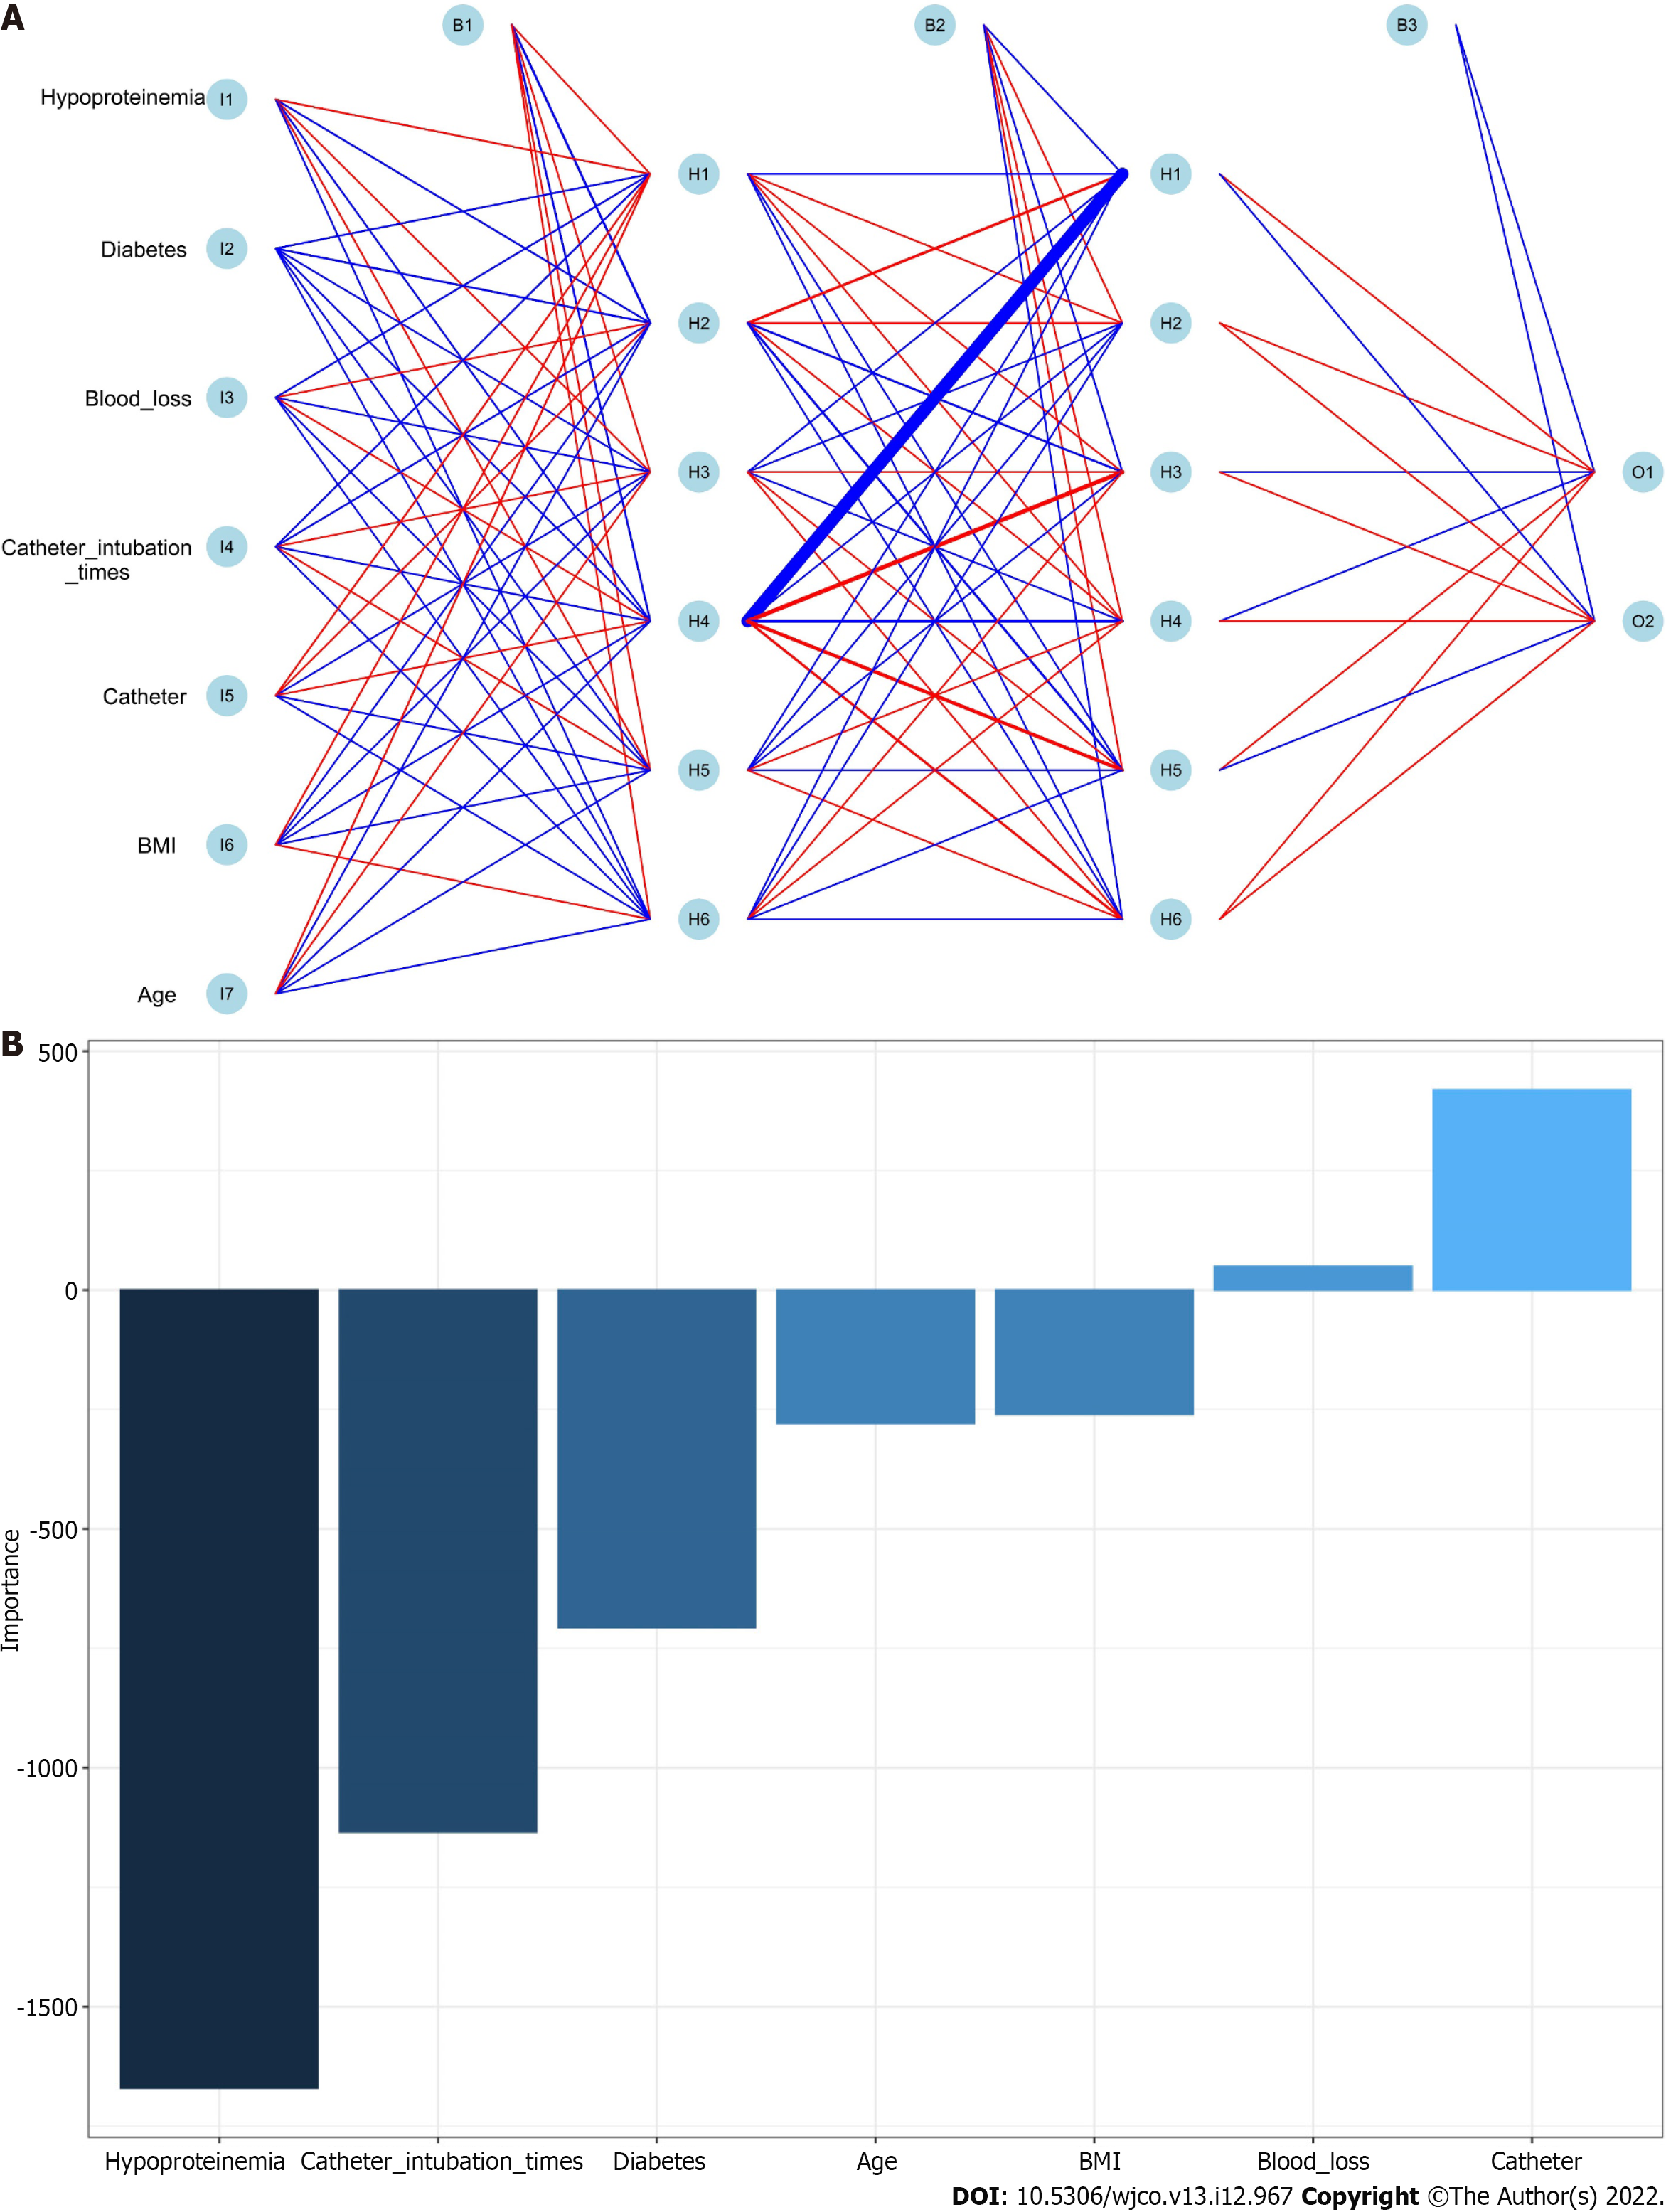
Figure 4 Predictive model visualization based on artificial neural network algorithm.
BMI: Body mass index.
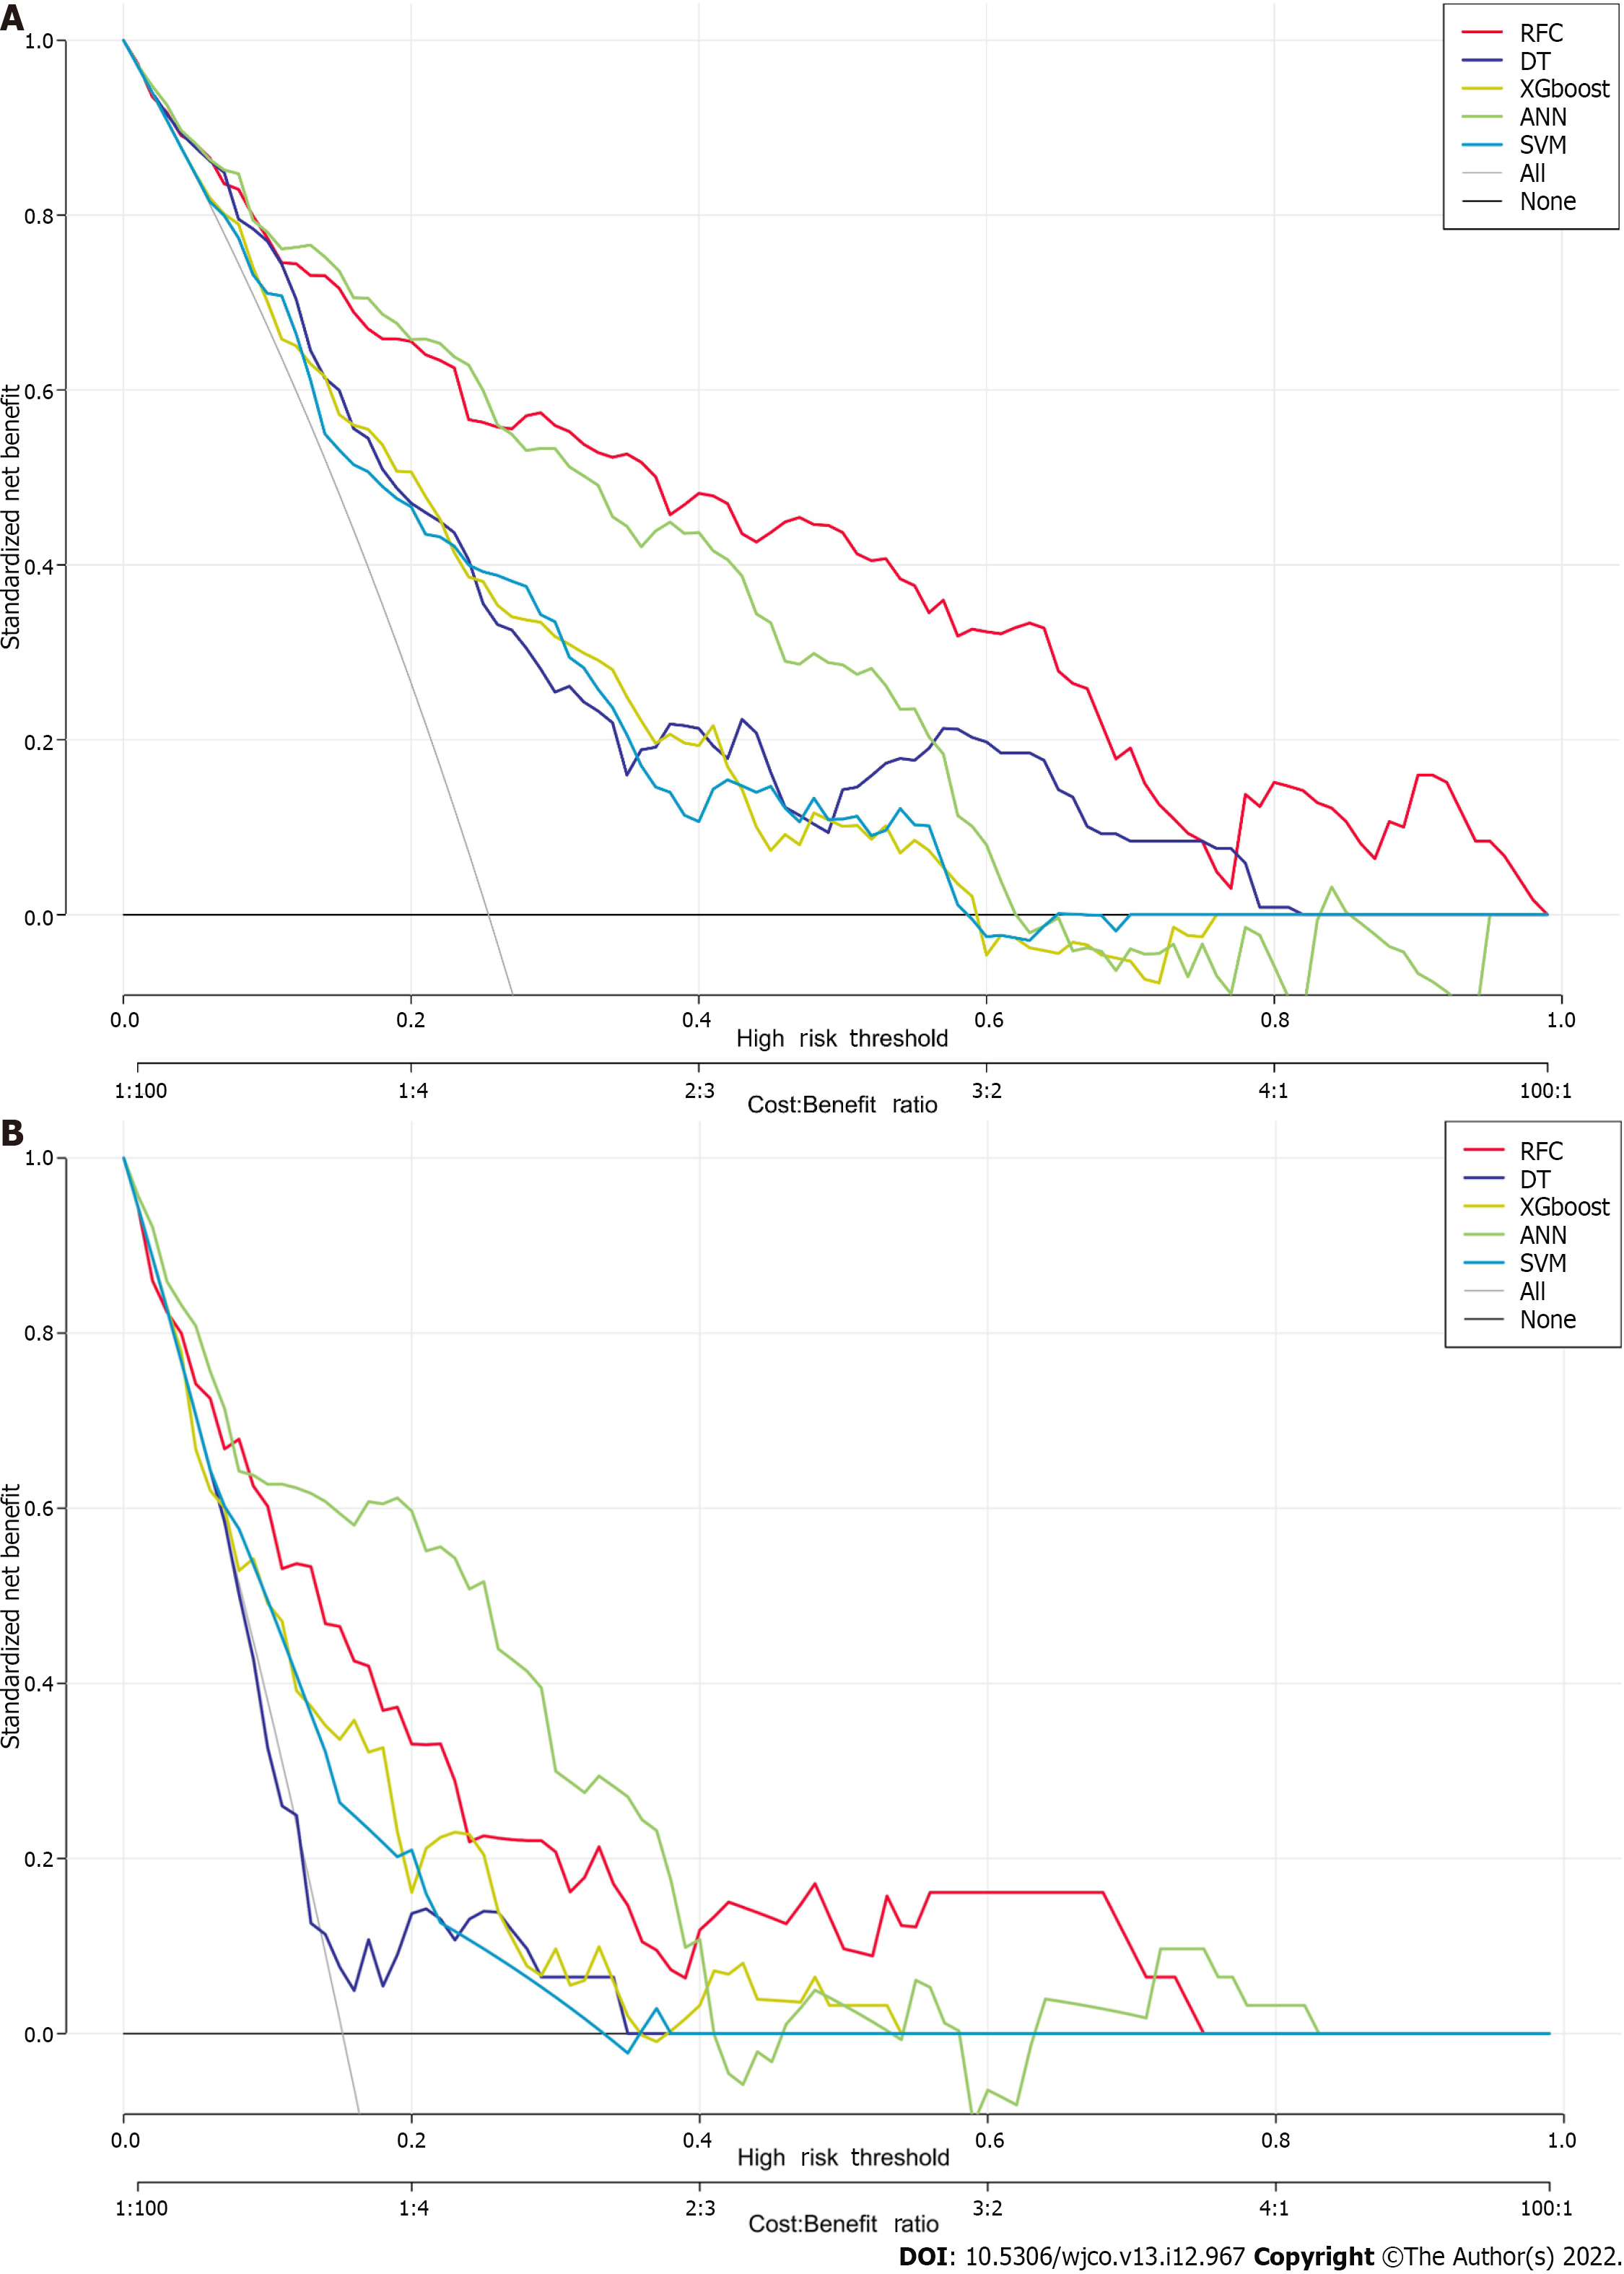
Figure 5 Prediction performance of candidate models based on machine learning-based algorithm.
ANN: Artificial neural network; DT: Decision tree; RFC: Random forest classifier; SVM: Support vector machine; XGboost: Extreme gradient boosting.
- Citation: Ai J, Hu Y, Zhou FF, Liao YX, Yang T. Machine learning-assisted ensemble analysis for the prediction of urinary tract infection in elderly patients with ovarian cancer after cytoreductive surgery. World J Clin Oncol 2022; 13(12): 967-979
- URL: https://www.wjgnet.com/2218-4333/full/v13/i12/967.htm
- DOI: https://dx.doi.org/10.5306/wjco.v13.i12.967


