Copyright
©The Author(s) 2022.
World J Clin Oncol. Nov 24, 2022; 13(11): 880-895
Published online Nov 24, 2022. doi: 10.5306/wjco.v13.i11.880
Published online Nov 24, 2022. doi: 10.5306/wjco.v13.i11.880
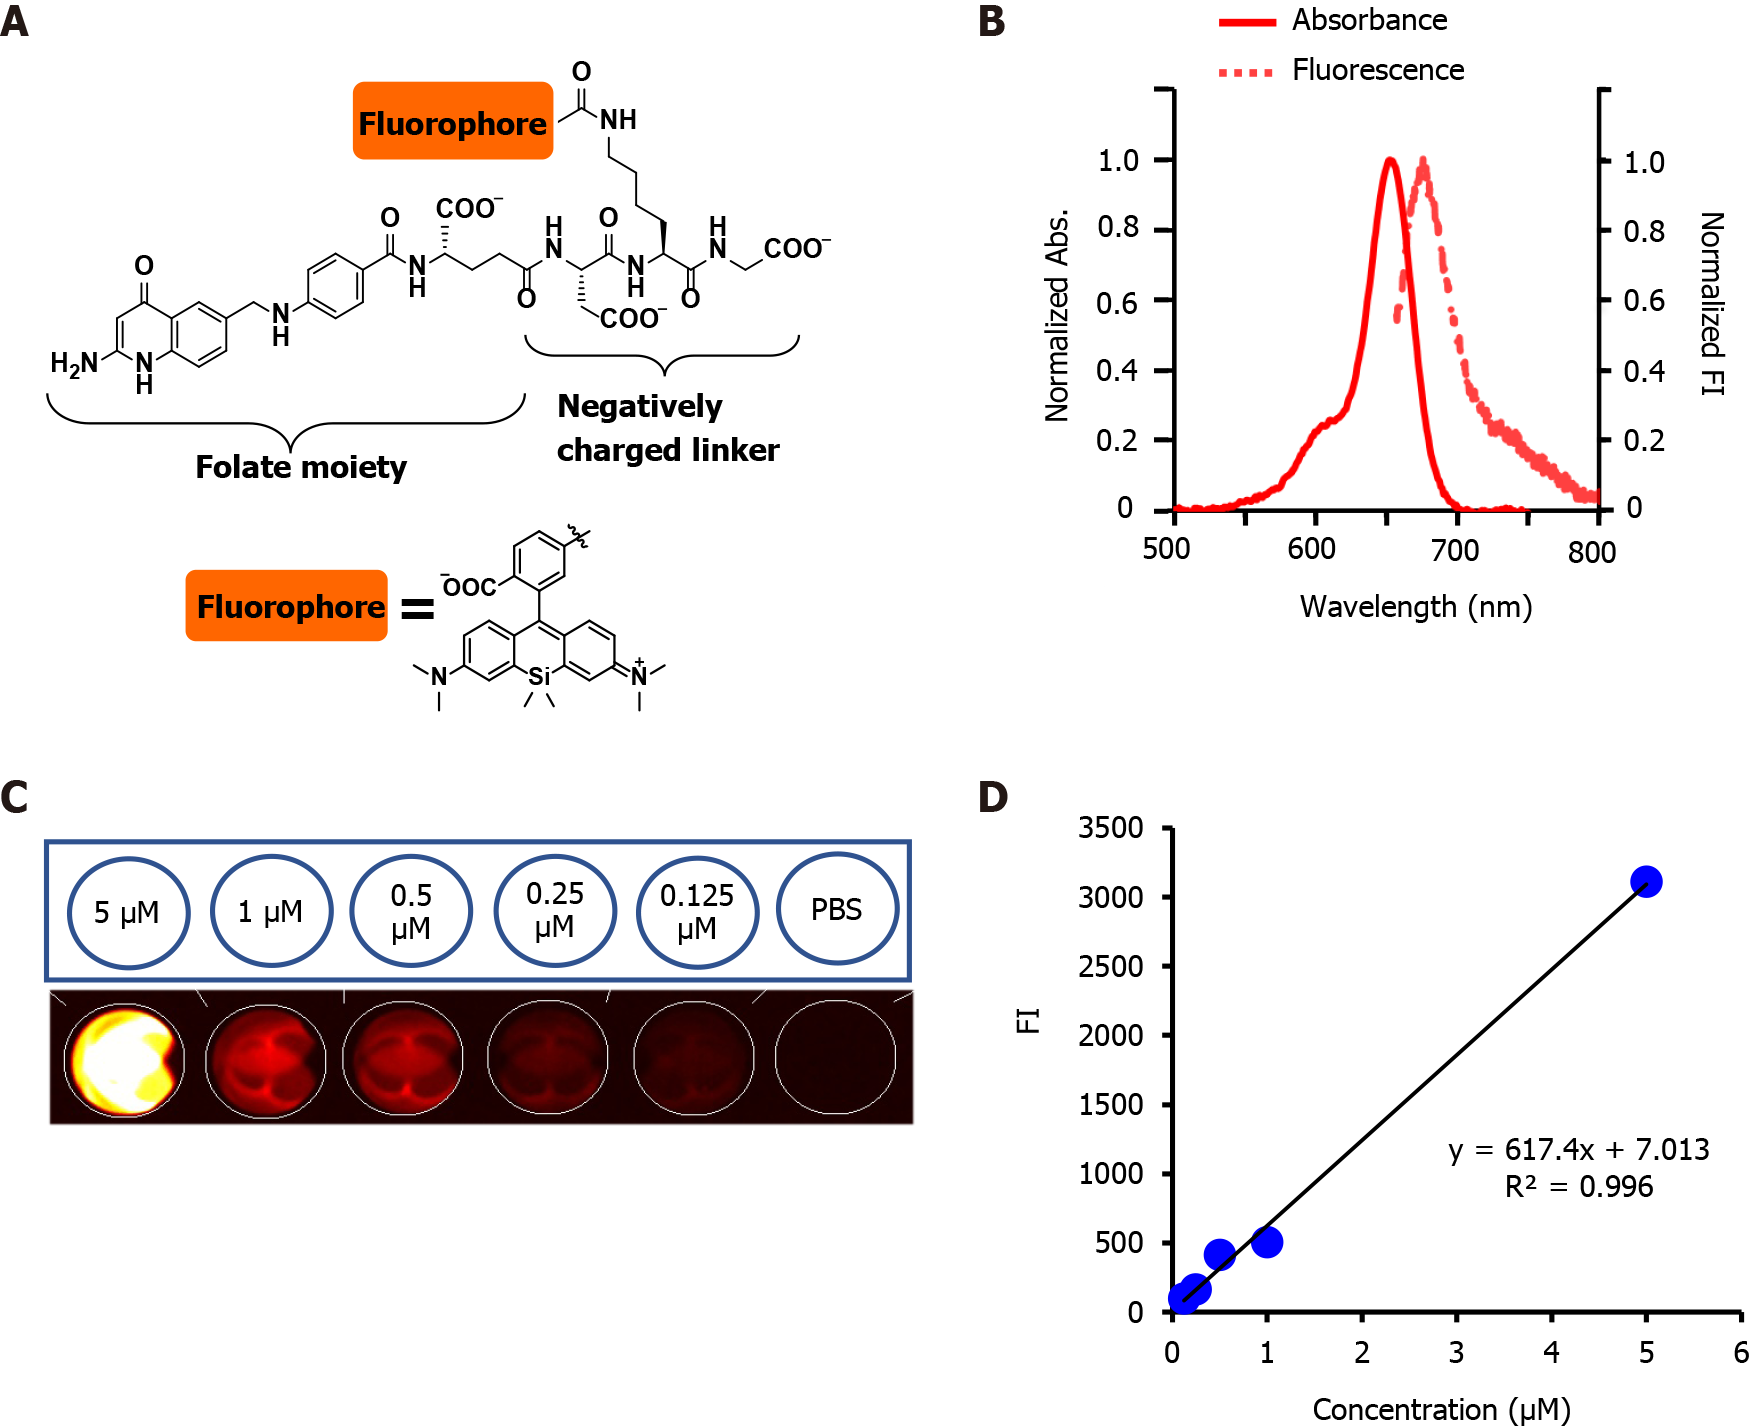
Figure 1 Folate-Si-rhodamine-1 characteristcs.
A: Molecular design and chemical structure of folate-Si-rhodamine-1 (FolateSiR-1); B: Absorption and emission spectra of 1 μmol/L FolateSiR-1 in 100 mmol/L sodium phosphate buffer (pH 7.4) containing 0.1% DMSO: maximum absorption = 652 nm; maximum emission = 674 nm; C: Fluorescence images of FolateSiR-1 at a concentration of 5, 1, 0.5, 0.25, and 0.125 μmol/L in a 96-well plate captured using the VISQUE fluorescence imaging system; D: FolateSiR-1 concentration vs fluorescence signal intensity. Abs: Absorbance; FI: Fluorescence signal intensity; μM: μmol/L.
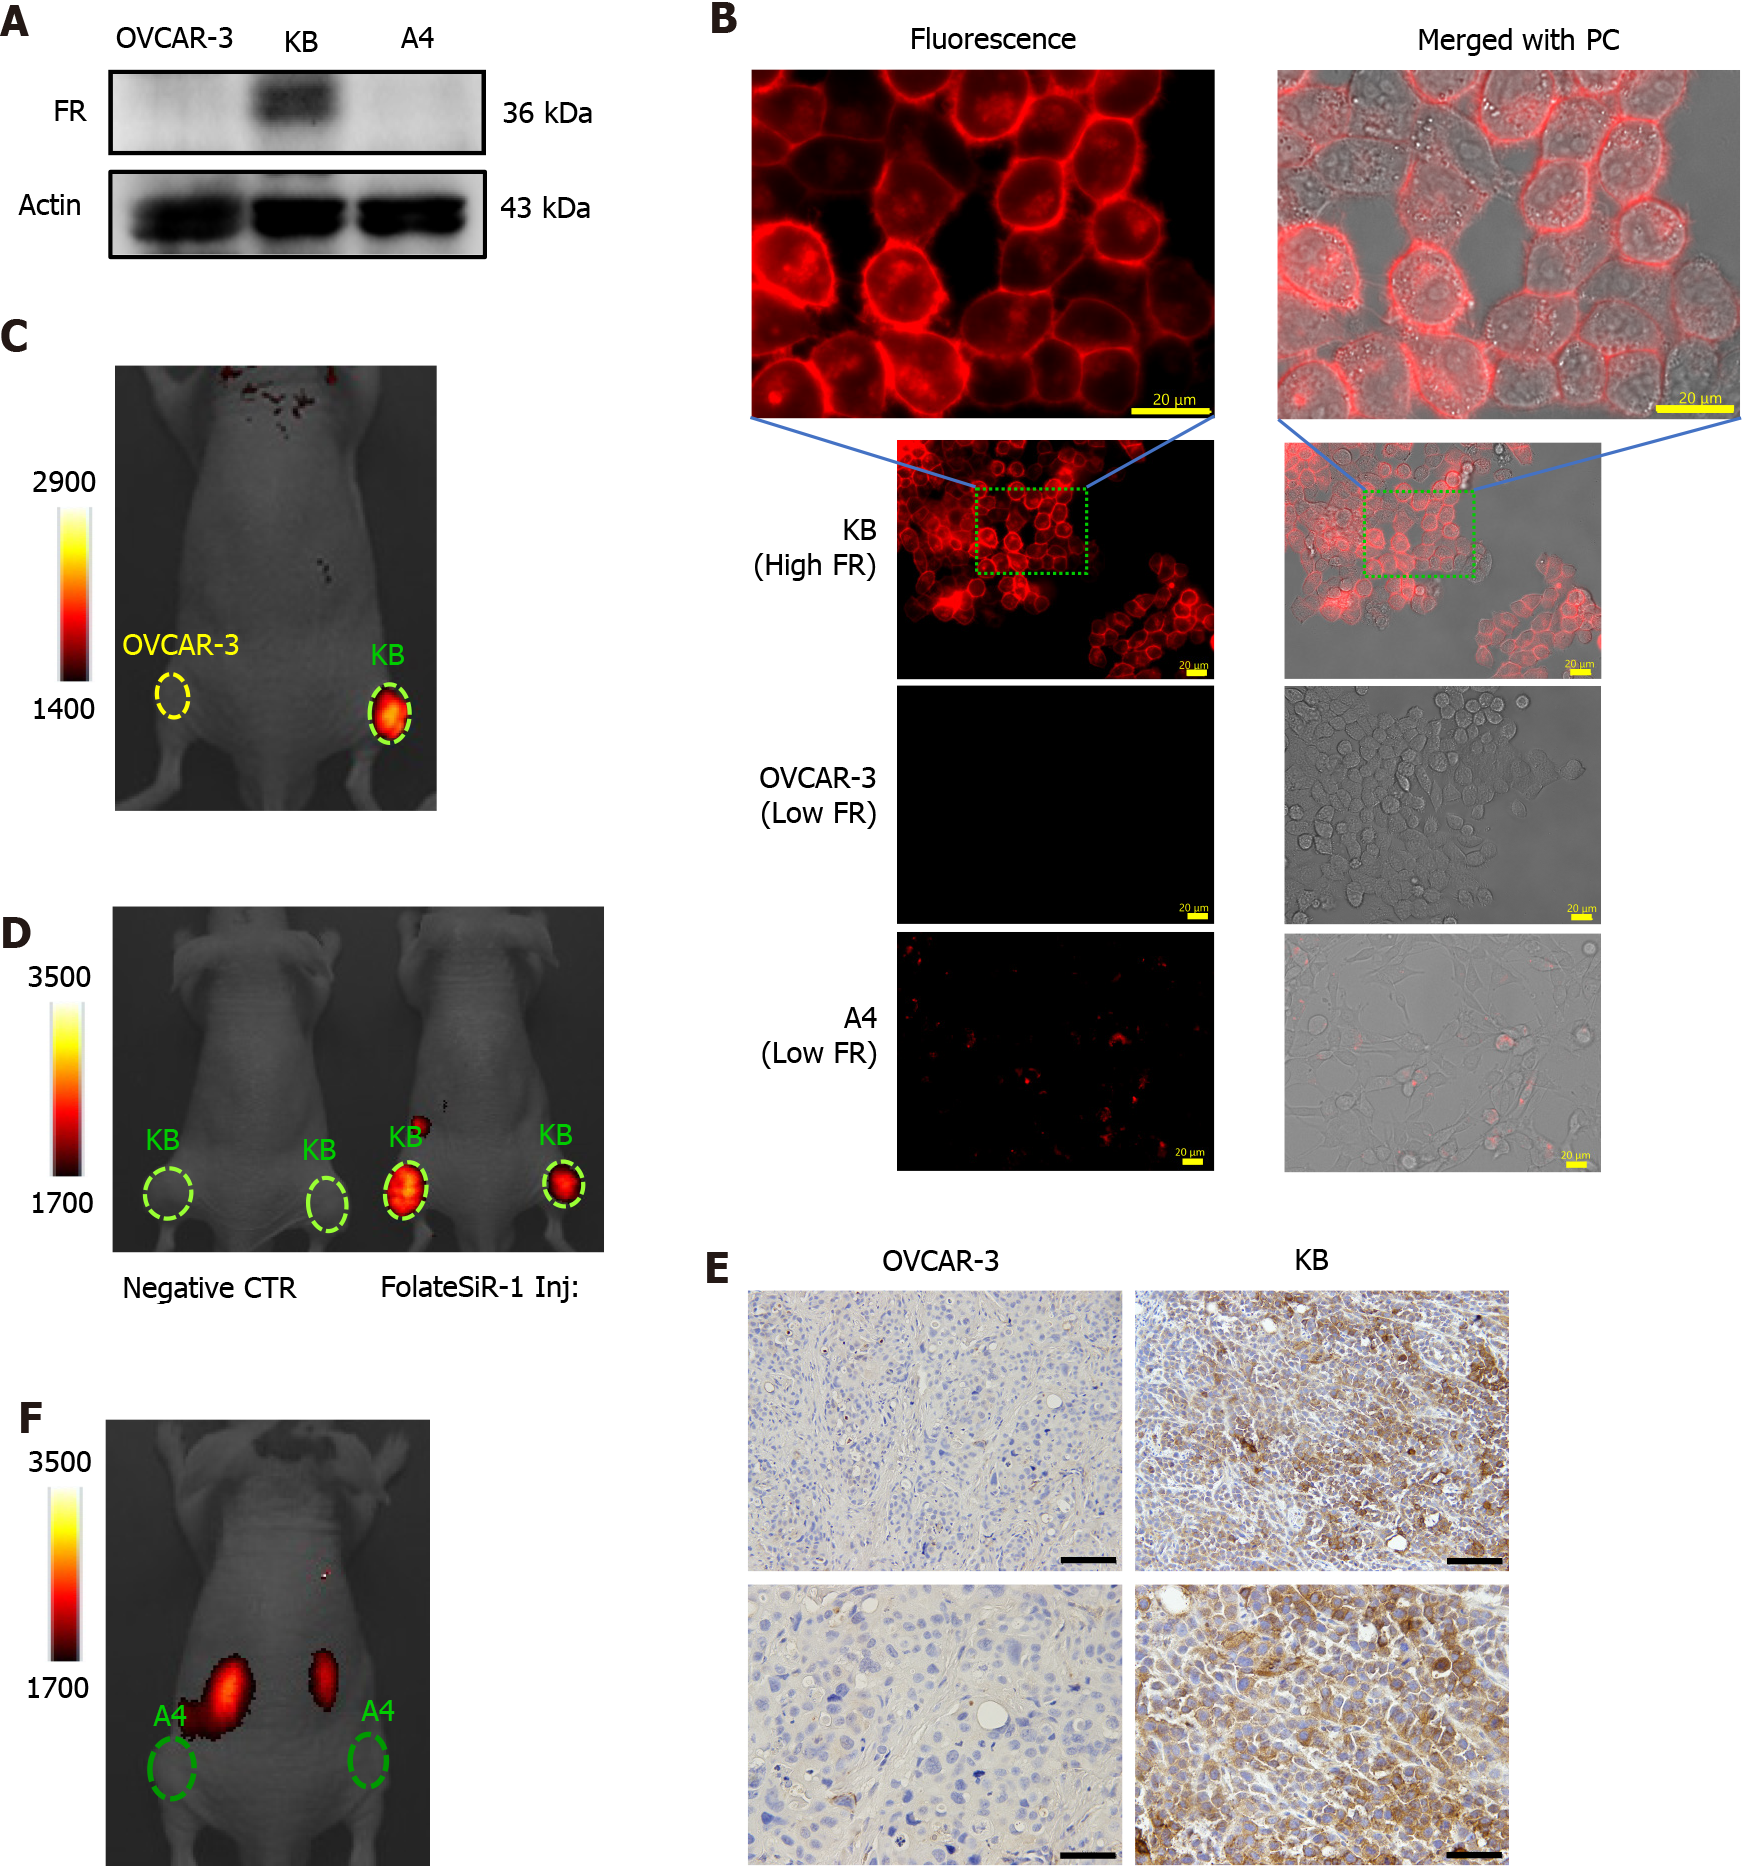
Figure 2 Folate receptor expression in designated cell lines and folate receptor-specific binding of folate-Si-rhodamine-1 in tumor in vivo.
A: Folate receptor (FR) expression in cell lines OVCAR-3, KB, and A4 examined by western blotting; B: Cell lines were incubated with or without folate-Si-rhodamine-1 (FolateSiR-1) for 24 h and examined under a fluorescent microscope. FolateSiR-1 fluorescence was detected using the appropriate filters (Ex/Em 590-650/665-732 nm). The uppermost images are magnifications of the indicated portion of the lower image showing KB cells (scale bar = 20 μm, 40 × magnification, and 120 × magnification for the upper most image); C: Near-infrared (NIR) fluorescence image of a representative mouse bearing subcutaneous KB (right) and OVCAR-3 (left) tumors at 2 h after receiving the FolateSiR-1 injection: KB tumor (FR+) showed high fluorescence signal intensity (FI), and OVCAR-3 tumor (low FR) did not; D: NIR fluorescence image of mice bearing KB tumors: the right mouse received the FolateSiR-1 injection showed FI, while the left mouse did not (negative control tumor) show no FI; E: NIR fluorescence image of a mouse bearing A4 (low FR) tumor showed no FI; F: Immunohistochemical analysis of tumor tissue sections for FR expression: KB tumor (right column), OVCAR-3 tumor (left column). Scale bar = 100 μm, 20 × magnification for upper panel, and scale bar = 50 μm, 40 × magnification, for lower panel. FR: Folate receptor; Ex: Excitation; Em: Emission; FI: Fluorescence signal intensity; FolateSiR-1: Folate-Si-rhodamine-1; PC: Phase-contrast; NIR: Near-infrared; CTR: Control.
Figure 3 In vitro phototoxicity of folate-Si-rhodamine-1 after laser irradiation.
The cells were stained using the reagents from the Cell viability imaging kit at 2 h after near-infrared photodynamic therapy (NIR-PDT). The nuclei of dead cells were stained with NucGreen® Dead reagent (green), while the viable cell nuclei were stained with NucBlue® Live reagent (blue). Rapid cell death-induced by PDT (10 J/cm2) and abundant dead cells were clearly noted. (scale bar = 500 μm, 10 × magnification). NIR-PDT: Near-infrared photodynamic therapy; IR: Laser irradiation; CTR: Control; NucGreen: NucGreen® Dead reagent; NucBlue: NucBlue® Live reagent; PC: Phase-contrast; μM: μmol/L.
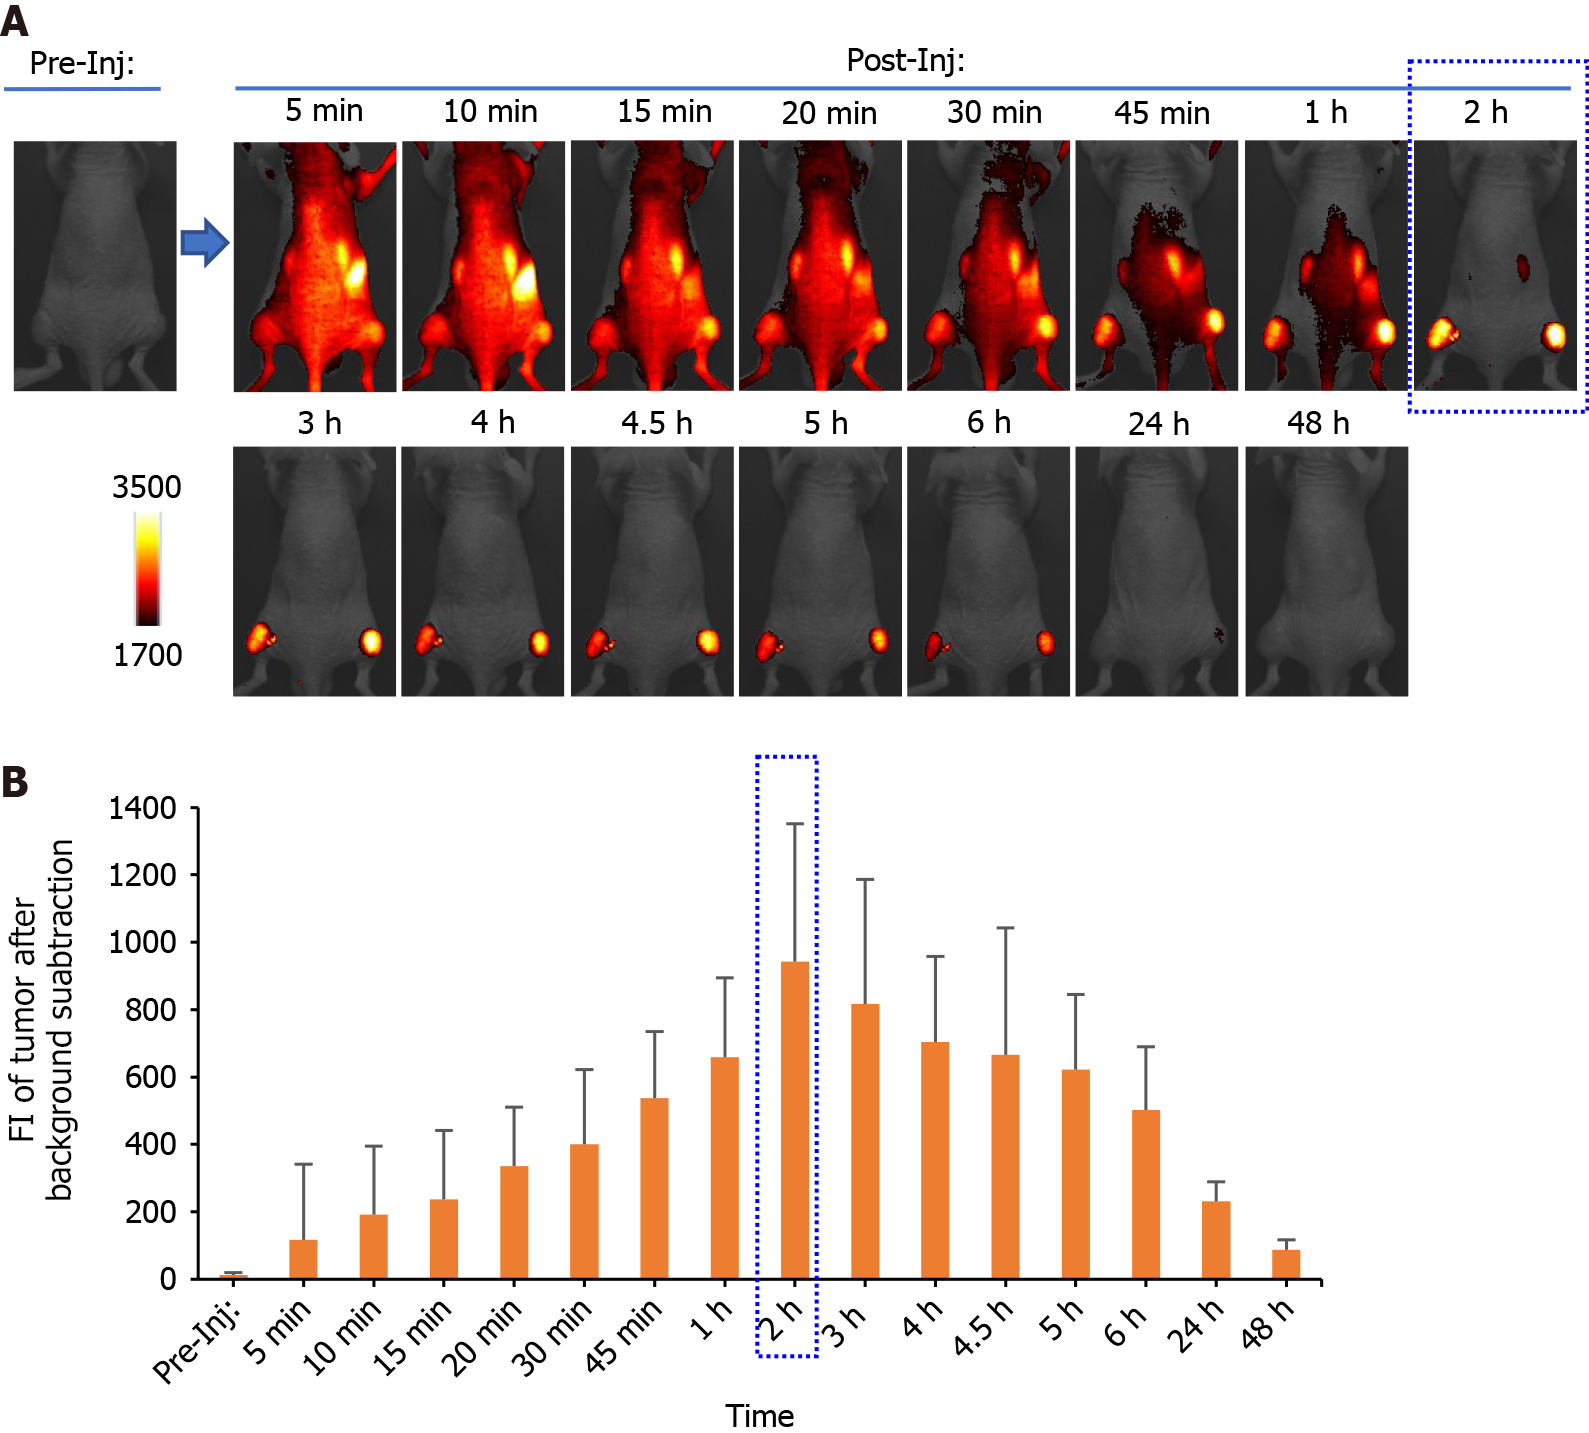
Figure 4 In vivo longitudinal near-infrared fluorescence imaging of folate-Si-rhodamine-1 in a KB tumor-bearing representative mouse.
A: Imaging was conducted before and after folate-Si-rhodamine-1 (FolateSiR-1) injection. The indicated time points after injection are at 5 min, 10 min, 15 min, 20 min, 30 min, 45 min, 1 h, 2 h, 3 h, 4 h, 4.5 h, 5 h, 6 h, 24 h, and 48 h. Time-dependent FolateSiR-1 distribution and its specific tumor accumulation is shown in serial images; B: Quantitative fluorescent signal intensity analysis of the tumors. Data are presented as the mean ± SD (n = 4). NIR: Near-infrared; FI: Fluorescent signal intensity; Pre-Inj: Pre-injection; Post-Inj: Post-injection.
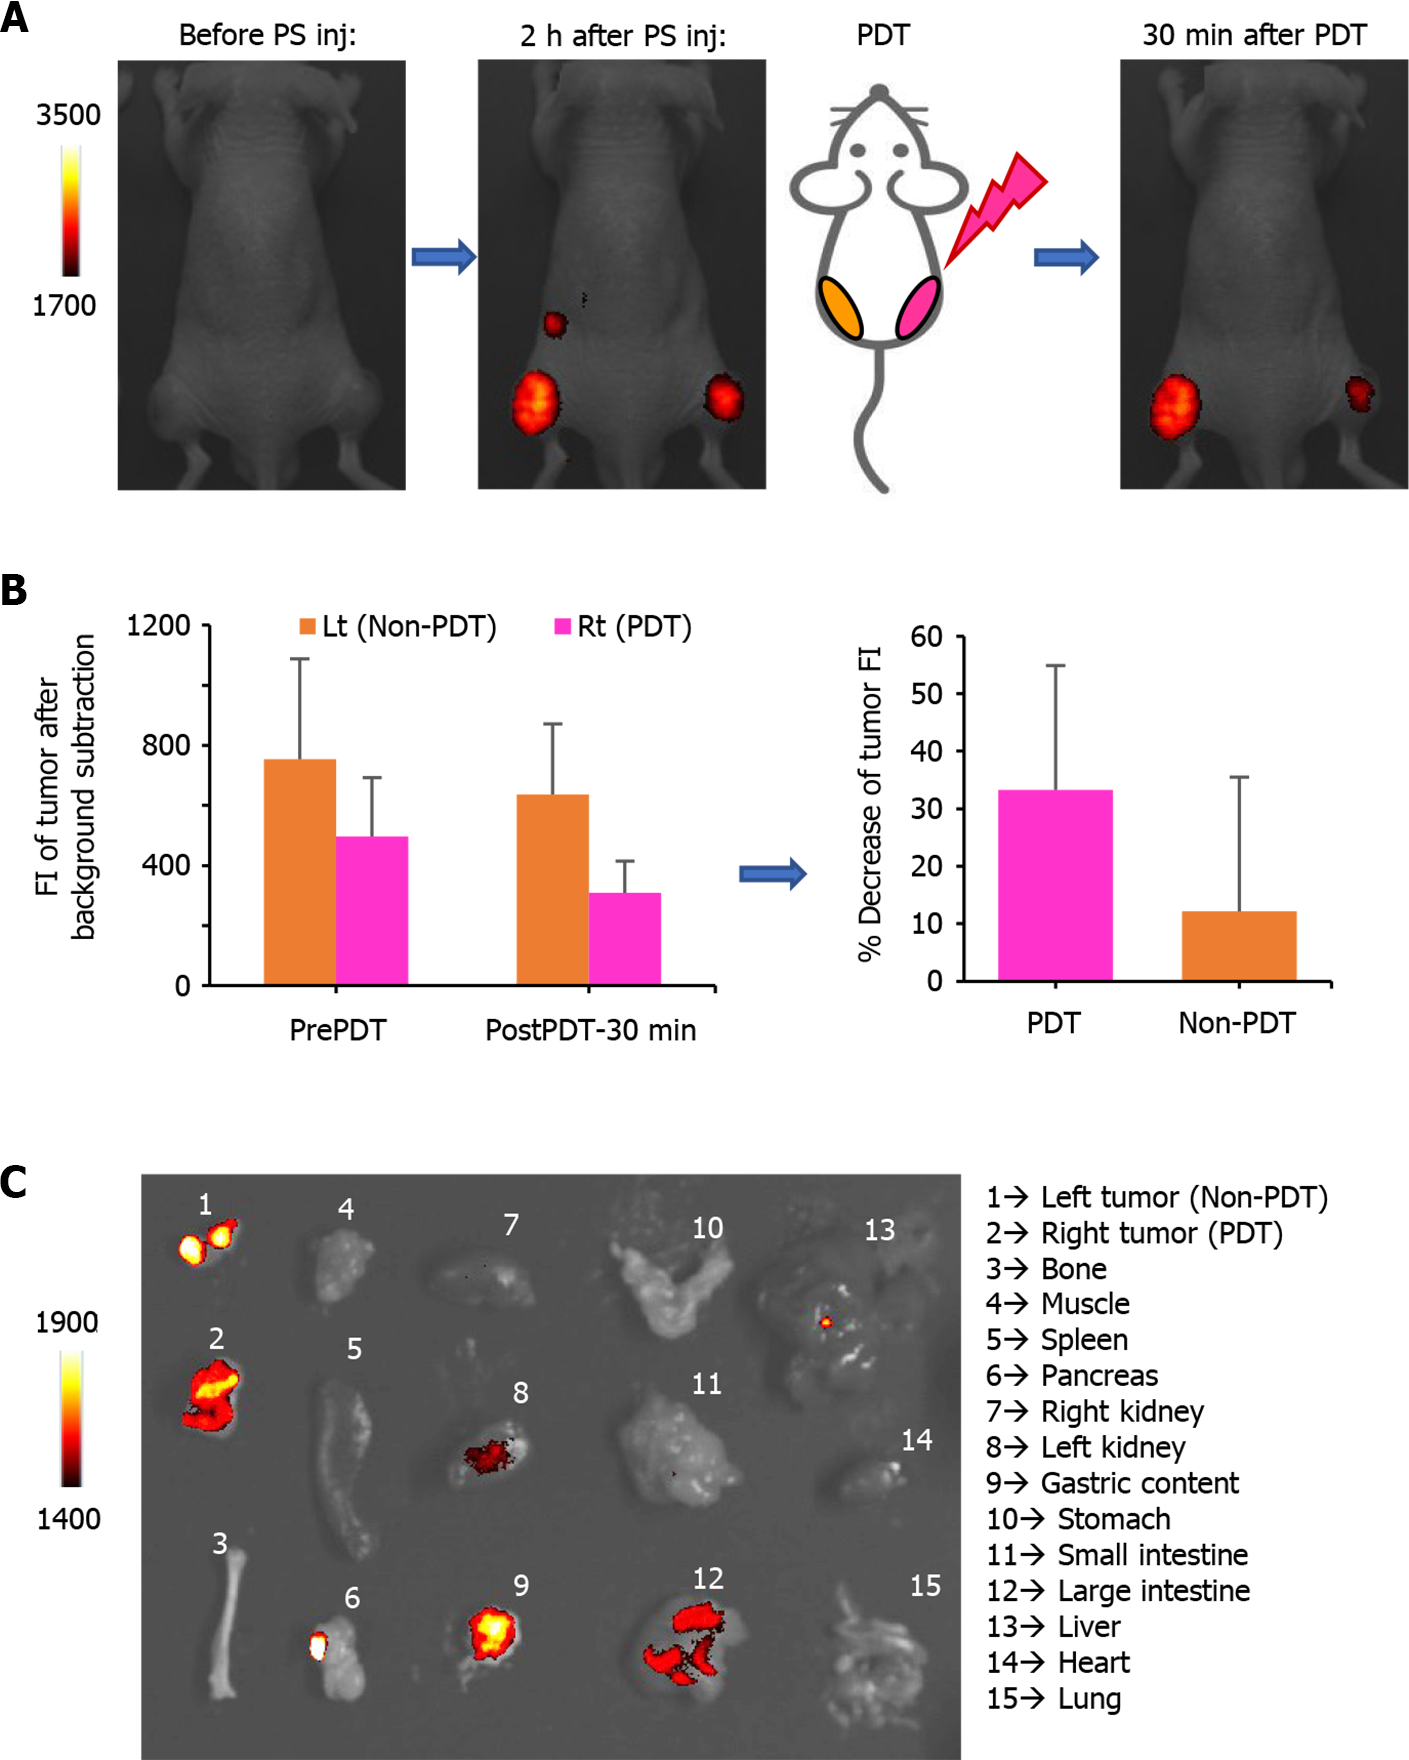
Figure 5 In vivo and ex vivo images before and after photodynamic therapy.
A: Near-infrared fluorescence images of representative tumor bearing mice: before photosensitizer (PS) (FolateSiR-1) injection (left), 2 h after PS injection (center), and 30 min after photodynamic therapy (PDT) (right). The right tumor received PDT while the left tumor did not. Fluorescent signal intensity (FI) of the right tumor decreased immediately after PDT, and the extent of FI reduction is larger than that of the left tumor; B: Bar graph showing the FI of the tumor before- and 30 min after PDT. Data are presented as the mean ± SD (n = 4); C: Ex vivo fluorescence images captured 30 min after PDT. NIR: Near-infrared; Lt: Left; Rt: Right; PS inj: photosensitizer injection; PDT: Photodynamic therapy; Non-PDT: Without PDT; FI: Fluorescent signal intensity.
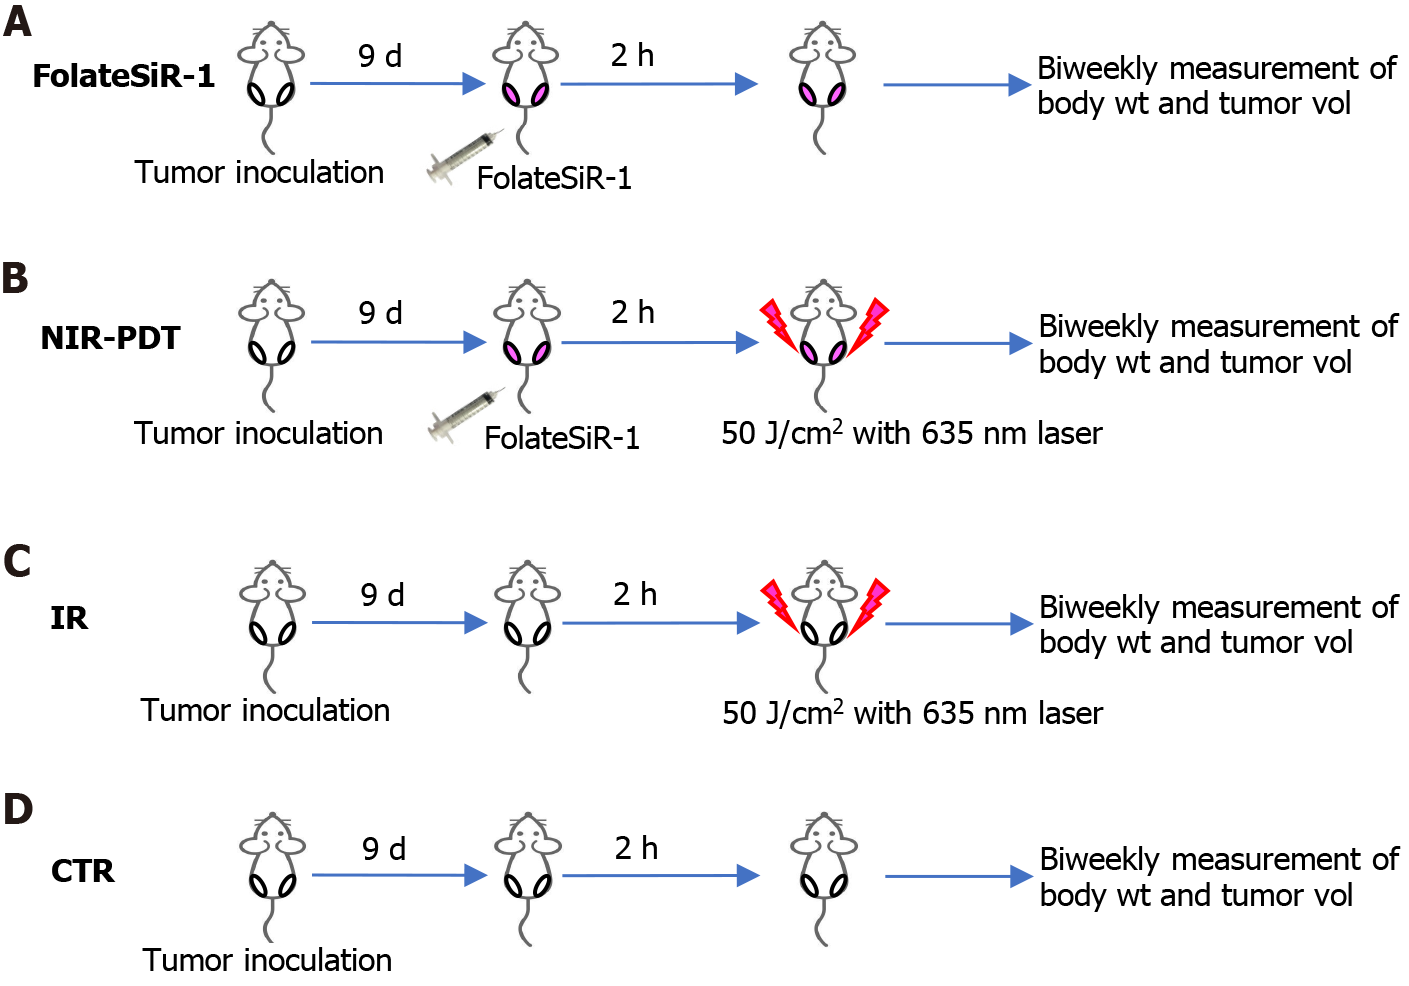
Figure 6 Experimental treatment scheme.
Tumor bearing mice were assigned to four groups: A: folate-Si-rhodamine-1 injection alone; B: Near-infrared (NIR) photodynamic therapy (50 J/cm2); C: NIR irradiation alone (50 J/cm2); and D: no treatment. FolateSiR-1: Folate-Si-rhodamine-1; NIR-PDT: Near-infrared photodynamic therapy; IR: Laser irradiation; CTR: Control; wt: Weight; vol: Volume.
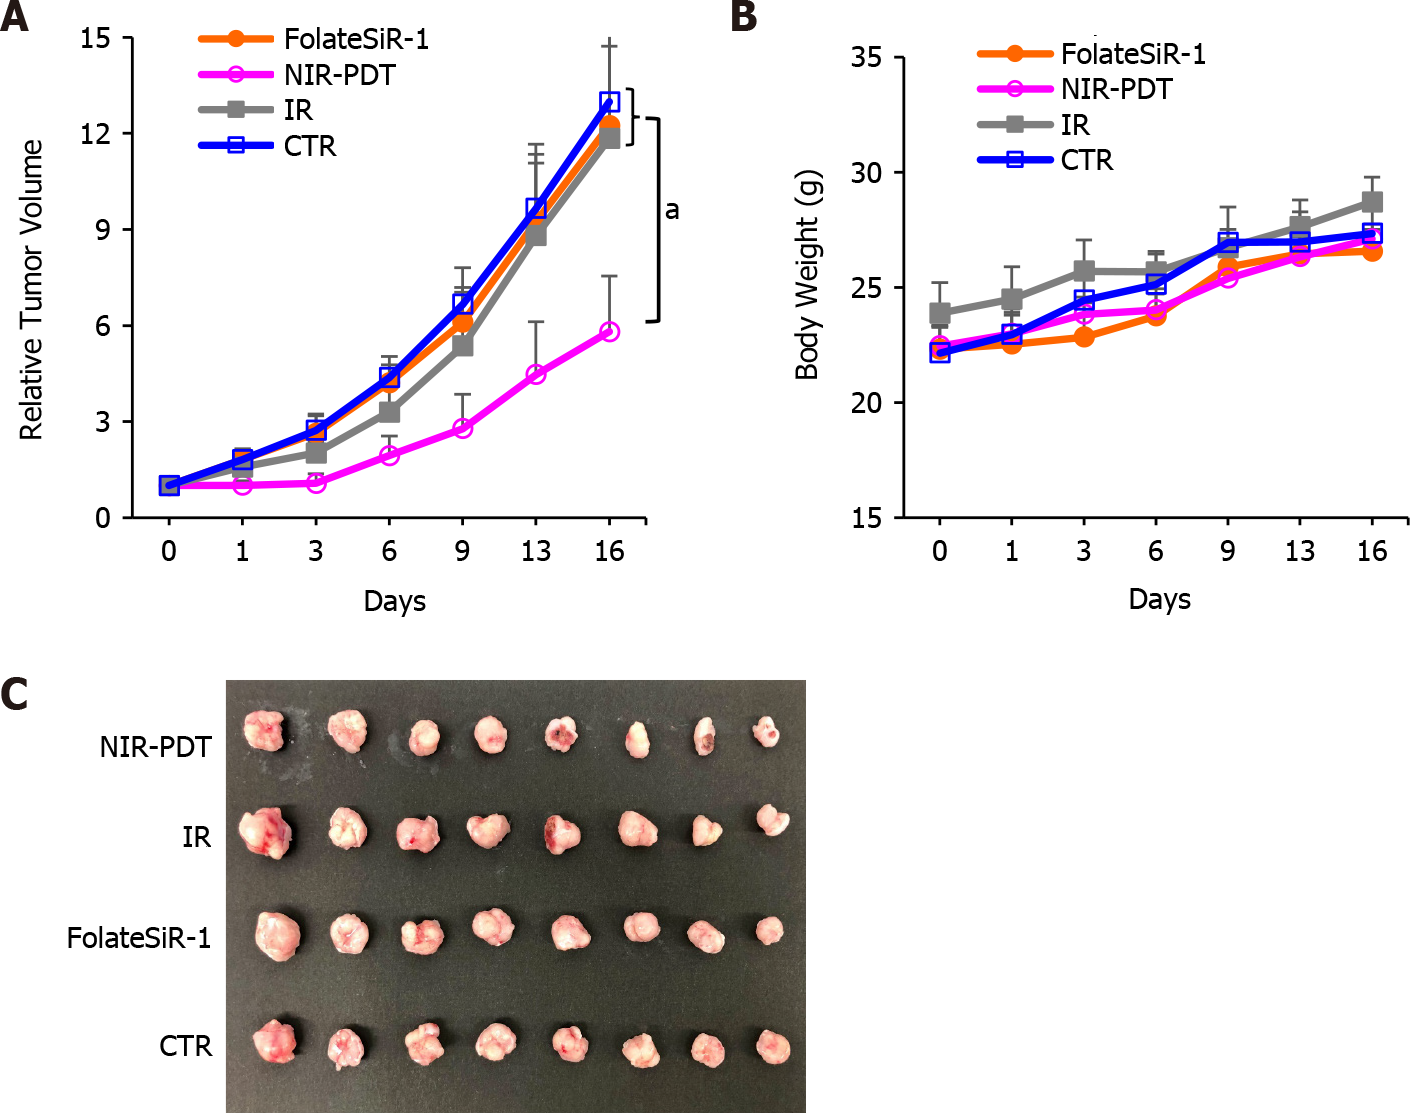
Figure 7 Phototherapeutic effects of photodynamic therapy on KB xenografts and body weight in mice.
A: Tumor volume change is expressed as the relative tumor volume (volume on the indicated day/starting volume prior to the treatment. Tumors-treated by near-infrared photodynamic therapy (NIR-PDT) (50 J/cm2), irradiation alone (50 J/cm2), folate-Si-rhodamine-1 alone, and no treatment are shown in pink (○), gray (■), orange (●), and blue (□), respectively. Tumors-treated by NIR-PDT show significantly delayed growth compared to those of other groups. Values represent the mean ± SD (n = 8), aP < 0.05 NIR-PDT vs other groups; B: Average body weight did not differ significantly among the four groups of mice; C: Images of ex vivo tumors excised 16 d after treatment. FolateSiR-1: Folate-Si-rhodamine-1; NIR-PDT: Near-infrared photodynamic therapy; IR: Laser irradiation; CTR: Control.
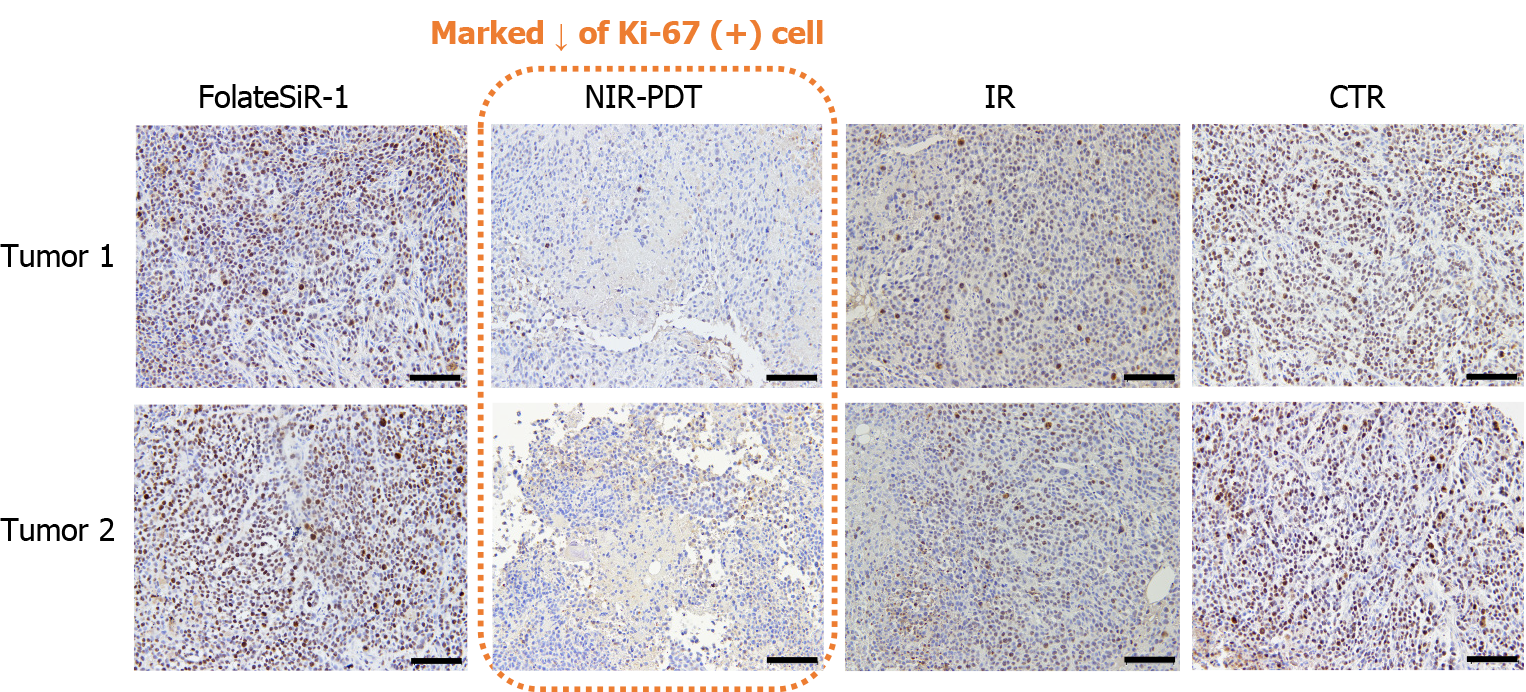
Figure 8 Tumor immunohistochemical staining of Ki-67 at 24 h after near-infrared photodynamic therapy.
The weak staining and marked reduction of Ki-67-positive cells were detected in tumors treated with near-infrared photodynamic therapy (scale bar = 100 μm, 20 × magnification). FolateSiR-1: Folate-Si-rhodamine-1; NIR-PDT: Near-infrared photodynamic therapy; IR: Laser irradiation; CTR: Control.
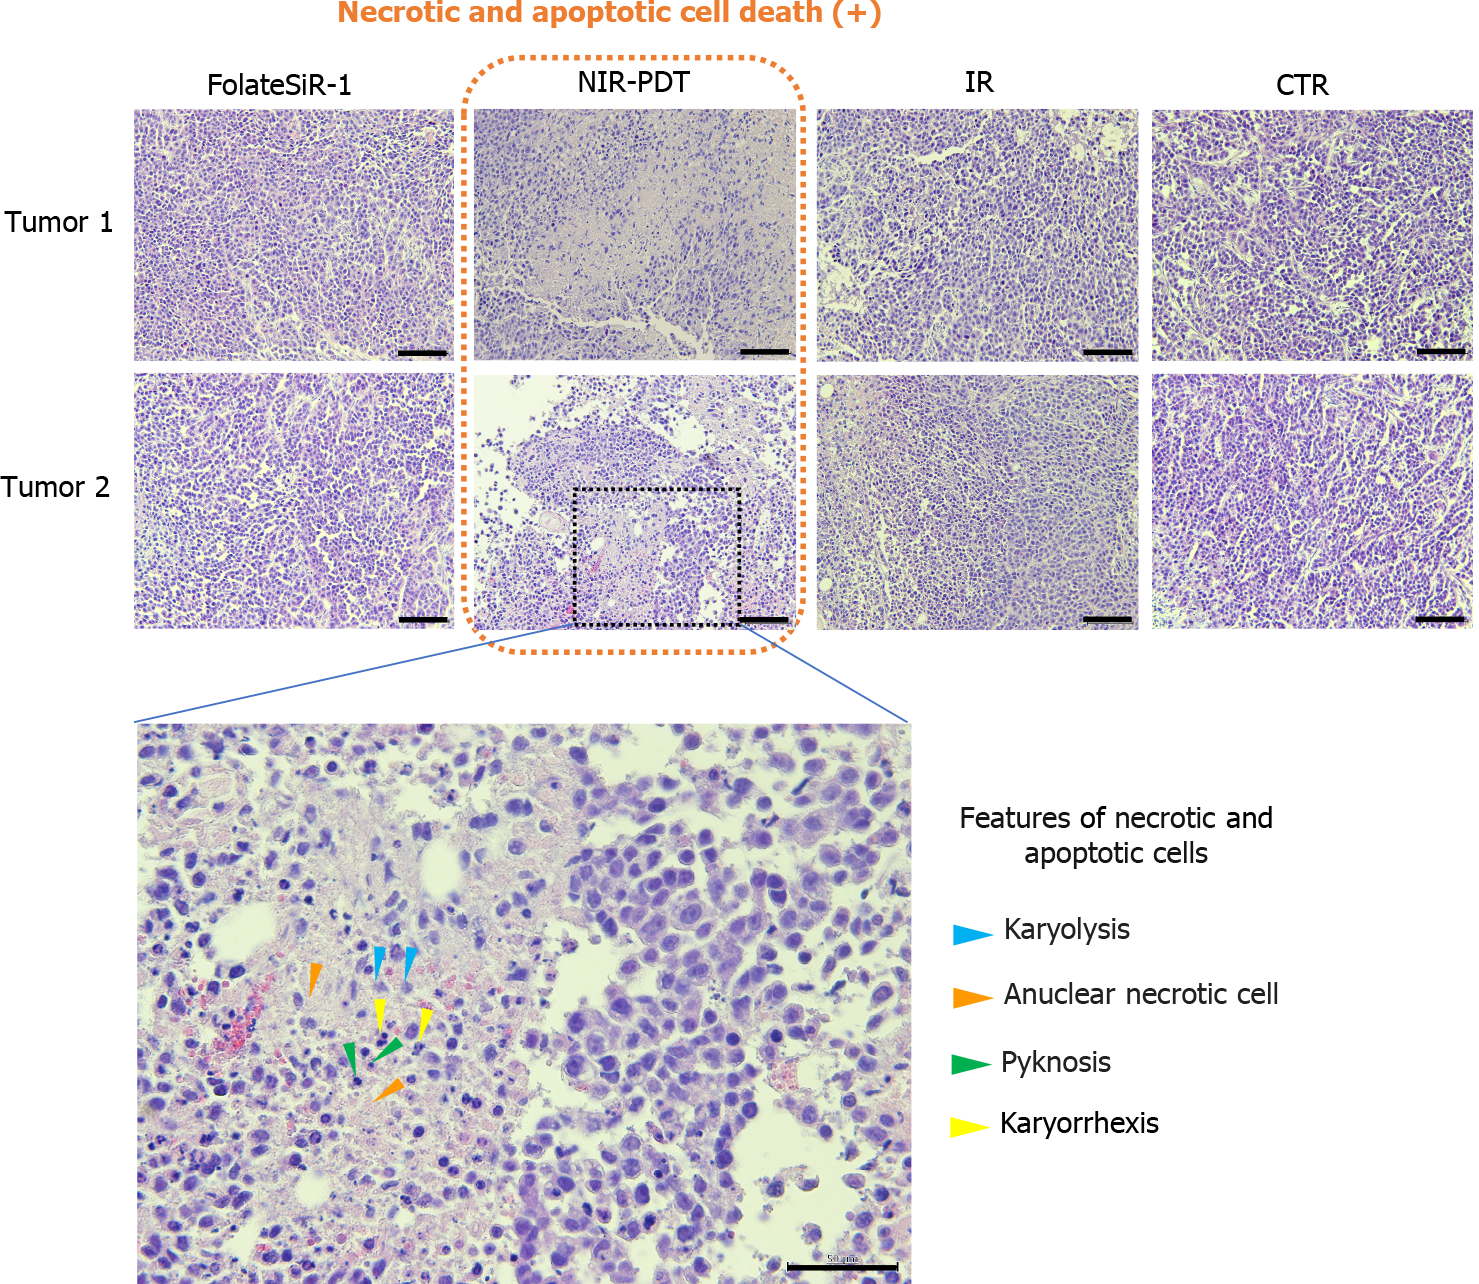
Figure 9 Histological examination of the destructive effects of near-infrared photodynamic therapy in tumor tissues 24 h after near-infrared photodynamic therapy.
Tumors are stained with hematoxylin and eosin. The left lowermost image is a magnification of the indicated portion of the upper image. Some features of necrotic and apoptotic cells are shown with arrowheads: nuclear fading due to DNA loss, karyolysis (blue), anuclear necrotic cells with a glossier homogenous appearance (orange), nuclear chromatin condensation, pyknosis (green), nuclear fragmentation, and karyorrhexis (yellow). (Scale bar = 100 μm, 20 × magnification for upper two rows, and scale bar = 50 μm, 40 × magnification for lower row). FolateSiR-1: folate-Si-rhodamine-1; NIR-PDT: Near-infrared photodynamic therapy; IR: laser irradiation; CTR: control.
- Citation: Aung W, Tsuji AB, Hanaoka K, Higashi T. Folate receptor-targeted near-infrared photodynamic therapy for folate receptor-overexpressing tumors. World J Clin Oncol 2022; 13(11): 880-895
- URL: https://www.wjgnet.com/2218-4333/full/v13/i11/880.htm
- DOI: https://dx.doi.org/10.5306/wjco.v13.i11.880


