Copyright
©The Author(s) 2021.
World J Clin Oncol. May 24, 2021; 12(5): 323-334
Published online May 24, 2021. doi: 10.5306/wjco.v12.i5.323
Published online May 24, 2021. doi: 10.5306/wjco.v12.i5.323
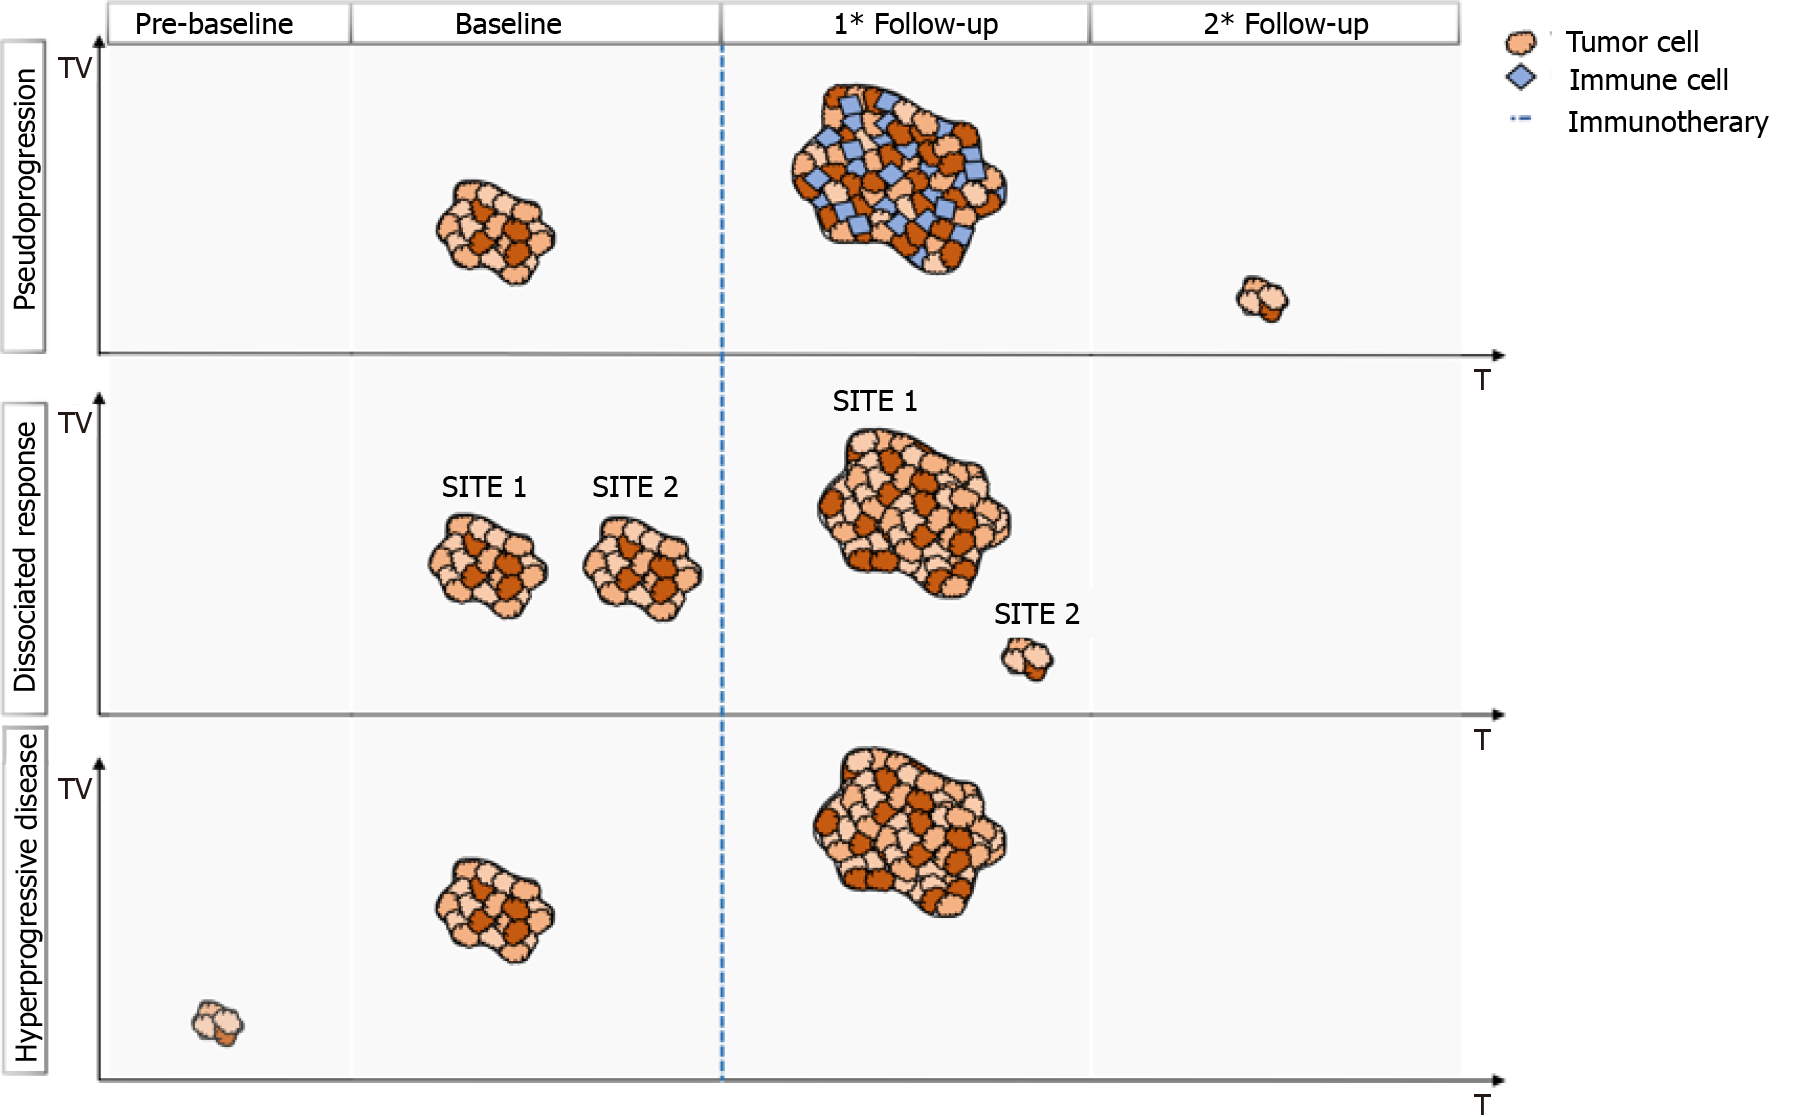
Figure 1 Graphical summary of different responses to immunotherapy.
Pseudoprogression: increase of longest diameter > 20% at first follow-up, followed by a decrease of > 30% at subsequent follow-up. Dissociated response: increase of some target lesions of > 20% and reduction of at least another target lesion > 30% at follow-up. Hyperprogression: significant increase of target lesion at first follow-up; a baseline study is needed to correctly assess the hyperprogression. T: Time; TV: Tumor volume.
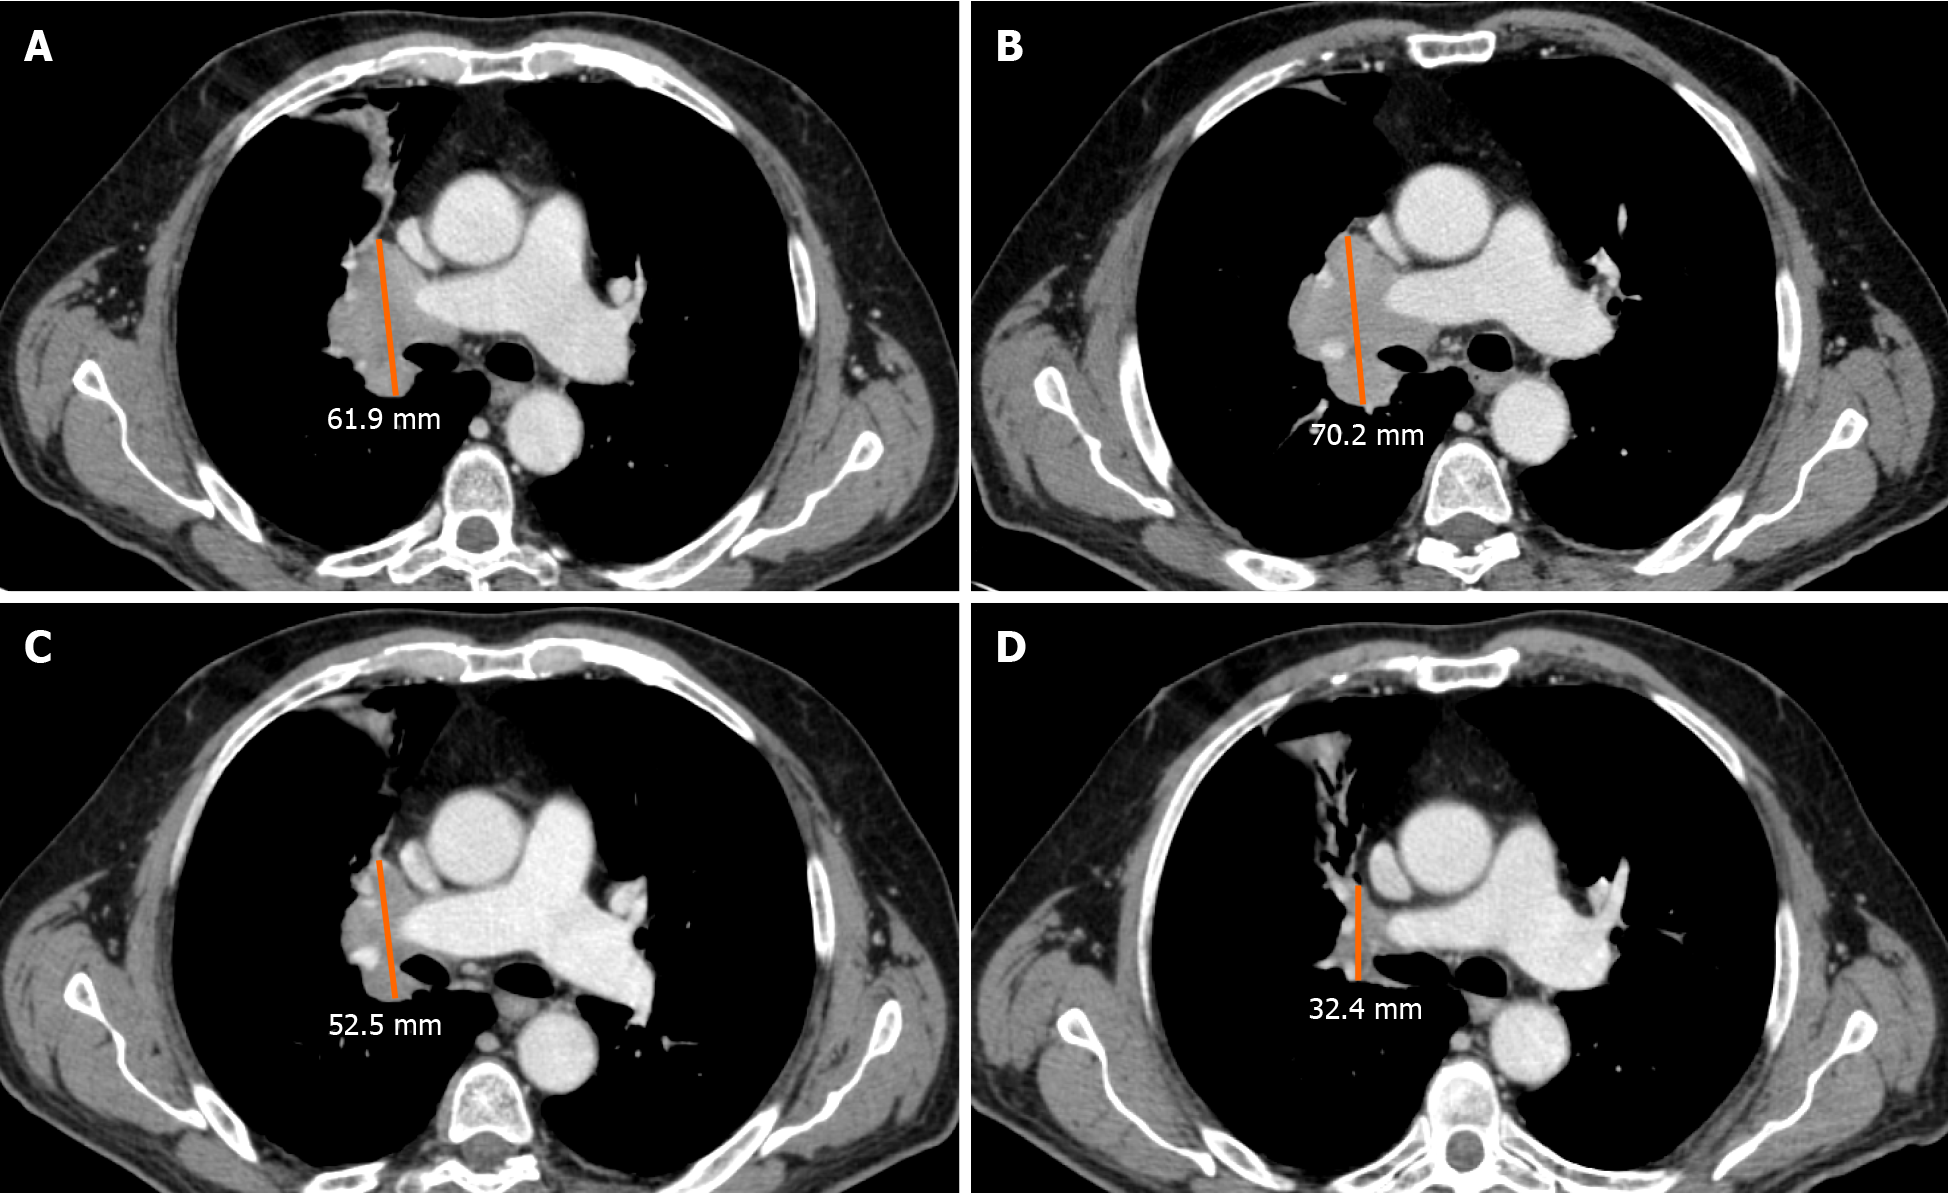
Figure 2 Axial computed tomography images in the portal-venous phase of a 69 y/o male, ex-smoker with non-small lung cell carcinoma, during second-line therapy with Atezolizumab.
A: Pre-treatment imaging show the right peri-hilar lesion; B: During follow-up after 4 wk the lesion increase in size; C and D: During the following computed tomography scans (8 and 12 wk) a significant decrease in longest diameter was achieved, confirming a final response to treatment with the presence of intercurrent (B) pseudoprogression.
Figure 3 Axial computed tomography images in the portal-venous phase of a 65 y/o female, with non-small lung cell carcinoma and a programmed death-ligand 1 expression > 90%, during first-line treatment with Pembrolizumab.
A: In the baseline examination, computed tomography (CT) shows a metastatic lesion in the right adrenal gland; B: After 4 wk of treatment, the lesion becomes bigger, with a total increment of 21%, referred to as unconfirmed progression; C-E: during following CT scans, the target lesion shows a progressive dimensional reduction with a total decrease of 46%. These variations in the size of the lesion, during immunotherapy, was in line with pseudoprogression.
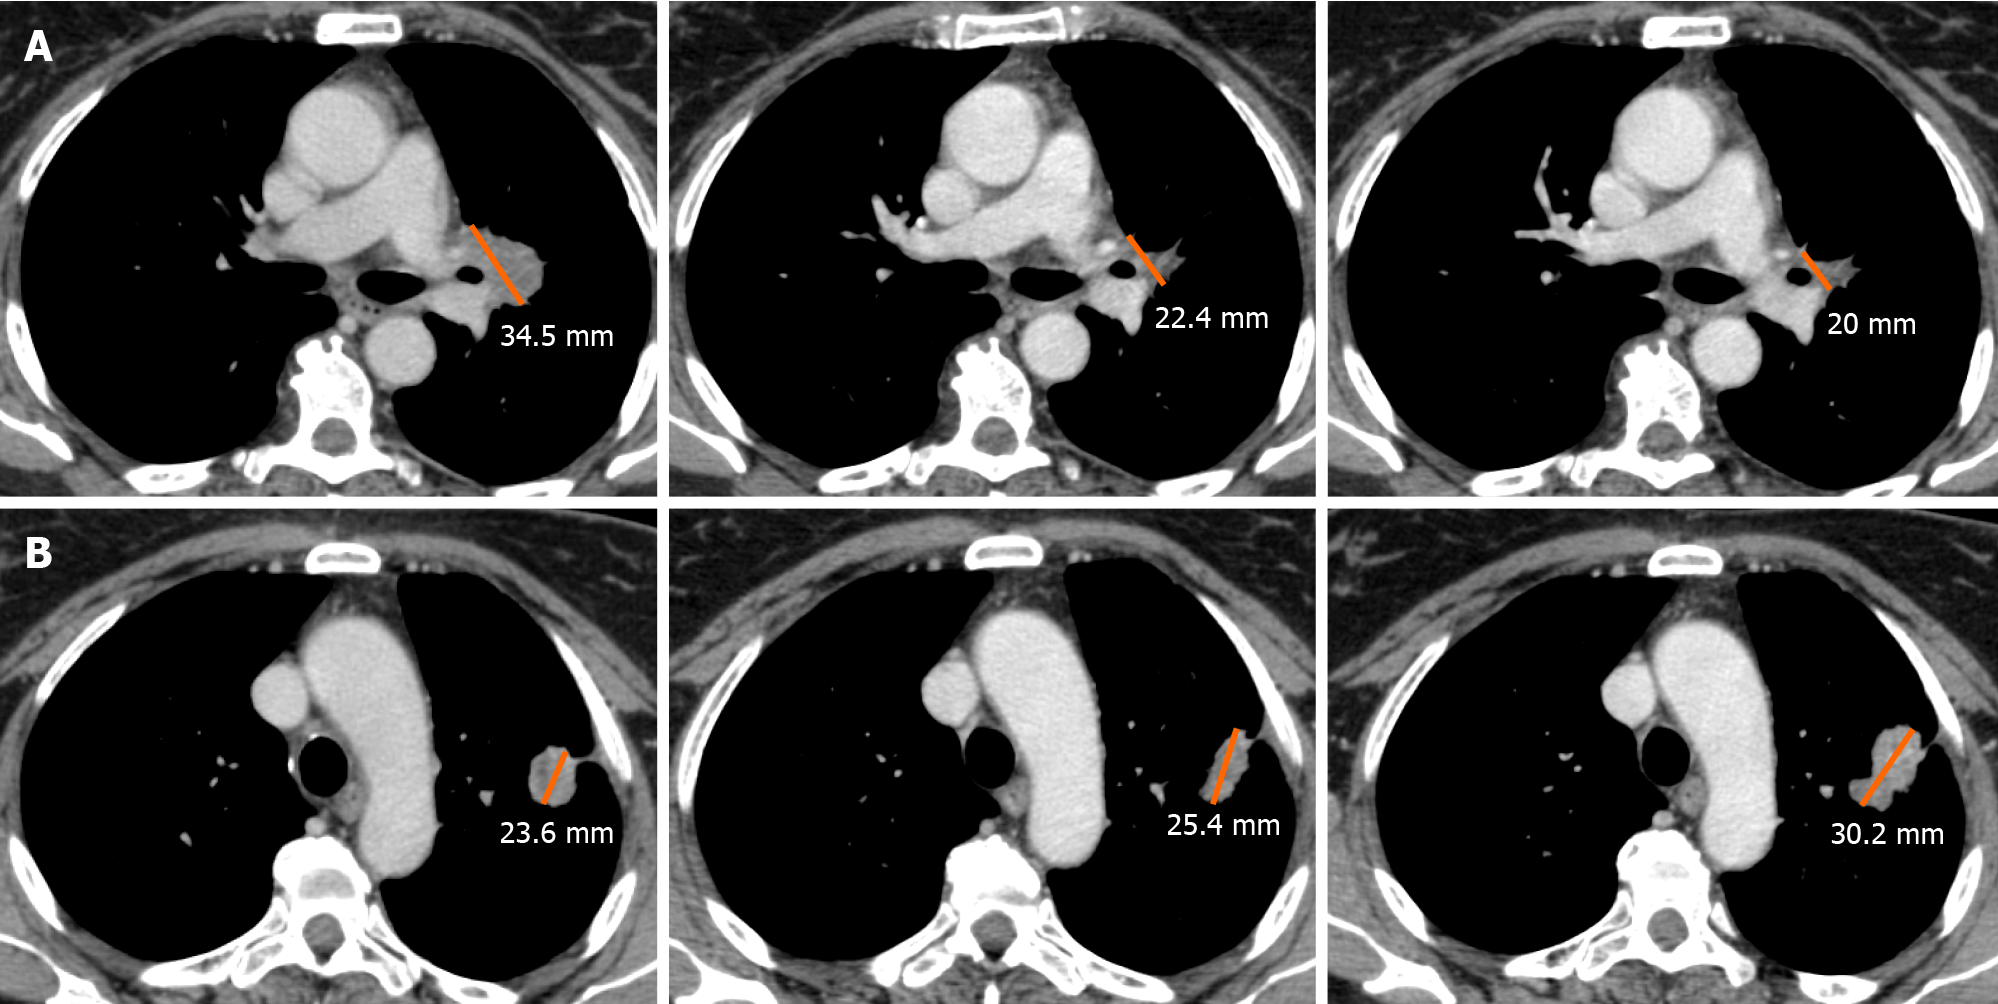
Figure 4 Axial computed tomography images in the portal-venous phase of a 57 y/o female ex-smoker with non-small lung cell carcinoma during second-line treatment with Pembrolizumab.
Images show a dissociated response of two target lesions. A: The left peri-hilar lesion progressively decreased in size during follow-up, if compared to the pre-treatment computed tomography scan (after 3 wk and after 9 wk of immunotherapy from left to right, respectively); B: The second target lesion in left lung firstly regressed after 3 wk of immunotherapy showing, then a progression during the follow-up period (from left to right, respectively).
- Citation: Ippolito D, Maino C, Ragusi M, Porta M, Gandola D, Franzesi CT, Giandola TP, Sironi S. Immune response evaluation criteria in solid tumors for assessment of atypical responses after immunotherapy. World J Clin Oncol 2021; 12(5): 323-334
- URL: https://www.wjgnet.com/2218-4333/full/v12/i5/323.htm
- DOI: https://dx.doi.org/10.5306/wjco.v12.i5.323


