Copyright
©The Author(s) 2021.
World J Clin Oncol. Apr 24, 2021; 12(4): 262-271
Published online Apr 24, 2021. doi: 10.5306/wjco.v12.i4.262
Published online Apr 24, 2021. doi: 10.5306/wjco.v12.i4.262
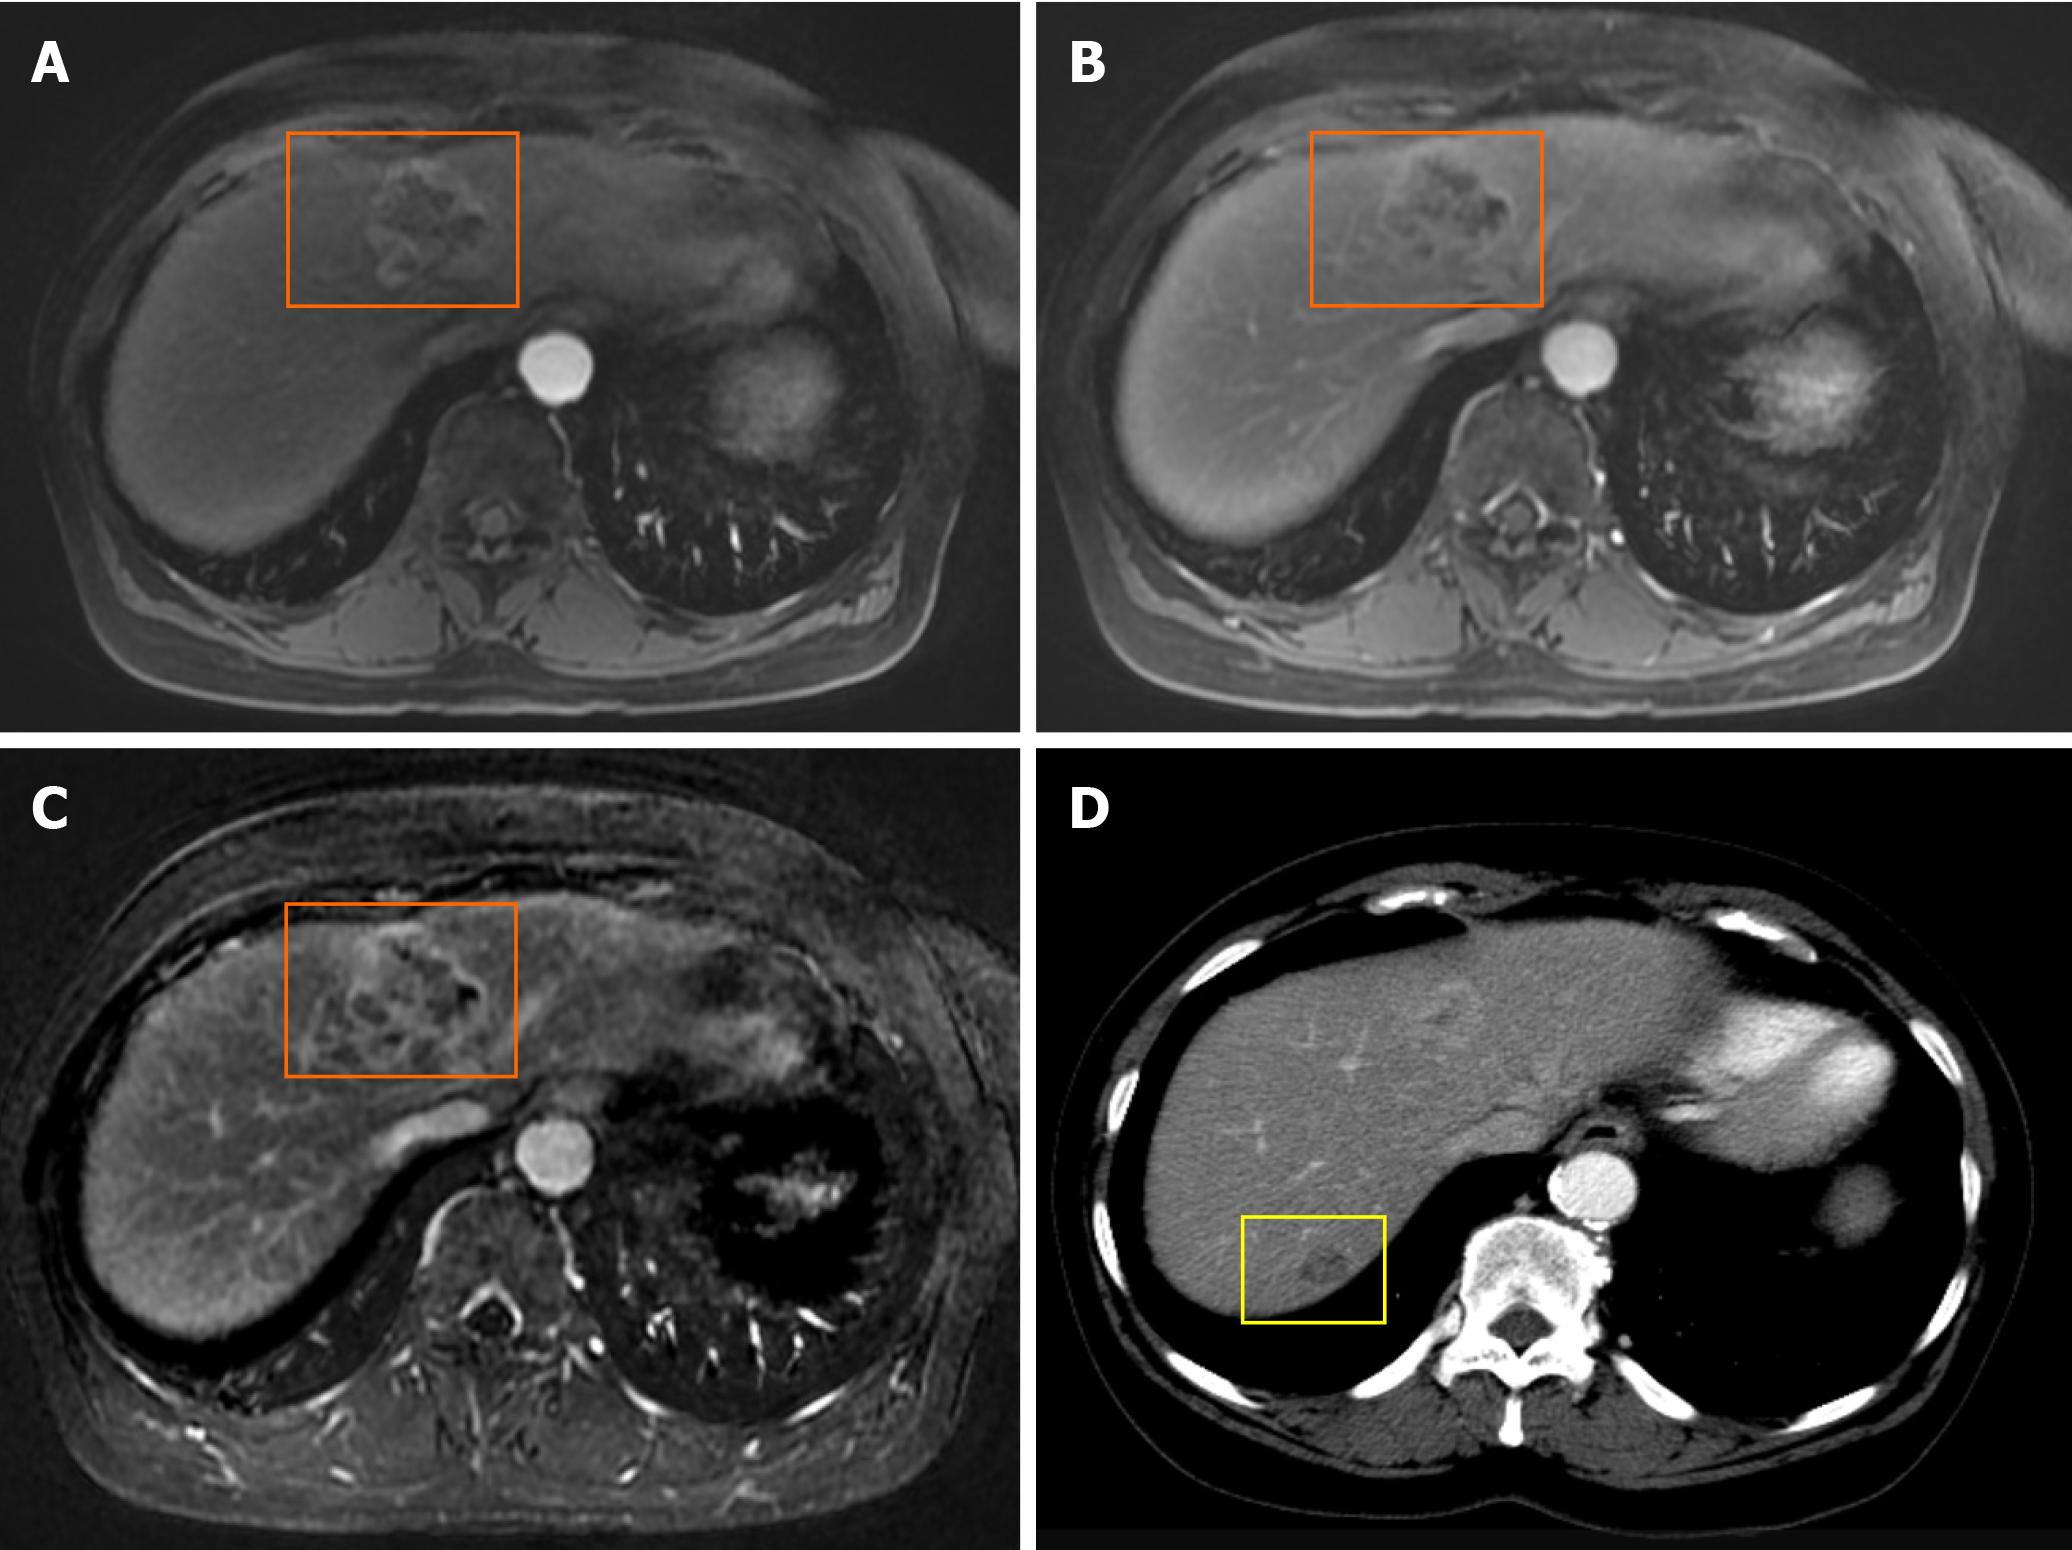
Figure 1 Magnetic resonance imaging and computed tomography imaging.
A-C: Magnetic resonance imaging with gadolinium was performed and demonstrated the lesion in segment 4 (orange box); D: Computed tomography imaging showed the lesion in segment 7 most clearly (yellow box).
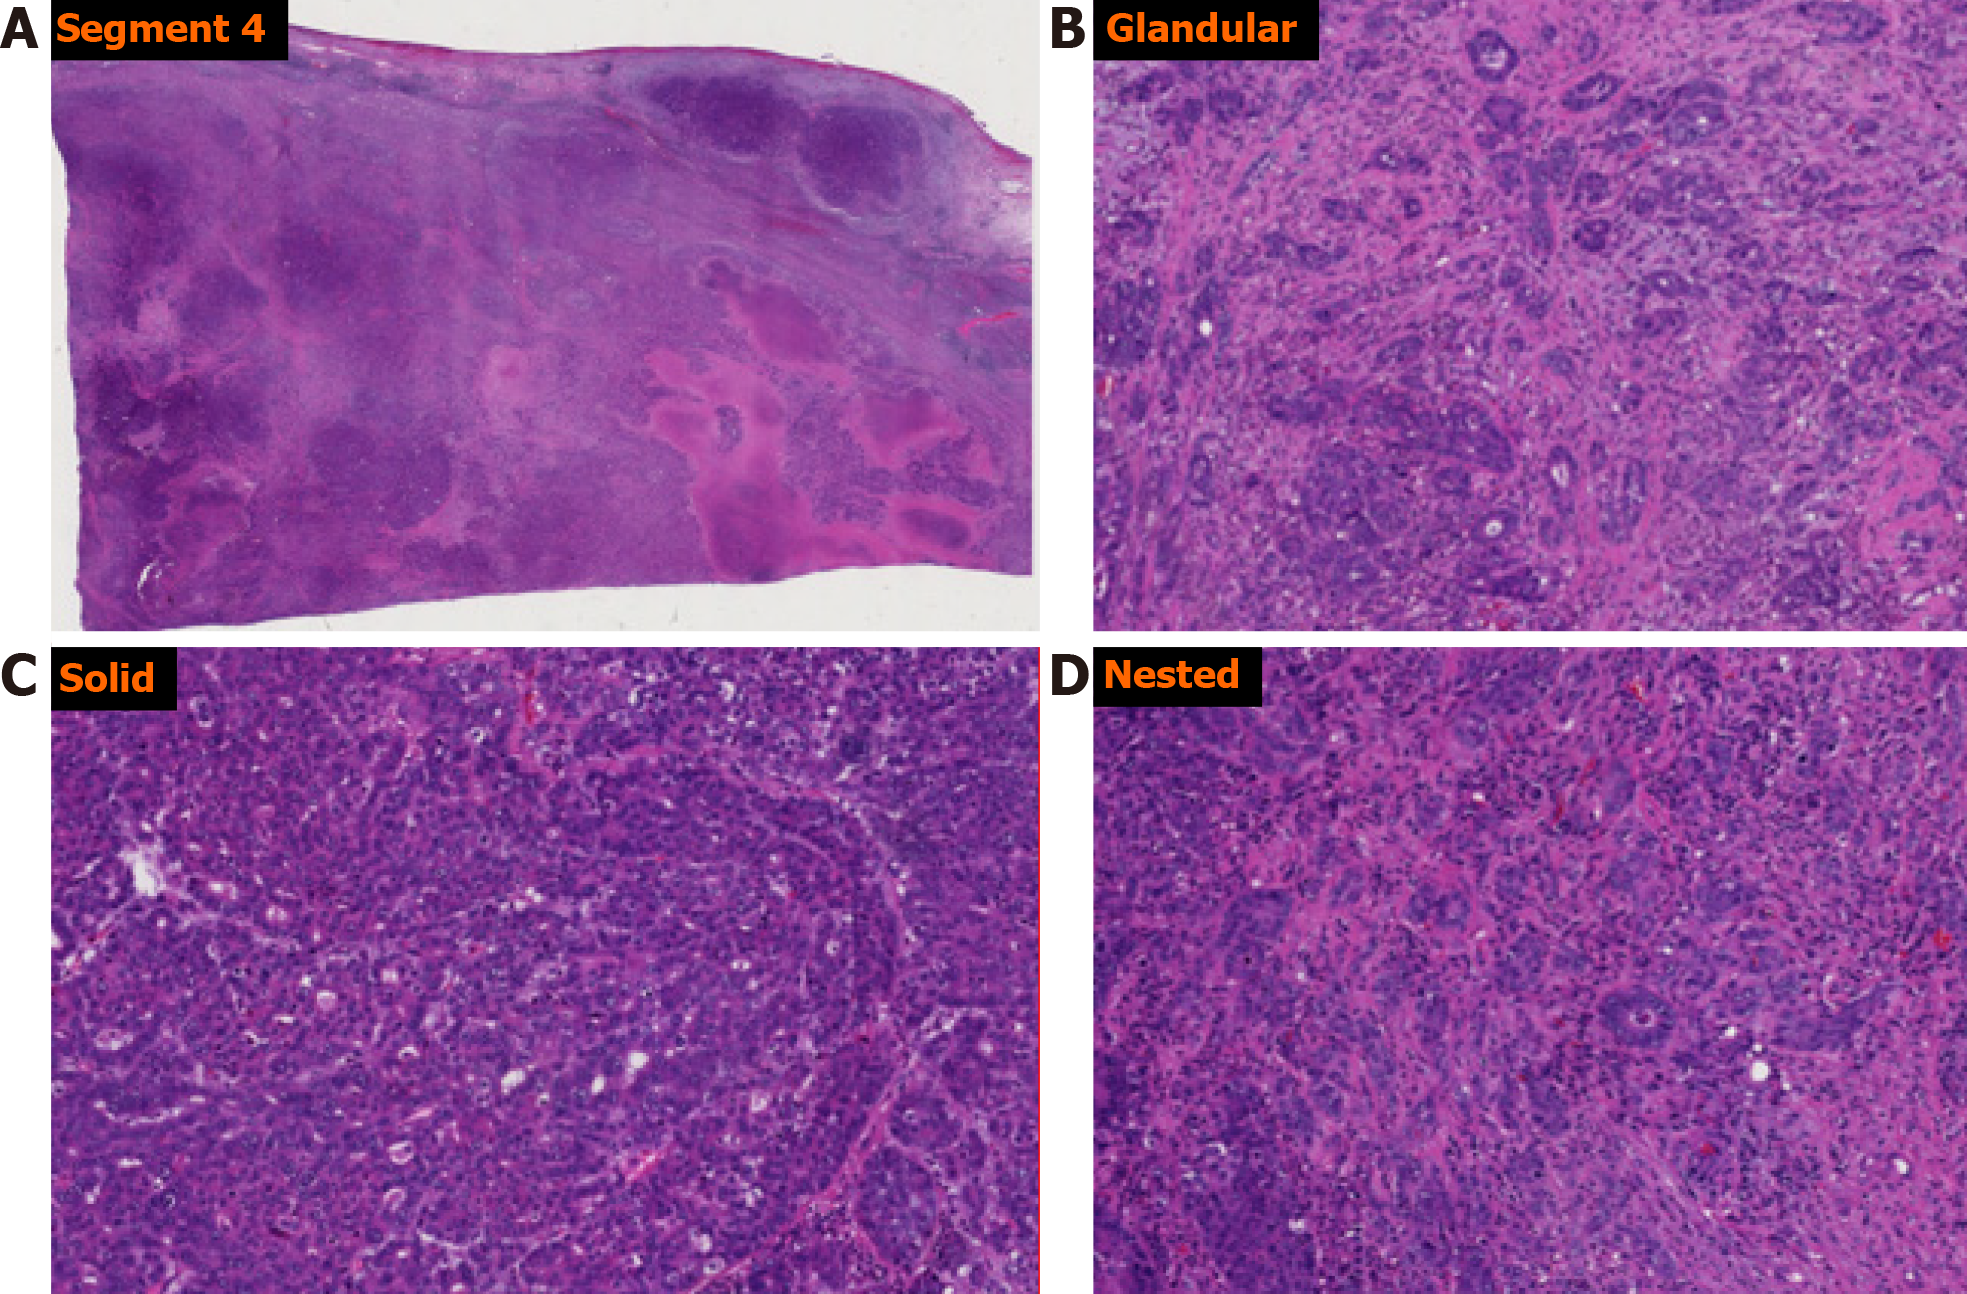
Figure 2 Histologic examination.
A: The larger, segment 4 liver lesion revealed a tumor with variegated histology and regions of necrosis; B-D: On closer examination, regions with glandular (B), solid (C), and nested (D) patterns were identified on morphology.
Figure 3 Immunohistochemical investigation of the larger, segment 4 liver lesion.
The tumor showed variable and focal positivity for alpha-fetoprotein, Hep-par-1, as well as synaptophysin and neuron-specific enolase. A: Alpha-fetoprotein; B: Synaptophysin; C: Hep-par 1; D: Neuron-specific enolase. AFP: Alpha-fetoprotein; NSE: Neuron-specific enolase.
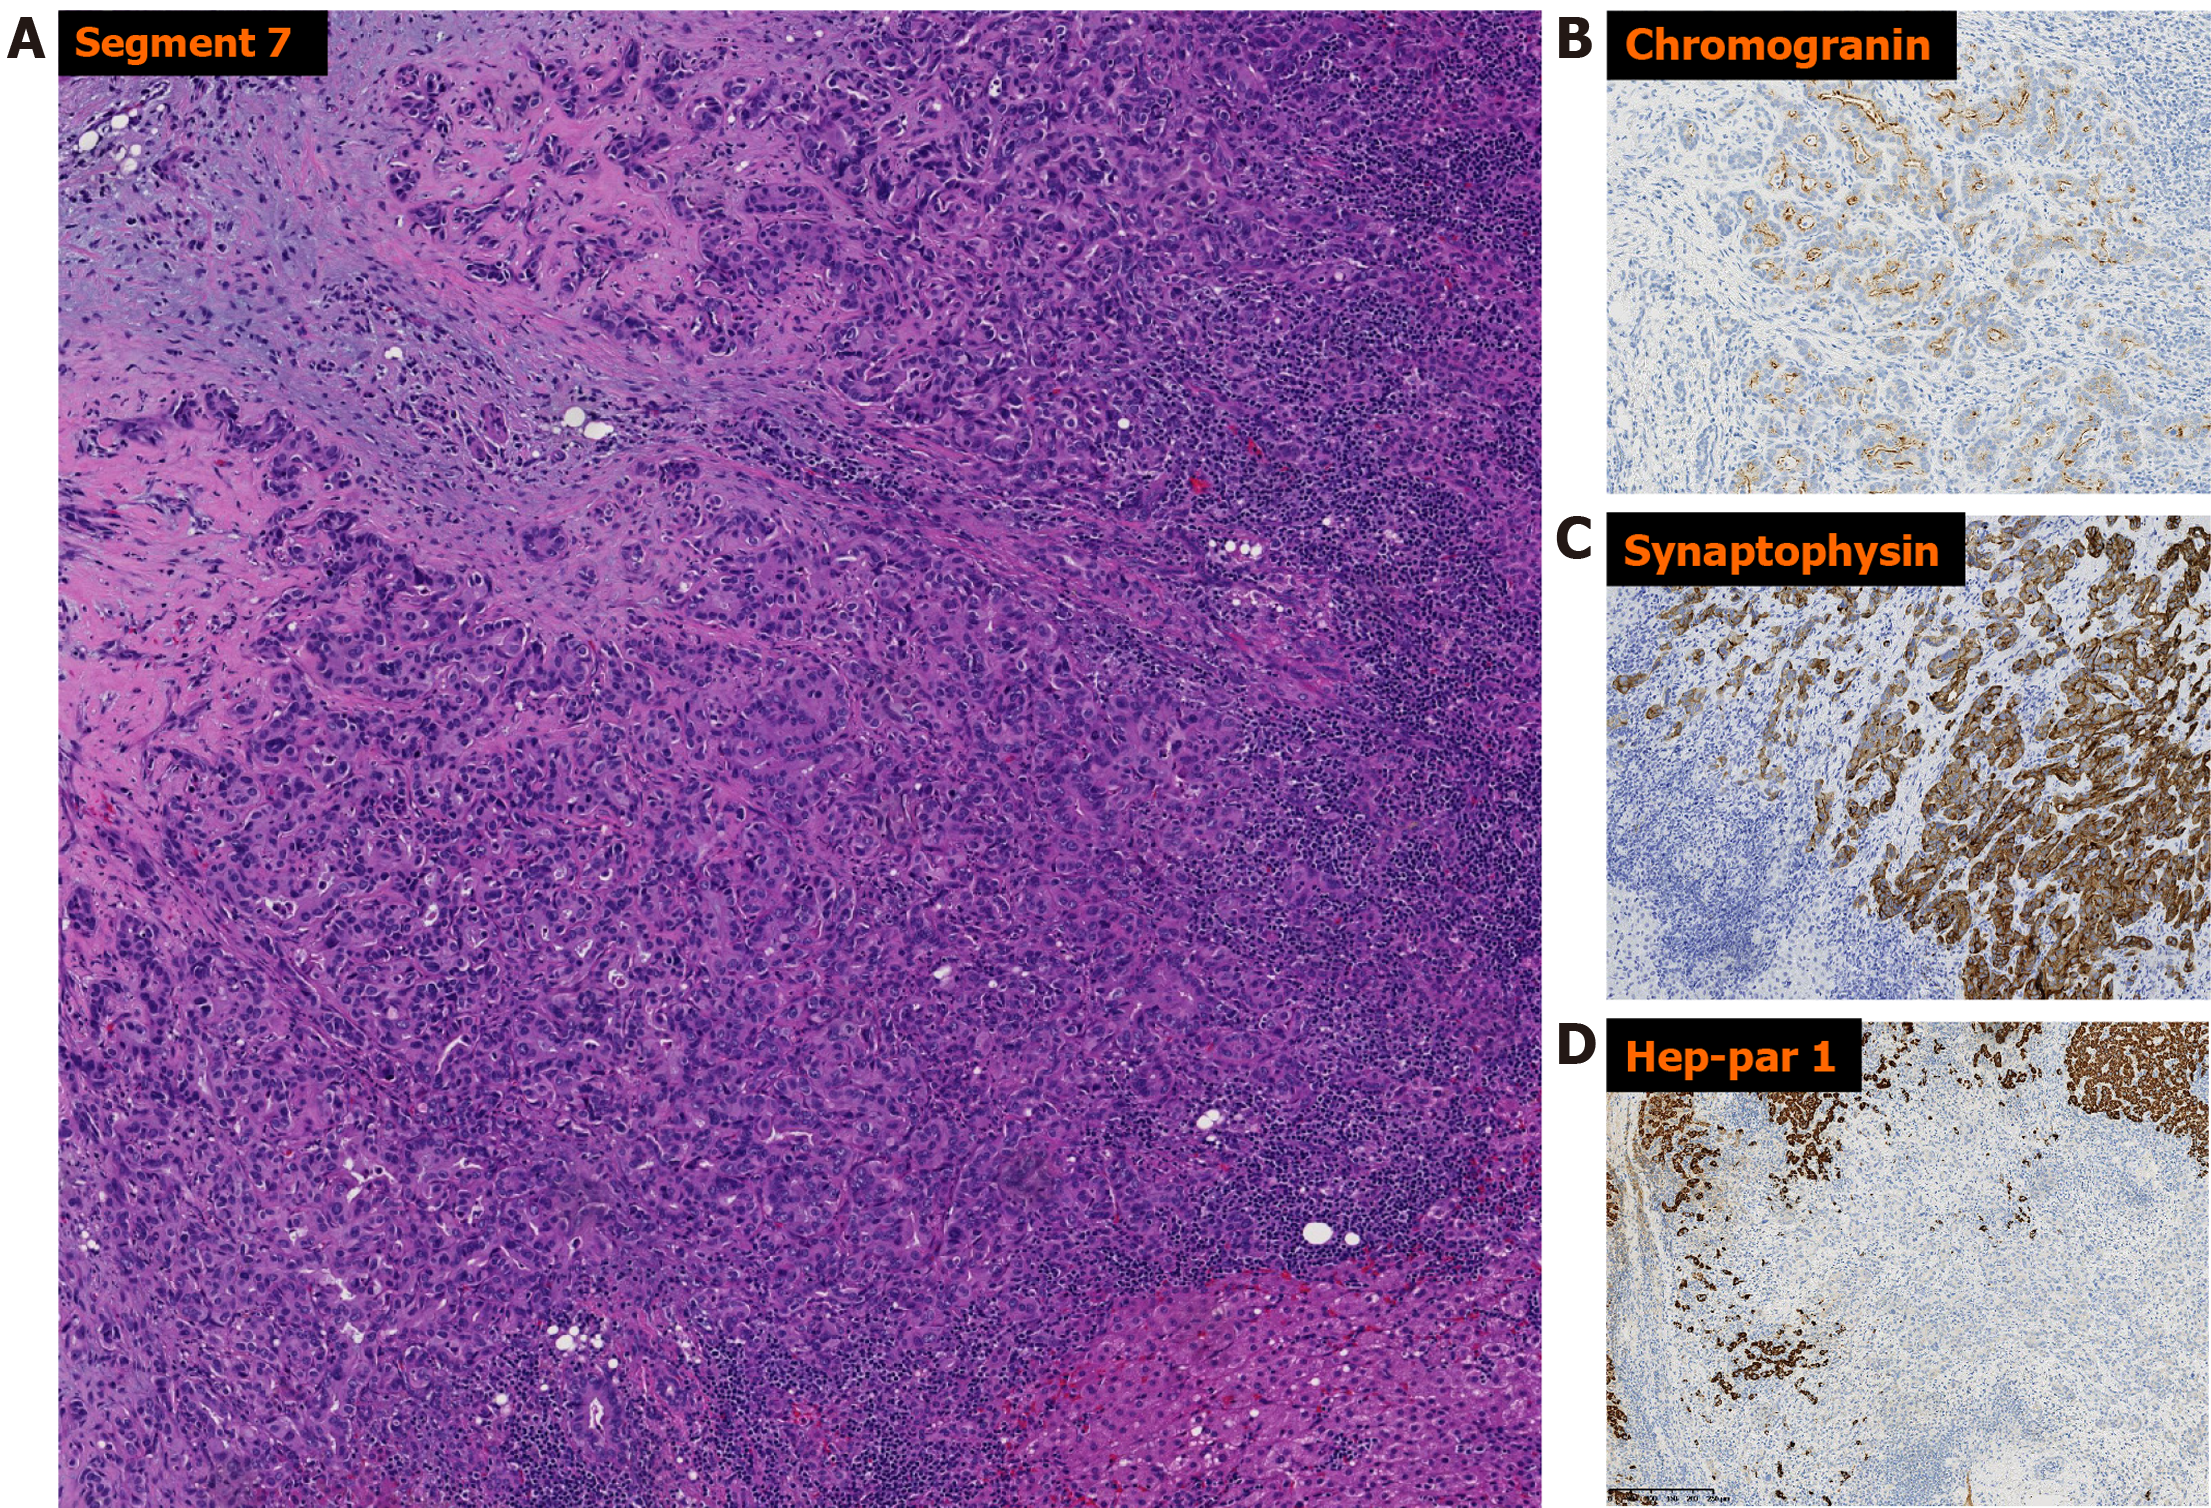
Figure 4 Morphologic evaluation of the smaller, segment 7 liver lesion.
A: A predominantly glandular morphology was revealed; B-D: On immunohistochemical investigation, the cells were found to be positive for chromogranin and synaptophysin and negative for Hep-par-1.
- Citation: Dimopoulos YP, Winslow ER, He AR, Ozdemirli M. Hepatocellular carcinoma with biliary and neuroendocrine differentiation: A case report. World J Clin Oncol 2021; 12(4): 262-271
- URL: https://www.wjgnet.com/2218-4333/full/v12/i4/262.htm
- DOI: https://dx.doi.org/10.5306/wjco.v12.i4.262


