Copyright
©The Author(s) 2017.
World J Gastrointest Pharmacol Ther. Feb 6, 2017; 8(1): 47-59
Published online Feb 6, 2017. doi: 10.4292/wjgpt.v8.i1.47
Published online Feb 6, 2017. doi: 10.4292/wjgpt.v8.i1.47
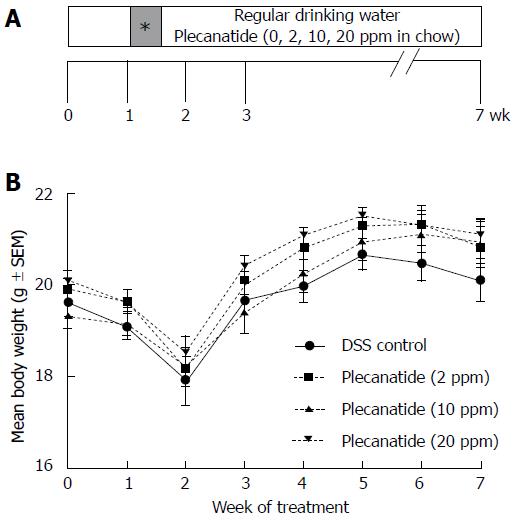
Figure 1 Inflammation-driven colorectal carcinogenesis in Apc+/Min-FCCC mice.
A: Outline depicting the experimental design of the animal study. Female Apc+/Min-FCCC mice (n = 23/group) were randomized into four treatment groups: DSS alone (vehicle control) or DSS plus diet supplemented with 2, 10 or 20 ppm plecanatide. One week later, all animals were administered 2% DSS in the drinking water for 4 d (shaded box with asterisk) and regular water for the remainder of the study. At the time of euthanasia, (7 wk of study), the entire colon were fixed in formalin for histopathological evaluation; B: Body weights of Apc+/Min-FCCC mice treated with either DSS alone or DSS plus a diet supplemented with indicated concentrations of plecanatide (n = 20-23/group). Body weights were obtained weekly, and DSS was administered to all animals on days 7-10 of study. DSS: Dextran sodium sulfate.
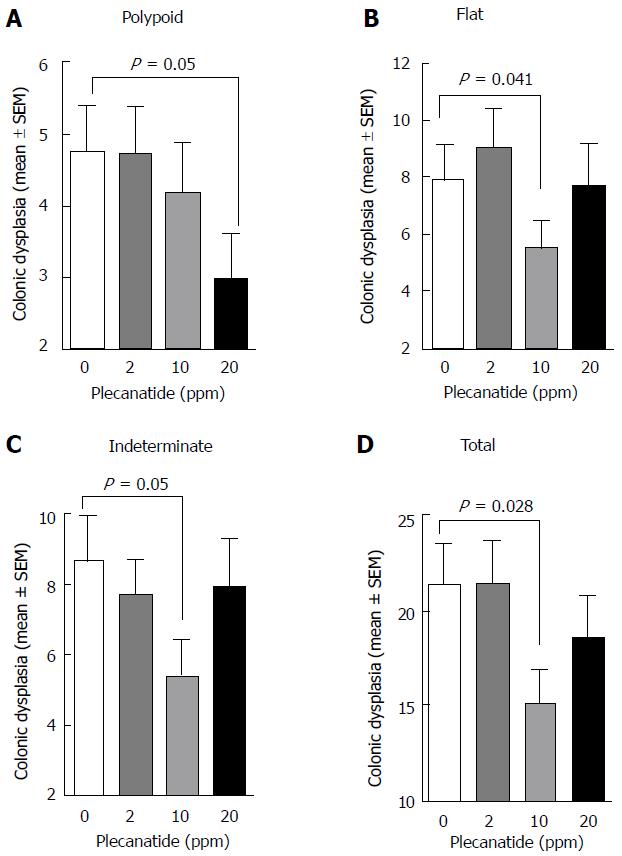
Figure 2 Treatment with plecanatide inhibits inflammation-associated colonic dysplasia in dextran sodium sulfate-treated Apc+/Min-FCCC mice.
Analyses revealed the number of pathologically confirmed polypoid (A), flat (B), indeterminate (C) and total (D) dysplasias within the colon of DSS-treated mice following administration (7 wk) of either control diet or diet supplemented with varying doses of plecanatide (n = 23/group). Wilcoxon 2-sample test and analysis of variance (ANOVA) were used to compare the multiplicity of dysplasias in independent groups. A P value ≤ 0.05 was considered statistically significant. DSS: Dextran sodium sulfate
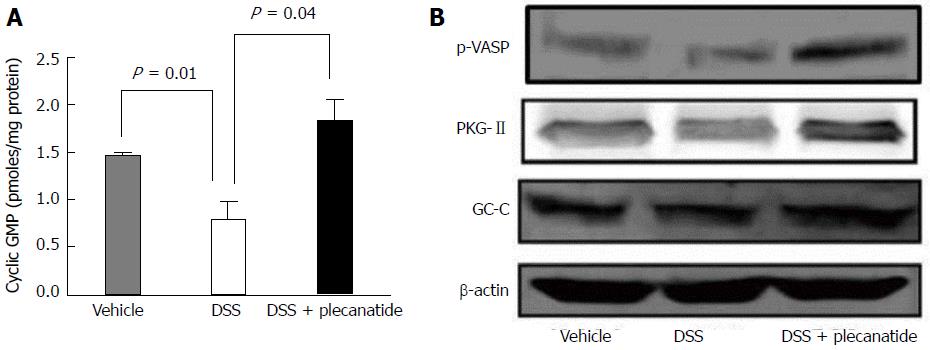
Figure 3 Orally administered plecanatide activates guanylate cyclase-C signaling within the colon.
Effect of plecanatide on (A) stimulation of cGMP production and (B) expression of phosphorylated VASP, PKG-II and GC-C in colon tissues from Apc+/Min-FCCC mice with DSS-induced acute inflammation (n = 6/group). Mice with acute inflammation were administered plecanatide (2.5 mg/kg) by oral gavage; a dose equivalent to that ingested daily by animals fed a diet supplemented with 10 ppm plecanatide in the main tumorigenesis study. Colon tissue (1 cm) from 6 animals per group was pooled to prepare cell lysates. Intracellular cGMP levels depicted in (A) are expressed as pmoles/mg protein ± SEM. Student t test was used to evaluate differences in cGMP between treatment groups. P values ≤ 0.05 were considered statistically significant. Representative Western blot analyses of phospho-VASP, PKG-II and GC-C were performed using appropriate antibodies. To demonstrate equivalent protein loading for each condition, membranes were probed subsequently with β-actin antibody. GC-C: Guanylate cyclase-C; GMP: Guanosine monophosphate; p-VASP: Phospho-vasodilator-stimulated phosphoprotein; PKG-II: Protein kinase G-II.
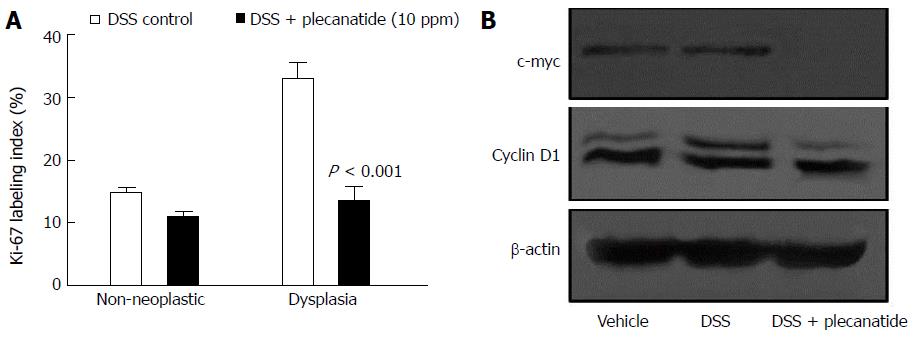
Figure 4 Effect of plecanatide on markers of proliferation in colonic epithelial cells from Apc+/Min-FCCC mice with dextran sodium sulfate-induced inflammation.
A: Normal (non-neoplastic) and neoplastic colon tissues from mice treated with DSS only and DSS + plecanatide (10 ppm) were stained with antibodies specific for Ki-67. Nuclear staining of Ki-67 (positive) was recorded as a labeling index (number of positive cells/total number of cells evaluated; mean ± SEM). Statistical comparisons between DSS control and DSS plus plecanatide-treated groups (n = 7-9 mice per group) were performed using the Student t test. A P value ≤ 0.05 was considered significant; B: Colon tissue (1 cm) from 6 animals per group was pooled to prepare cell lysates. A representative immunoblot demonstrating the effect of plecanatide on expression of c-Myc and cyclin D1 is shown. β-actin was used to normalize protein loading. DSS: Dextran sodium sulfate.
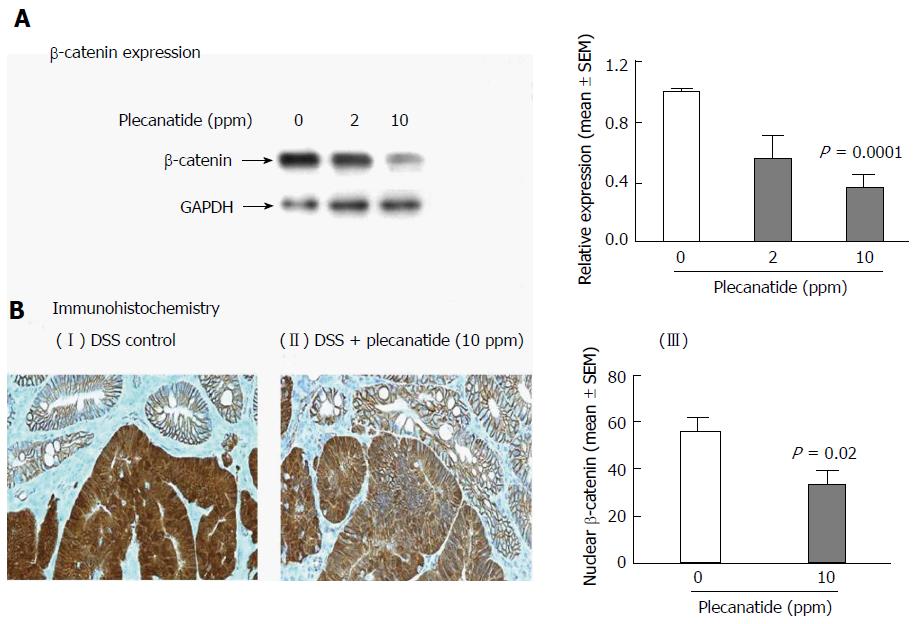
Figure 5 Total β-catenin expression is reduced within the colon of Apc+/Min-FCCC mice treated with dextran sodium sulfate plus plecanatide.
A: Western blot analysis and the associated densitometric quantification of levels of total β-catenin expression (mean ± SEM) within the colon; B: Immunohistochemical localization of β-catenin within the colonic mucosa. Membranous localization of β-catenin was observed within the normal colonic mucosa irrespective of the treatment group, while cytoplasmic and nuclear β-catenin staining predominant in adenomas from DSS-treated mice (panel I). Plecanatide treatment caused a significant reduction in nuclear staining of β-catenin in dysplasias, while the cell membranes exhibited enhanced protein localization (panel II). The number of tumor cells with nuclear localization of β-catenin was counted in distal colon tumors (n = 7-9 mice/group) and expressed as a percentage of the total number of tumor cells per 400 X field (panel III). Statistical comparisons between DSS control and DSS plus plecanatide-treated groups were performed using the Student’s t test. A P value of ≤ 0.05 was considered significant. DSS: Dextran sodium sulfate; GAPDH: Glyceraldehyde 3-phosphate dehydrogenase; .
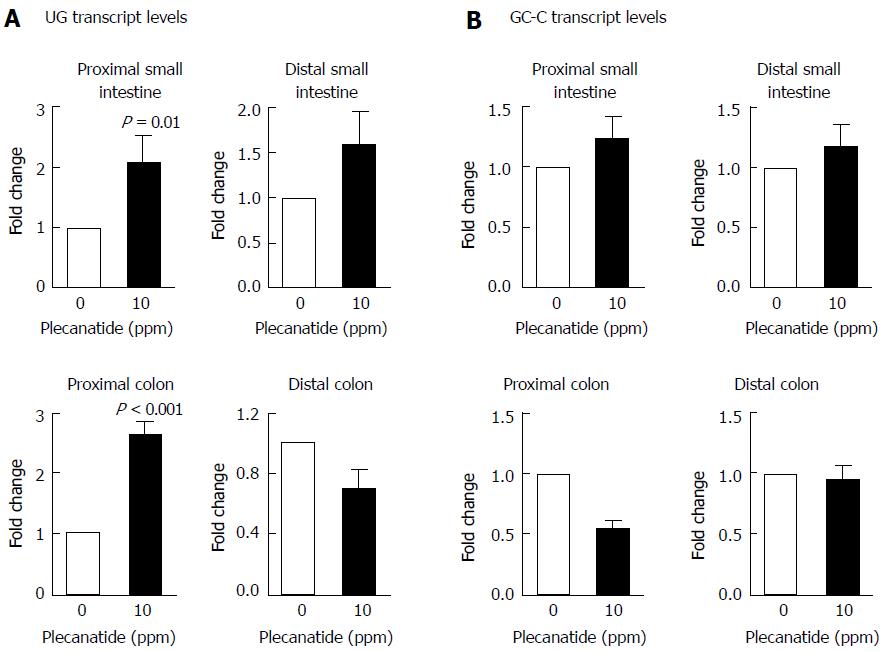
Figure 6 Effect of plecanatide on expression of uroguanylin and guanylate cyclase-C.
The relative levels of UG (A) and GC-C (B) transcripts in the small intestine and colon of DSS-treated and DSS + plecanatide treated Apc+/Min-FCCC mice (n = 5-6/group) were determined by quantitative RT-PCR and normalized to those of GAPDH in the same sample. Transcript levels are expressed as fold change (mean ± SEM) as compared to control samples treated with only DSS. Student’s t-test was used to evaluate statistical differences between DSS control and plecanatide-treated mice. A P value of ≤ 0.05 was considered significant. GC-C: Guanylate cyclase-C; UG: Uroguanylin; DSS: Dextran sodium sulfate.
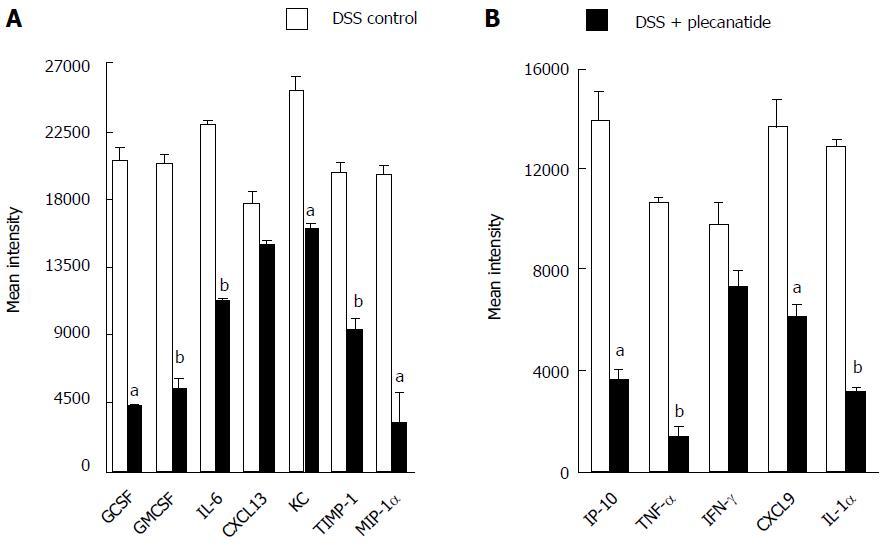
Figure 7 Effect of plecanatide on cytokine expression.
Expression of cytokines, chemokines and growth factors was measured in the spent media of colonic explant cultures derived from mice treated with DSS only or DSS + plecanatide. Murine cytokines, chemokines and growth factors were measured in pooled supernatants (n = 6/pool) using membranes coated with specific capture antibodies (Proteome Profiler Panel A kit; R and D Systems, Minneapolis, MN). Immunoblots were scanned using Image J software. The data represent the mean intensity of cytokine/chemokine levels in colonic samples derived from untreated and plecanatide-treated mice. Student’s t test was used to evaluate statistical differences in the secretion of cytokines/chemokines between DSS control and DSS + plecanatide treated samples. aP value ≤ 0.05, bP≤ 0.01; vs DSS control.
- Citation: Chang WCL, Masih S, Thadi A, Patwa V, Joshi A, Cooper HS, Palejwala VA, Clapper ML, Shailubhai K. Plecanatide-mediated activation of guanylate cyclase-C suppresses inflammation-induced colorectal carcinogenesis in Apc+/Min-FCCC mice. World J Gastrointest Pharmacol Ther 2017; 8(1): 47-59
- URL: https://www.wjgnet.com/2150-5349/full/v8/i1/47.htm
- DOI: https://dx.doi.org/10.4292/wjgpt.v8.i1.47


