Copyright
©The Author(s) 2016.
World J Gastrointest Pharmacol Ther. May 6, 2016; 7(2): 294-305
Published online May 6, 2016. doi: 10.4292/wjgpt.v7.i2.294
Published online May 6, 2016. doi: 10.4292/wjgpt.v7.i2.294
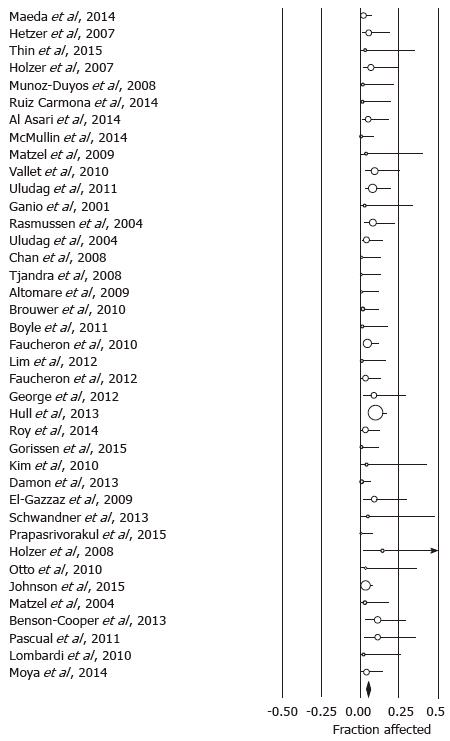
Figure 1 Forrest plot showing infection rates as fraction of the sample size in cohorts treated with sacral neurostimulation for fecal incontinence.
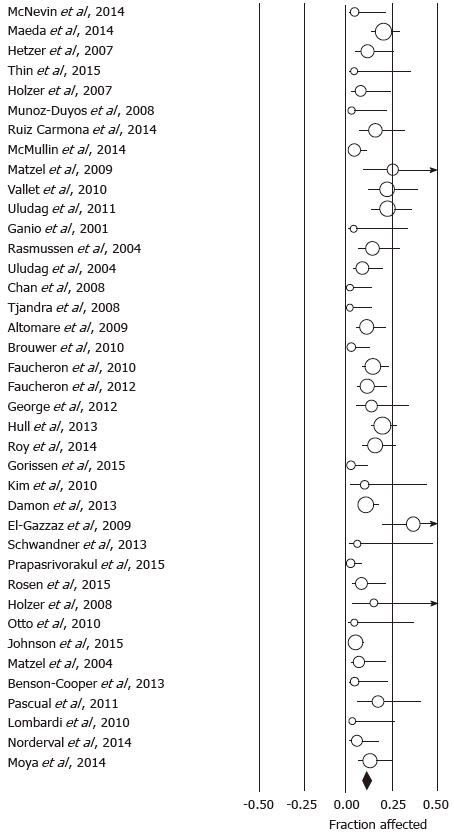
Figure 2 Forrest plot showing explant rates as fraction of the sample size in cohorts treated with sacral neurostimulation for fecal incontinence.
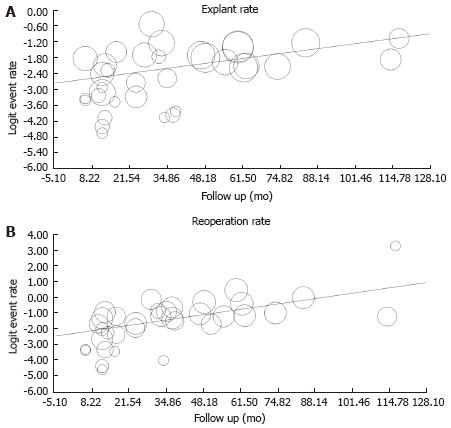
Figure 3 Meta-regression showing the time dependent increase in explant.
A: Q = 9.35; P = 0.002 and reoperation panel; B: Q = 20.3; P < 0.001 rates after sacral neurostimulation initiation.
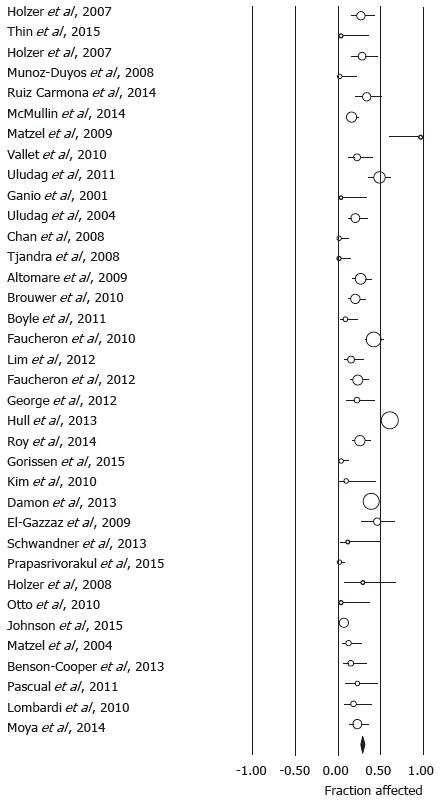
Figure 4 Forrest plot showing reoperation rates as fraction of the sample size in cohorts treated with sacral neurostimulation for fecal incontinence.
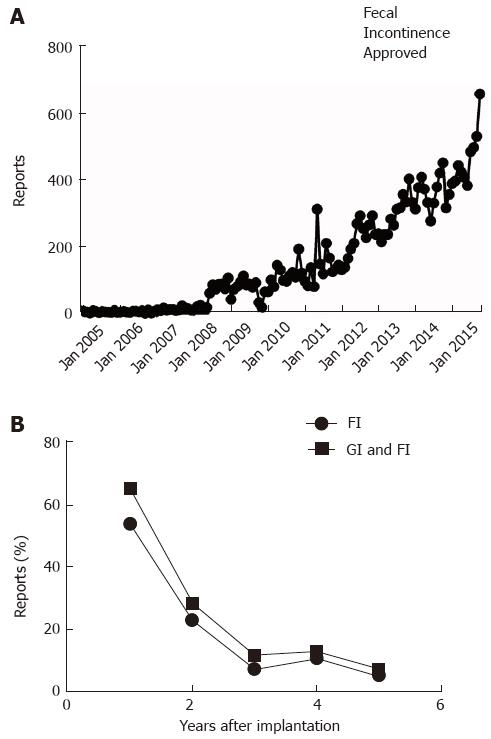
Figure 5 Manufacturer and user device experience databank.
A: Reports about adverse events related to therapy with Interstim are plotted as a function of month of posting by the Federal Drug Administration; B: The lower panel depicts the percentage of reports mentioning gastrointestinal problems (squares) or specifically fecal incontinence (circles) as indication for sacral neurostimulation.
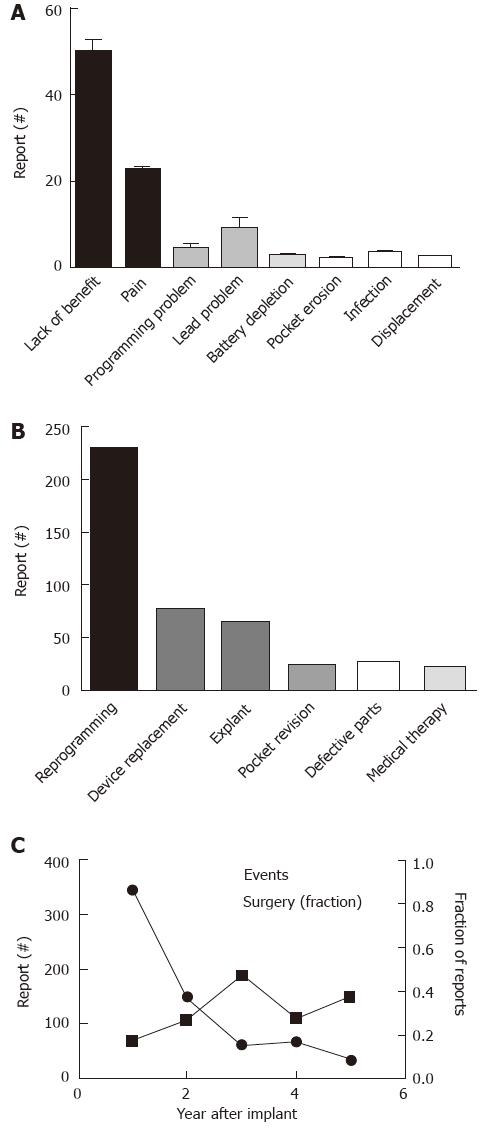
Figure 6 Concerns and interventions related to Interstim treatment and described in manufacturer and user device experience.
A: Depicts the number of reported events sorted based on the primary concerns; B: Shows the main corrective steps taken (“Defective Parts” refers to intra-operative problems with device components requiring exchange); C: The proportions of operatively treated interventions is plotted in relation to the overall number of reported adverse events.
- Citation: Bielefeldt K. Adverse events of sacral neuromodulation for fecal incontinence reported to the federal drug administration. World J Gastrointest Pharmacol Ther 2016; 7(2): 294-305
- URL: https://www.wjgnet.com/2150-5349/full/v7/i2/294.htm
- DOI: https://dx.doi.org/10.4292/wjgpt.v7.i2.294


