Copyright
©The Author(s) 2016.
World J Gastrointest Pharmacol Ther. May 6, 2016; 7(2): 242-253
Published online May 6, 2016. doi: 10.4292/wjgpt.v7.i2.242
Published online May 6, 2016. doi: 10.4292/wjgpt.v7.i2.242
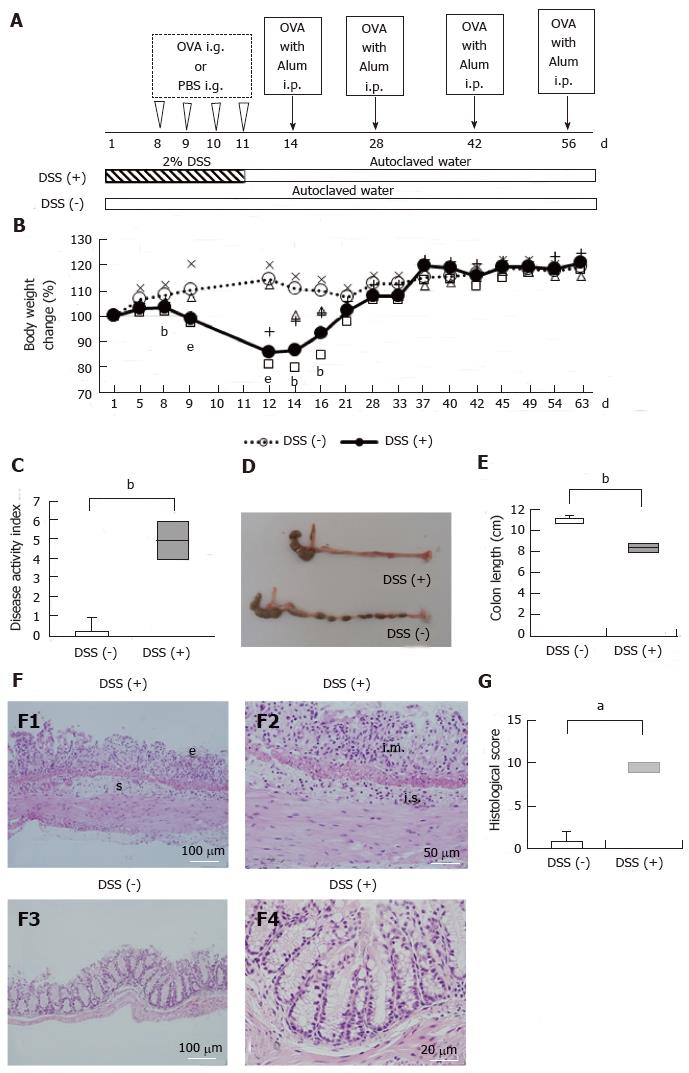
Figure 1 Administration of dextran sulfate sodium to induce colitis.
A: Experimental design for the induction of oral tolerance and dextran sulfate sodium (DSS) colitis; B: Percent changes in the body weights of mice that received 2% DSS [DSS (+) mice] and mice that received autoclaved water (control mice). The body weights of the DSS (+) mice (median: Closed circles, first quartile: Plus, third quartile: Open box) were significantly lower than those of the control mice (median: Open circles, first quartile: X-mark, third quartile: Open triangle) from day 8 to day 16; C: Disease activity index (DAI) for the DSS (+) mice and the control mice on day 12. The DAI of the DSS (+) mice (closed bar) was significantly increased compared to that of the control mice (open bar); D: A representative image of colons collected from the DSS (+) mice and the control mice on day 8. The median colon length in the DSS (+) mice was shorter than that in the control mice; E: Colon lengths for the DSS (+) mice and the control mice on day 8. On day 8, the median colon length for the DSS (+) mice (closed bar) was significantly shorter than that for the control mice (open bar); F: Representative hematoxylin and eosin staining of colon sections. On day 8, the colons were removed, fixed in 10% buffered formalin, embedded in paraffin, cut into sections, and stained with hematoxylin and eosin. The DSS (+) mice showed pathological changes characterized by epithelial defects, submucosal edema (F1) and inflammatory cell infiltration in the mucosal layer and submucosal layer (F2). The control mice showed minimal chronic inflammatory cells in the lamina propria with regularly spaced crypts and did not show epithelial defects or submucosal edema (F3, F4); G: Histological scores for the DSS (+) mice and the control mice on day 8. The DSS (+) mice (closed bar) had significantly higher histological scores than the control mice (open bar). The data are shown as the median and interquartile range of three to six mice per group. aP < 0.05, bP < 0.01, eP < 0.001. e: Epithelial; s: Submucosal edema; i.m.: Inflammatory cell infiltration in the mucosal layer; i.s.: Inflammatory cell infiltration in the submucosal layer.
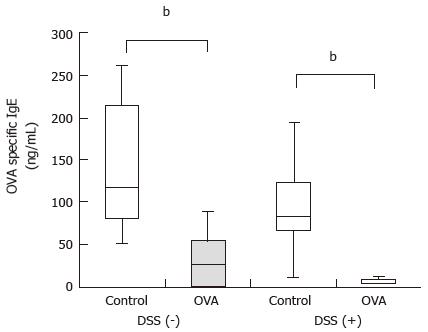
Figure 2 Ovalbumin-specific IgE concentrations in the sera of mice with and without dextran sulfate sodium colitis.
On day 63, serum OVA-specific immunoglobulin E (IgE) concentrations were measured by ELISA. The mice that were i.g. administered OVA exhibited significantly lower OVA-specific IgE concentrations (closed bar) than the control mice (open bar) both in the presence and absence of DSS colitis. All results represent at least two independent experiments with four to six mice in each group. The data are shown as the median and interquartile range. bP < 0.01. OVA: Ovalbumin; DSS: Dextran sulfate sodium; ELISA: Enzyme-linked immuno sorbent assay; i.g.: Intragastrically.
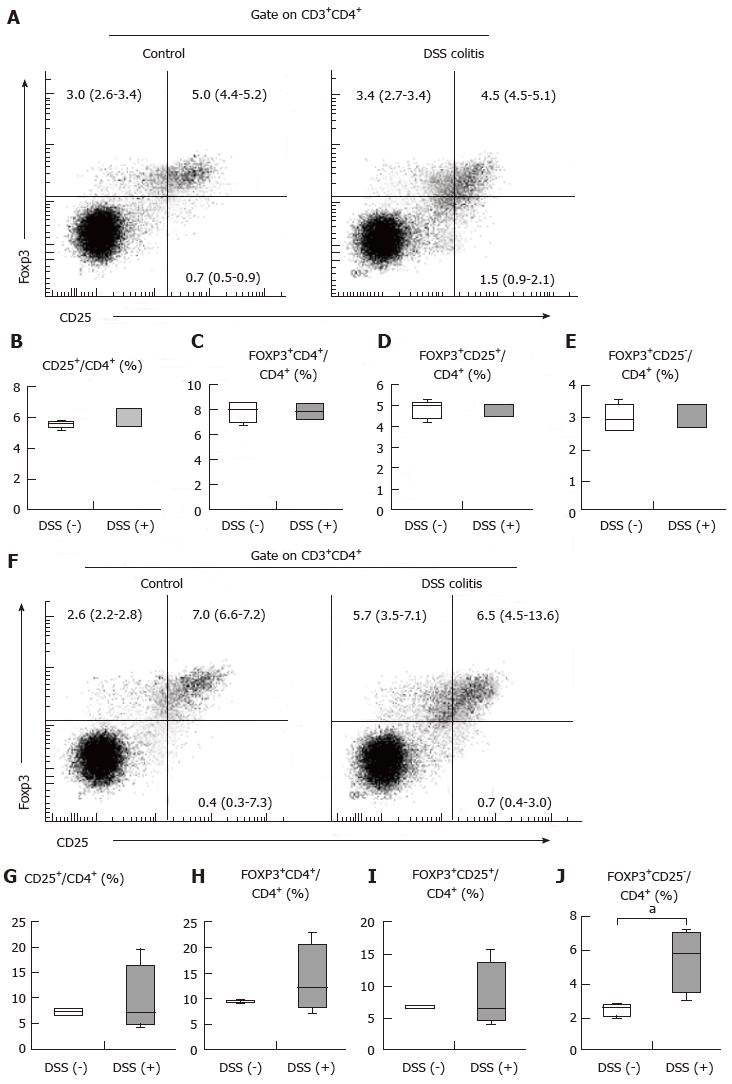
Figure 3 Regulatory T cell frequencies in the spleen and mesenteric lymph nodes as determined by flow cytometry.
A: Analysis of CD25 and Foxp3 expression in the spleen. Representative data are shown for control mice (left panel) and DSS colitis mice (right panel); B: CD4+CD25+ cell frequencies in the spleens of DSS colitis mice and control mice. CD4+CD25+ cell frequency tended to increase in the spleens of DSS colitis mice (closed bar) compared to those of control mice (open bar); C: CD4+Foxp3+ cell frequencies in the spleens of DSS colitis mice and control mice. CD4+Foxp3+ cell frequency was comparable in the spleens of DSS colitis mice (closed bar) and control mice (open bar); D: CD4+CD25+Foxp3+ cell frequencies in the spleens of DSS colitis mice and control mice. CD4+CD25+Foxp3+ cell frequency was comparable in the spleens of DSS colitis mice (closed bar) and control mice (open bar); E: CD4+CD25-Foxp3+ cell frequencies in the spleens of DSS colitis mice and control mice. CD4+CD25-Foxp3+ cell frequency was comparable in the spleens of DSS colitis mice (closed bar) and control mice (open bar); F: Analysis of CD25 and Foxp3 expression in the MLN. Representative data are shown for control mice (left panel) and DSS colitis mice (right panel); G: CD4+CD25+ cell frequencies in the MLNs of DSS colitis and control mice. CD4+CD25+ cell frequency was comparable in the MLNs of DSS colitis mice (closed bar) and control mice (open bar); H: CD4+Foxp3+ cell frequencies in the MLNs of DSS colitis mice and control mice. CD4+Foxp3+ cell frequency tended to increase in the MLNs of DSS colitis mice (closed bar) compared with control mice (open bar); I: CD4+CD25+Foxp3+ cell frequencies in the MLNs of DSS colitis mice and control mice. CD4+CD25+Foxp3+ cell frequency was comparable in the MLNs of DSS colitis mice (closed bar) and control mice (open bar); J: CD4+CD25-Foxp3+ cell frequencies in the MLNs of DSS colitis mice and control mice. CD4+CD25-Foxp3+ cell frequency was significantly higher in the MLNs of DSS colitis mice (closed bar) compared with control mice (open bar). All results represent at least two independent experiments with four to six mice in each group. The data are shown as the median and interquartile range. aP < 0.05. MLN: Mesenteric lymph nodes; DSS: Dextran sulfate sodium.
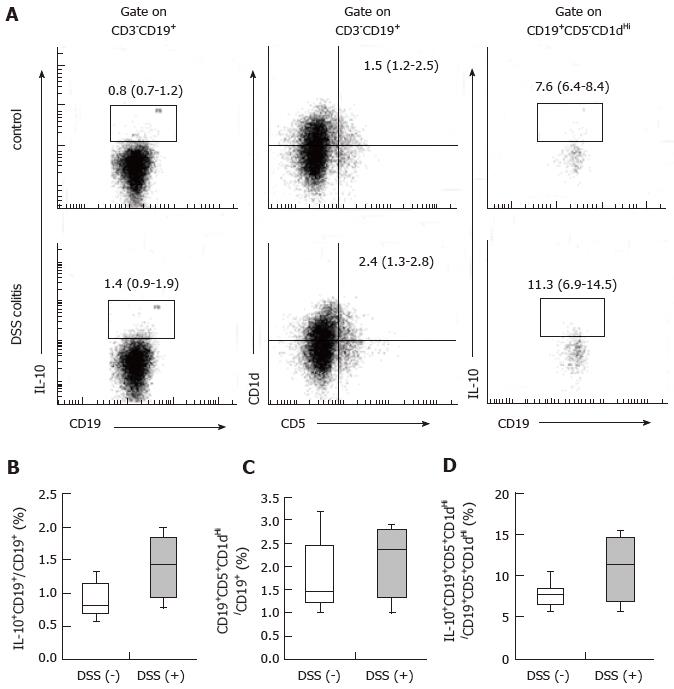
Figure 4 Regulatory B cell frequency in the spleen as determined by flow cytometry.
A: Analysis of CD19+IL-10+ cell populations (left panel), CD19+CD5+CD1dHi cell populations (center panel) and CD19+CD5+CD1dHiIL-10+ cell populations (right panel) in the spleen based on flow cytometry. Representative data are shown for control mice (top panel) and DSS colitis mice (bottom panel); B: CD19+IL-10+ cell frequencies among CD19+ cells in the spleens of DSS colitis mice and control mice. CD19+IL-10+ cell frequency among CD19+ cells was comparable in the spleens of DSS mice (closed bar) and control mice (open bar); C: CD19+CD5+CD1dHi cell frequencies among CD19+ cells in the spleens of DSS colitis mice and control mice. CD19+CD5+CD1dHi cell frequency among CD19+ cells was comparable in the spleens of DSS mice (closed bar) and control mice (open bar); D: IL-10+ cell frequencies among CD19+CD5+CD1dHi cell populations in the spleens of DSS colitis mice and control mice. IL-10+ cell frequency among the CD19+CD5+CD1dHi cell population tended to increase in the spleens of the DSS mice (closed bar) compared with those of the control mice (open bar). All results represent at least two independent experiments with four to six mice in each group. The data are shown as the median and interquartile range. DSS: Dextran sulfate sodium; IL: Interleukin.
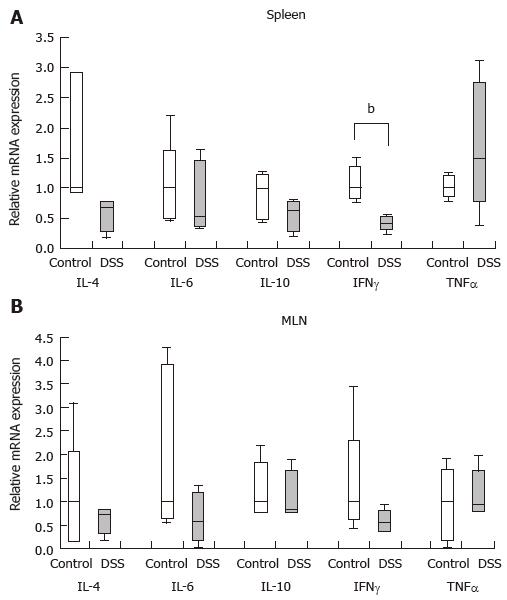
Figure 5 Evaluation of cytokine mRNA expression in the spleen and mesenteric lymph nodes during colitis.
A: Evaluation of cytokine mRNA expression in the spleen during colitis. IFN-γ mRNA expression was significantly lower in the spleens of mice with colitis compared to those of mice without colitis. There were no significant differences in IL-4, IL-6, IL-10 or TNF-α mRNA expression; B: Evaluation of cytokine mRNA expression in the MLN in mice with colitis. In the MLN, there was no significant difference in IL-4, IL-6, IL-10, IFN-γ, or TNF-α expression between mice with and without colitis. Expression values were normalized to the expression of the housekeeping gene GAPDH. All results represent at least two independent experiments with four to six mice in each group. The data are shown as the median and interquartile range. bP < 0.01. MLN: Mesenteric lymph nodes; DSS: Dextran sulfate sodium; TNF: Tumor necrosis factor; IFN: Interferon; IL: Interleukin.
- Citation: Ino S, Kohda C, Takeshima K, Ishikawa H, Norose T, Yamochi T, Takimoto M, Takahashi H, Tanaka K. Oral tolerance is inducible during active dextran sulfate sodium-induced colitis. World J Gastrointest Pharmacol Ther 2016; 7(2): 242-253
- URL: https://www.wjgnet.com/2150-5349/full/v7/i2/242.htm
- DOI: https://dx.doi.org/10.4292/wjgpt.v7.i2.242


