Copyright
©The Author(s) 2015.
World J Gastrointest Pharmacol Ther. Nov 6, 2015; 6(4): 253-256
Published online Nov 6, 2015. doi: 10.4292/wjgpt.v6.i4.253
Published online Nov 6, 2015. doi: 10.4292/wjgpt.v6.i4.253
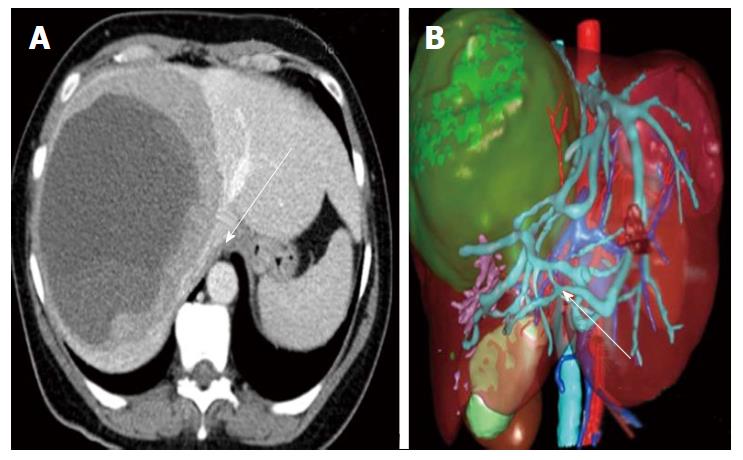
Figure 1 Preoperative three-dimensional computed tomography reconstructed from conventional two-dimensional computed tomography; the tumor is represented in green.
A: Compression of the right and middle hepatic veins (arrow); B: Venous intrahepatic shunt (arrow).
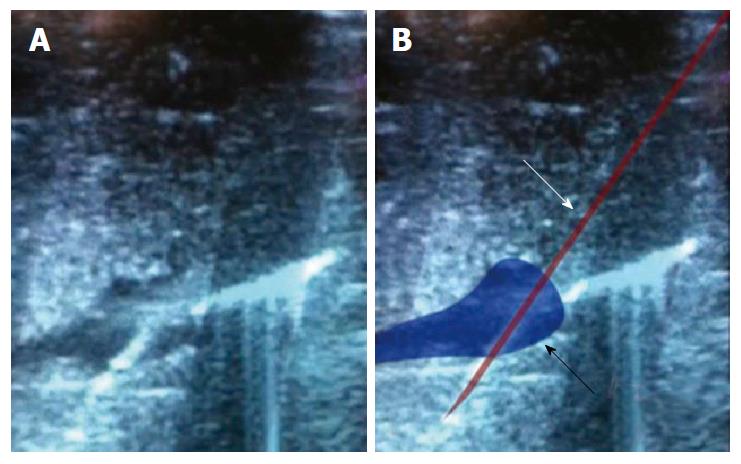
Figure 2 Intrahepatic venovenous shunt and insertion of the microwave needle.
A: Ultrasound view of the intrahepatic venovenous shunt with insertion of the microwave needle; B: Diagram showing in blue the intrahepatic venovenous shunt (black arrow) and in red the microwave needle (white arrow).
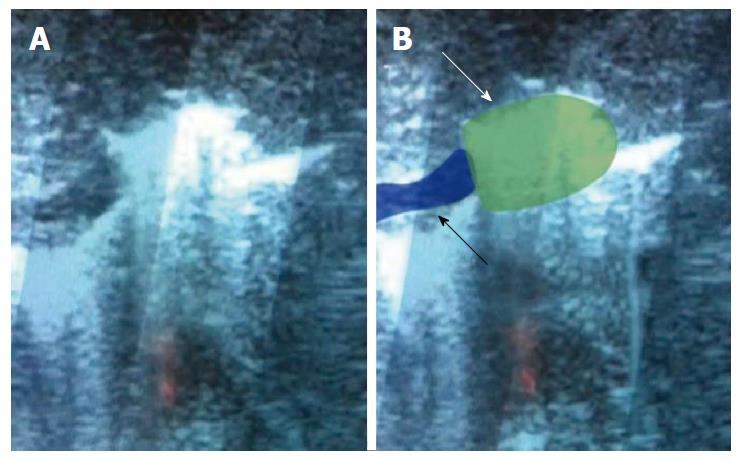
Figure 3 Thrombus at the end of the procedure.
A: Ultrasound view of the thrombus at the end of the procedure; B: Diagram showing in blue the intrahepatic venovenous shunt (black arrow) and in green the thrombus (white arrow).
- Citation: Delhorme JB, Méméo R, Marescaux J, Pessaux P. Preoperative detection of intrahepatic venovenous shunt treated by microwave precoagulation during right hepatectomy. World J Gastrointest Pharmacol Ther 2015; 6(4): 253-256
- URL: https://www.wjgnet.com/2150-5349/full/v6/i4/253.htm
- DOI: https://dx.doi.org/10.4292/wjgpt.v6.i4.253


