Copyright
©The Author(s) 2015.
World J Gastrointest Pharmacol Ther. Nov 6, 2015; 6(4): 213-222
Published online Nov 6, 2015. doi: 10.4292/wjgpt.v6.i4.213
Published online Nov 6, 2015. doi: 10.4292/wjgpt.v6.i4.213
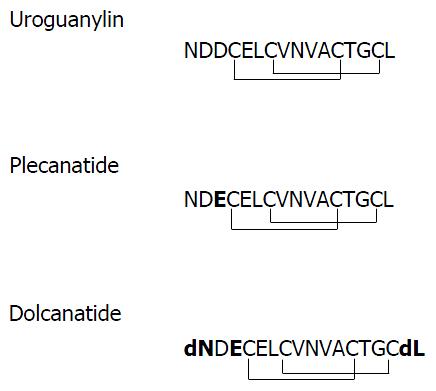
Figure 1 Primary structures of uroguanylin, plecanatide, and dolcanatide.
Single-letter abbreviations for amino acids are depicted. Plecanatide is similar to UG except for the substitution of aspartic acid (D) at position 3 from the N-terminus of UG with glutamic acid (E). The structure of dolcanatide is similar to plecanatide except that the amino acids at both termini are replaced with their respective D-stereoisomers. Uroguanylin as well as its analogs have four cysteines (C) enabling the formation of two intramolecular disulfide bonds. Substituted amino acids in plecanatide and dolcanatide are shown in bold type. UG: Uroguanylin.
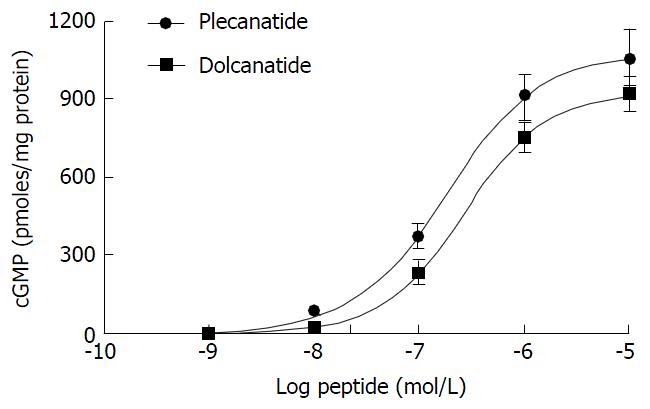
Figure 2 Plecanatide and dolcanatide mediated stimulation of cyclic guanosine monophosphate production in T84 cells.
The potency of plecanatide and dolcanatide to stimulate cGMP production was evaluated using the T84 cell bioassay (see Materials and Methods). The data presented are an average of three determinations and are expressed as pmoles cGMP/mg protein ± SD. cGMP: Cyclic guanosine monophosphate.
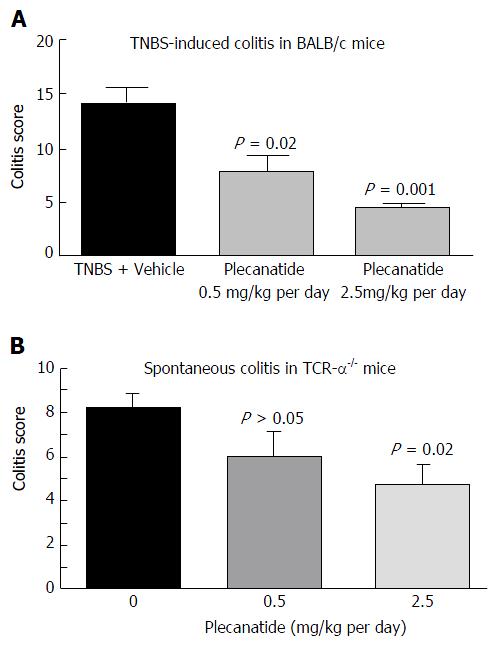
Figure 3 Oral treatment with plecanatide ameliorates colitis in acute and chronic mouse models.
A: Acute colitis examined in BALB/c mice (n = 5-8/group) was induced by rectal instillation of TNBS. Mice were administered an oral gavage of vehicle or plecanatide (0.5 and 2.5 mg/kg per day) starting on 0 d; animals were euthanized on 7th day and colitis scores were determined; B: TCRα-/- mice, a model for chronic spontaneous colitis, were administered an oral gavage of plecanatide (0.5 and 2.5 mg/kg) or vehicle for 14 d. At the end of the study, colon tissues were harvested and used for histopathological analysis to assess colitis. Results are depicted as mean colitis score ± SD. TCRα: T-cell receptor alpha; TNBS: 2, 4, 6-trinitrobenzenesulfonic acid sol.
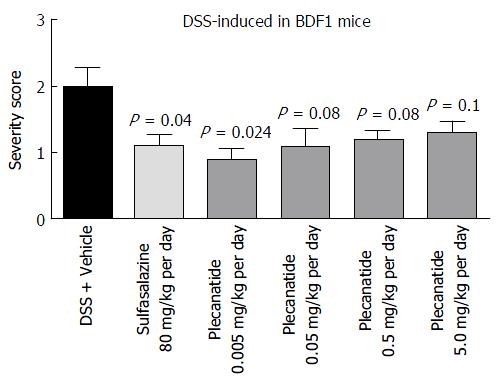
Figure 4 Oral treatment with plecanatide ameliorates gastrointestinal inflammation in the dextran sulfate sodium-induced colitis in BDF1 mice.
BDF1 mice (n = 8/group) were administered 5% DSS in drinking water. An oral gavage was administered once daily containing 0.005 to 5.0 mg/kg of plecanatide beginning a day prior to initiating DSS regimen. Sulfasalazine (80 mg/kg) and vehicle (phosphate buffer) served as positive and negative controls, respectively. At the end of the study mice were euthanized; distal sections of the colon were fixed, embedded in paraffin, sectioned, stained with H and E and visualized to assign colitis severity scores. All slides were scored in a blinded manner. The mean histological severity of colitis score ± SEM was plotted for the indicated treatment groups. Statistical significance was calculated by comparing severity scores observed for the plecanatide or sulfasalazine treated group vs corresponding values in the vehicle treated group. DSS: Dextran sulfate sodium; SEM: Standard error of the mean.
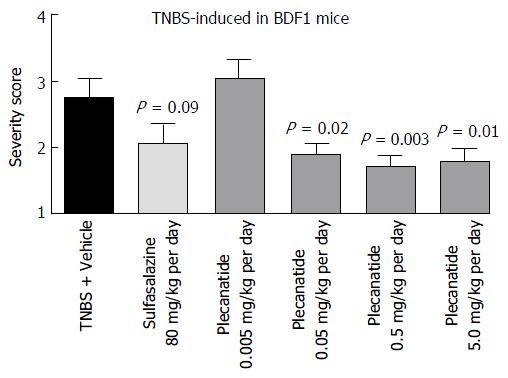
Figure 5 Oral treatment with plecanatide ameliorates gastrointestinal inflammation in 2, 4, 6-trinitrobenzenesulfonic acid-induced colitis in BDF1 mice.
BDF1 mice (n = 10/group) were administered TNBS via rectal instillation on 0 d as described under Materials and Methods. An oral gavage was administered once daily containing 0.005 to 5.0 mg/kg plecanatide beginning a day prior to TNBS treatment. Sulfasalazine (80 mg/kg) and vehicle (phosphate buffer) served as positive and negative controls, respectively. At the end of the study mice were euthanized; distal sections of the colon were fixed, embedded in paraffin, sectioned, stained with H and E and visualized to assign colitis severity scores. All slides were scored in a blinded manner. The mean histological severity of the colitis score ± SEM was plotted for the indicated treatment groups. Statistical significance was calculated by comparing the severity score observed for the plecanatide or sulfasalazine-treated group vs the corresponding values in the vehicle-treated group. TNBS: 2, 4, 6-trinitrobenzenesulfonic acid sol; SEM: Standard error of the mean.
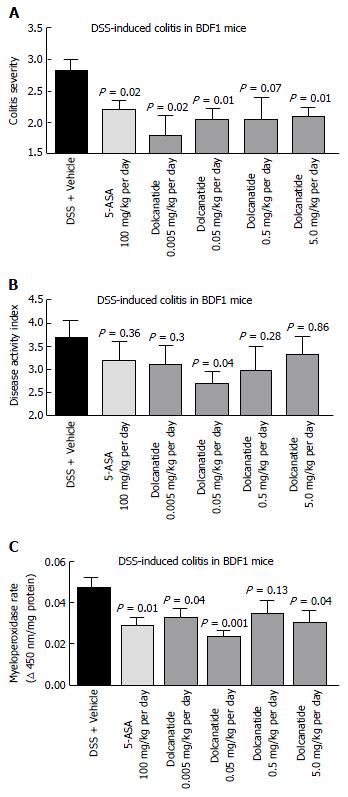
Figure 6 Oral treatment with dolcanatide ameliorates gastrointestinal inflammation in the dextran sulfate sodium induced colitis in BDF1 mice.
BDF1 mice (n = 8-10/group) were administered 5% DSS in drinking water to induce colitis. Dolcanatide was administered via oral gavage beginning a day before initiating the DSS regimen. Oral gavage with 5-ASA (100 mg/kg) and vehicle (phosphate buffer) served as positive and negative controls, respectively. At the end of the study, mice were euthanized and colon tissues were removed for histopathological analyses (see Materials and Methods section). Additional groups of mice were treated under identical conditions for measurement of MPO activity in colon tissues. The Figure depicts results for colitis severity (A), disease activity index (B), and MPO activity (C). Data represent mean ± SEM for each group. Statistical significance was calculated by comparing the values observed for the dolcanatide or 5-ASA-treated group vs the corresponding scores for the vehicle-treated group. DSS: Dextran sulfate sodium; GI: Gastrointestinal; MPO: Myeloperoxidase; SEM: Standard error of the mean; 5-ASA: 5-amino salicylic acid.
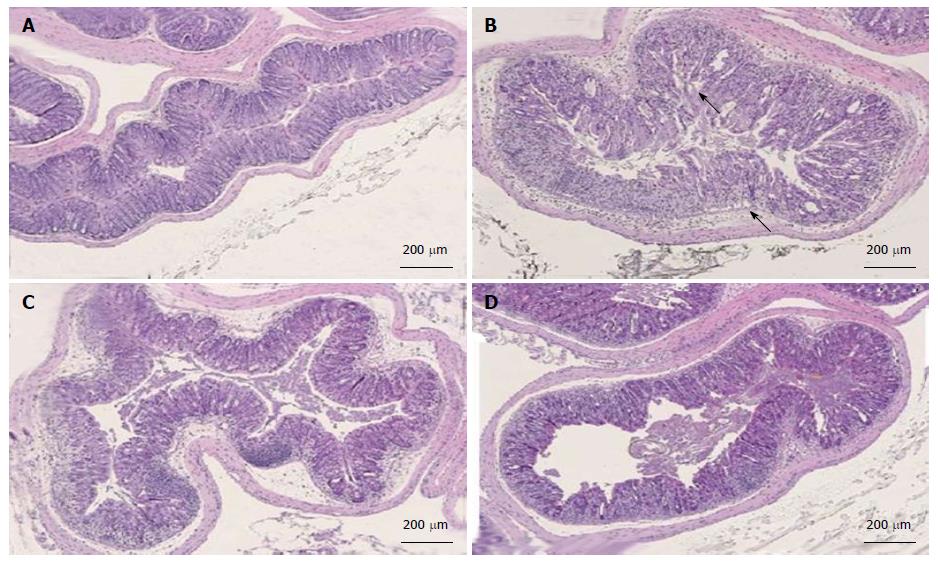
Figure 7 Histopathology analysis of colon tissues after treatment with dolcanatide.
Representative histopathological images of the large bowel from the DSS-induced colitis study are depicted. Criteria for scoring colitis severity were as described under Materials and Methods. A: Untreated naïve mice, histopathology score = 0; B: DSS + vehicle treated, histopathology score = 3; C: DSS + dolcanatide (0.05 mg/kg), histopathology score = 2; D: DSS + 5-ASA (100 mg/kg), histopathology score = 2. Arrows in panel B indicate morphological deterioration in crypts and villi of GI mucosa. DSS: Dextran sulfate sodium; 5-ASA: 5-amino salicylic acid; GI: Gastrointestinal.
- Citation: Shailubhai K, Palejwala V, Arjunan KP, Saykhedkar S, Nefsky B, Foss JA, Comiskey S, Jacob GS, Plevy SE. Plecanatide and dolcanatide, novel guanylate cyclase-C agonists, ameliorate gastrointestinal inflammation in experimental models of murine colitis. World J Gastrointest Pharmacol Ther 2015; 6(4): 213-222
- URL: https://www.wjgnet.com/2150-5349/full/v6/i4/213.htm
- DOI: https://dx.doi.org/10.4292/wjgpt.v6.i4.213


