Copyright
©The Author(s) 2015.
World J Gastrointest Pharmacol Ther. Aug 6, 2015; 6(3): 73-83
Published online Aug 6, 2015. doi: 10.4292/wjgpt.v6.i3.73
Published online Aug 6, 2015. doi: 10.4292/wjgpt.v6.i3.73
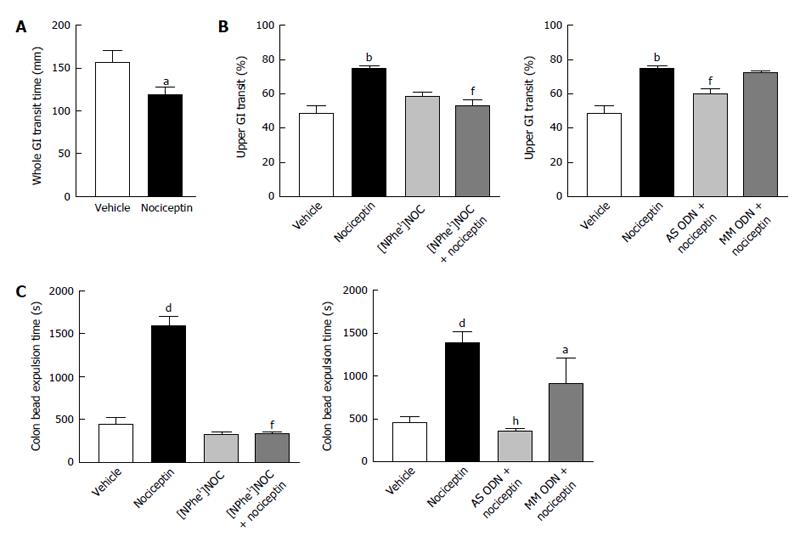
Figure 1 In vivo effects of nociceptin in the gastrointestinal tract in mice.
A: Nociceptin (100 pmol, iv) accelerated whole gastrointestinal transit; B: Nociceptin (100 pmol, iv) accelerated upper gastrointestinal transit. This effect was absent in animals pretreated with [NPhe1]NOC (100 pmol, iv) at a dose that had no effects when given alone and in the AS ODN-treated mice; C: Nociceptin (100 pmol, iv) slowed colonic bead expulsion. This effect was absent in animals pretreated with [NPhe1]NOC (100 pmol, iv) at a dose that had no effects when given alone and in the AS ODN-treated mice. Data are mean ± SEM of n = 5-8 mice/group. aP < 0.05, bP < 0.01, dP < 0.001, vs vehicle-treated mice; fP < 0.01, hP < 0.001 vs nociceptin alone. AS and MM ODN, antisense and mismatched deoxynucleotide, respectively. GI: Gastrointestinal; iv: Intravenous.
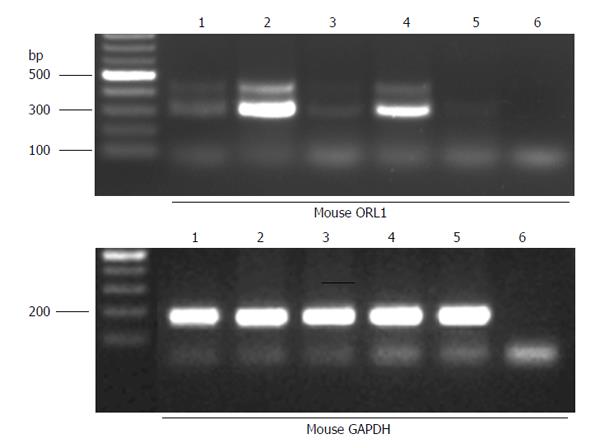
Figure 2 A representative gel for reverse transcriptase - polymerase chain reaction for opioid-receptor like-1 using total RNA.
Two alternatively spliced mRNA variants of mouse opioid-receptor like-1 (ORL1) with a size of approximately 320 and 400 bp are expressed in mouse brain (lane 1), longitudinal muscle-myenteric plexus layer (LMMP) (lane 2) and mucosa (lane 3) of mouse ileum and in LMMP (lane 4) of mouse colon. In the mucosa of mouse colon, only the short ORL1 isoform is present (lane 5), whereas the negative control (lane 6) showed no specific polymerase chain reaction product. Lower panel shows results for GAPDH, which was used as internal control. GAPDH: Glyceraldehyde 3-phosphate dehydrogenase.
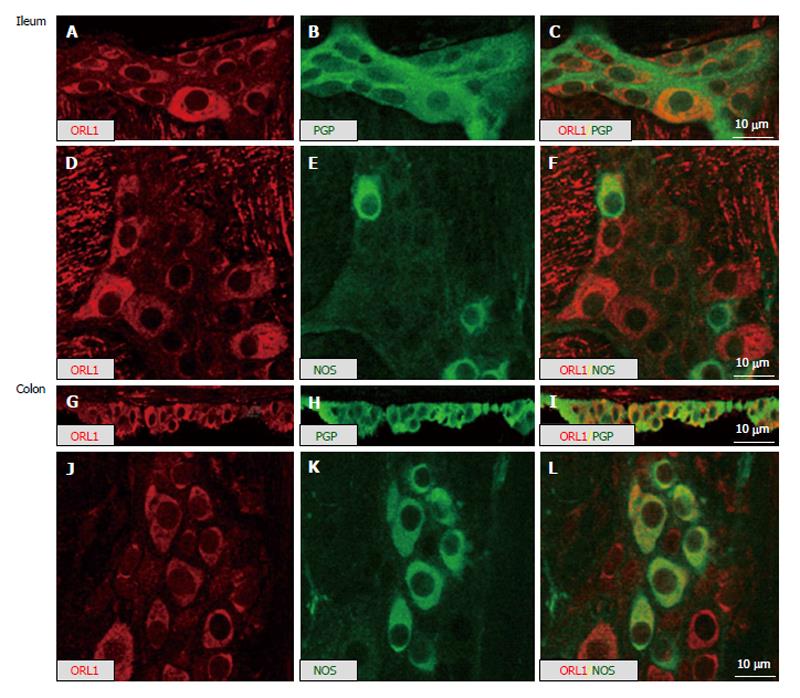
Figure 3 Double-labeling of myenteric plexus whole-mount preparations (A-F; J-L) and cryosections (G-I) of mouse ileum (A-F) and mouse colon (G-L) demonstrating co-labeling in myenteric neurons of opioid-receptor like-1 immunoreactivity with the neuron-endocrine marker protein gene product 9.
5 or nitric oxide synthase. ORL1: Opioid-receptor like-1; NOS: Nitric oxide synthase; PGP: Protein gene product.
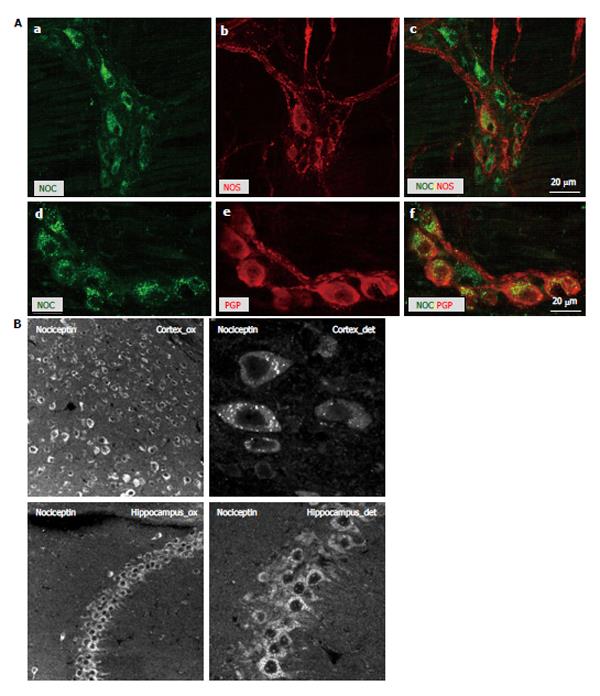
Figure 4 Double-labeling of myenteric plexus whole-mount preparations with nociception, nitric oxide synthase and neuron-endocrine marker protein gene product 9.
5 immunoreactivity. A: Double-labeling of myenteric plexus whole-mount preparations of mouse colon demonstrating co-labeling in myenteric neurons of nociceptin (NOC) immunoreactivity with nitric oxide synthase (NOS) (A-C) and the neuron-endocrine marker protein gene product 9.5 (PGP9.5) (D-F); B: A granular appearance of the nociceptin staining in the myenteric neurons was also observed in brain sections, which served as additional controls. Individual immunopositive neurons are recognizable along the entire cortex, be it with slight region-dependent differences in staining intensity. In the hippocampal region also neuronal processes stain for nociceptin. The diffuse distribution of nociceptin corresponds with literature data (see also datasheet Abcam). No other structures apart from neurons appear to be stained.
Figure 5 Effect of nociceptin (1 nmol/L-10 μmol/L) on electrically induced junction potentials.
A: EJP, fIJP and sIJP for proximal colon; B: fIJP and sIJP for middle colon; C: IJP for distal colon. The last bar of each set shows the antagonizing effect of [NPhe1]NOC (1 μmol/L). Data are mean ± SEM of n = 5-8. aP < 0.05; bP < 0.01 vs control; cP < 0.05 vs nociceptin alone. EJP: Excitatory junction potentials; IJP: Inhibitory junction potentials; fIJP: Fast IJP; sIJP: Slow IJP.
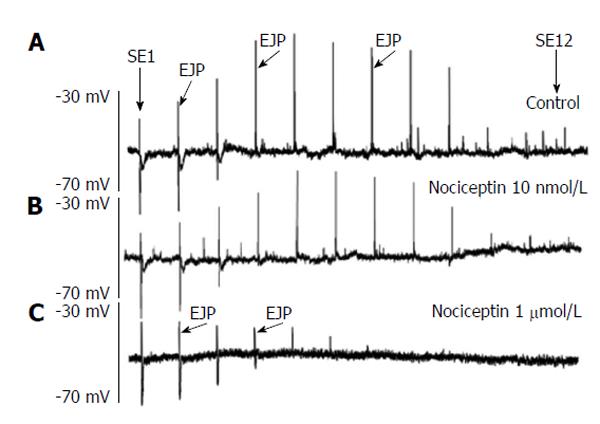
Figure 6 Effect of nociceptin (1 nmol/L, 1 μmol/L) on the spatial distribution of the excitatory junction potentials.
Tracing A shows the spatial distribution of the excitatory junction potentials (EJP) recorded in smooth muscle cells. Stimulation site (SE)1 corresponds to stimulation nearby the recording site, whereas SE12 represents stimulation located 20 mm in anal direction. Thus the original recording shows the spatial distribution of ascending electrophysiological responses following anal stimulation recorded in 1.67 mm intervals. Tracings B and C show the effect of increasing concentrations of nociceptin (10 nmol/L and 1 μm) on the spatial distribution of junction potentials. Note the marked reduction of EJP in a concentration-dependent fashion and the shift of the maximal distance over which an EJP can be recorded.
Figure 7 Effect of nociceptin (1 μmol/L) and [NPhe1]NOC (1 μmol/L) on the spatial distribution of the excitatory junction potentials.
A: A concentration-dependent reduction in excitatory junction potentials (EJP) amplitude at the different stimulation sites induced by nociceptin (10 nmol/L-1 μmol/L). Note that nociceptin caused, besides a reduction in the EJP amplitude, shortening of the distance over which the EJP can be recorded; B: [NPhe1]NOC (1 μmol/L) had no effect on EJPs, but antagonized the effect of nociceptin (1 μmol/L).
- Citation: Sibaev A, Fichna J, Saur D, Yuece B, Timmermans JP, Storr M. Nociceptin effect on intestinal motility depends on opioid-receptor like-1 receptors and nitric oxide synthase co-localization. World J Gastrointest Pharmacol Ther 2015; 6(3): 73-83
- URL: https://www.wjgnet.com/2150-5349/full/v6/i3/73.htm
- DOI: https://dx.doi.org/10.4292/wjgpt.v6.i3.73


