Copyright
©2013 Baishideng Publishing Group Co.
World J Gastrointest Pharmacol Ther. Nov 6, 2013; 4(4): 113-119
Published online Nov 6, 2013. doi: 10.4292/wjgpt.v4.i4.113
Published online Nov 6, 2013. doi: 10.4292/wjgpt.v4.i4.113
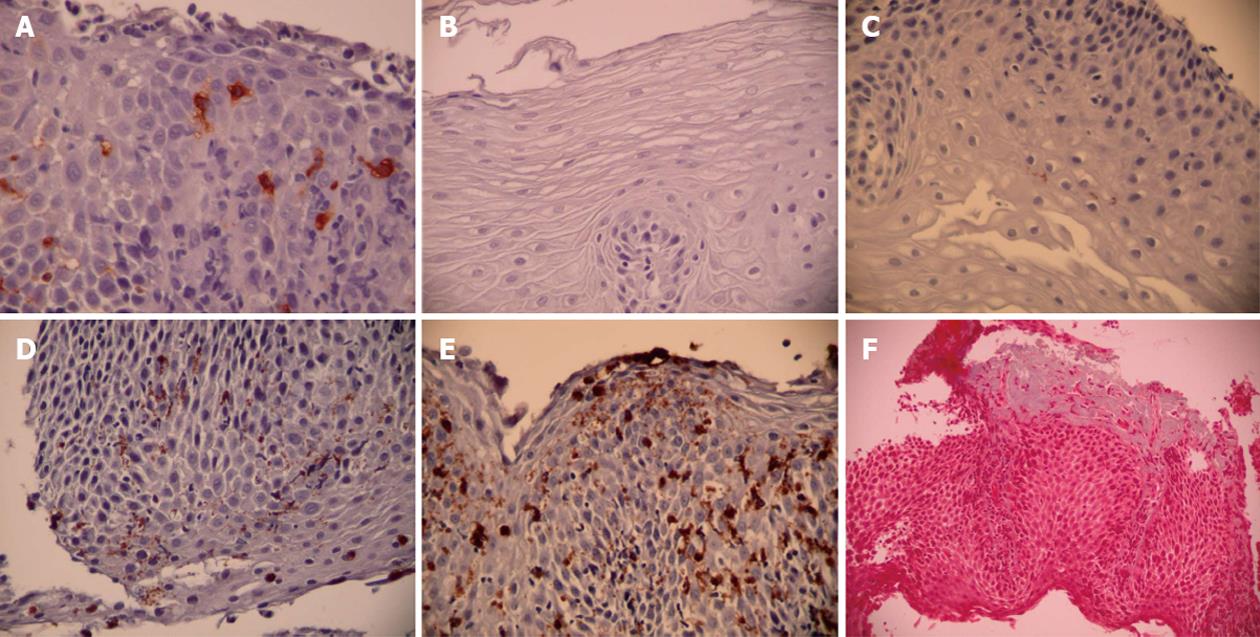
Figure 1 Sample evaluation.
A: Tryptase staining for mast cells; B: Grade 0 major basic protein (MBP) involvement (none); C: Grade 1 MBP involvement (< 5%); D: Grade 2 MBP involvement (5%-25%); E: Grade 3 MBP involvement (> 25%); F: Trichrome staining for fibrosis.
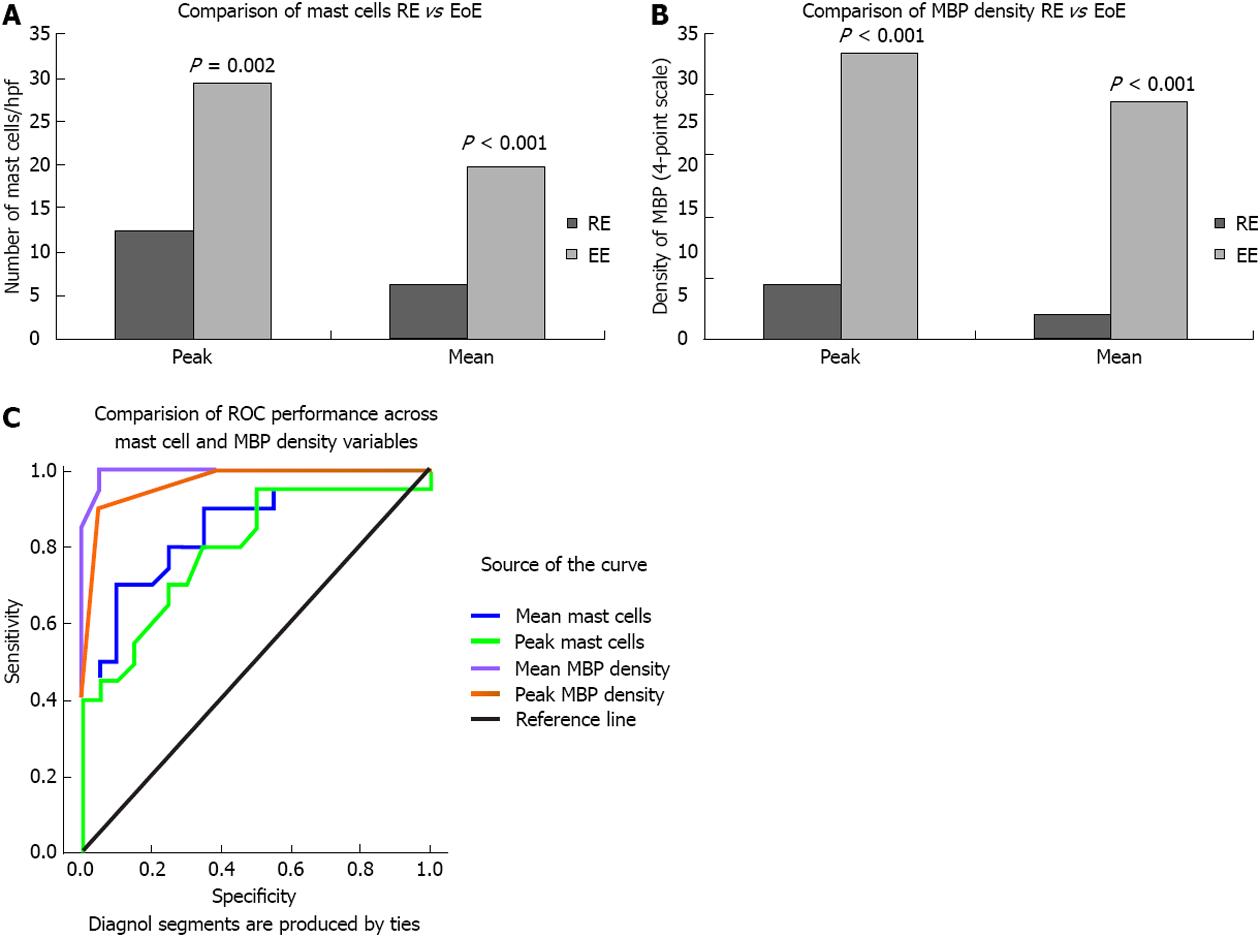
Figure 2 Biomarker comparison between high eosinophil and low esophageal density.
A: Comparison of mast cells reflux esophagitis (RE) vs eosinophilic esophagitis (EoE); B: Comparison of major basic protein (MBP) density RE vs EoE; C: Comparison of receiver operating characteristic (ROC) performance across mast cell and MBP density variables.
- Citation: Colombo JM, Neilan NA, Schurman JV, Friesen CA. Validation of methods to assess potential biomarkers in pediatric patients with esophageal eosinophilia. World J Gastrointest Pharmacol Ther 2013; 4(4): 113-119
- URL: https://www.wjgnet.com/2150-5349/full/v4/i4/113.htm
- DOI: https://dx.doi.org/10.4292/wjgpt.v4.i4.113


