Copyright
©2013 Baishideng Publishing Group Co.
World J Gastrointest Pharmacol Ther. May 6, 2013; 4(2): 28-38
Published online May 6, 2013. doi: 10.4292/wjgpt.v4.i2.28
Published online May 6, 2013. doi: 10.4292/wjgpt.v4.i2.28
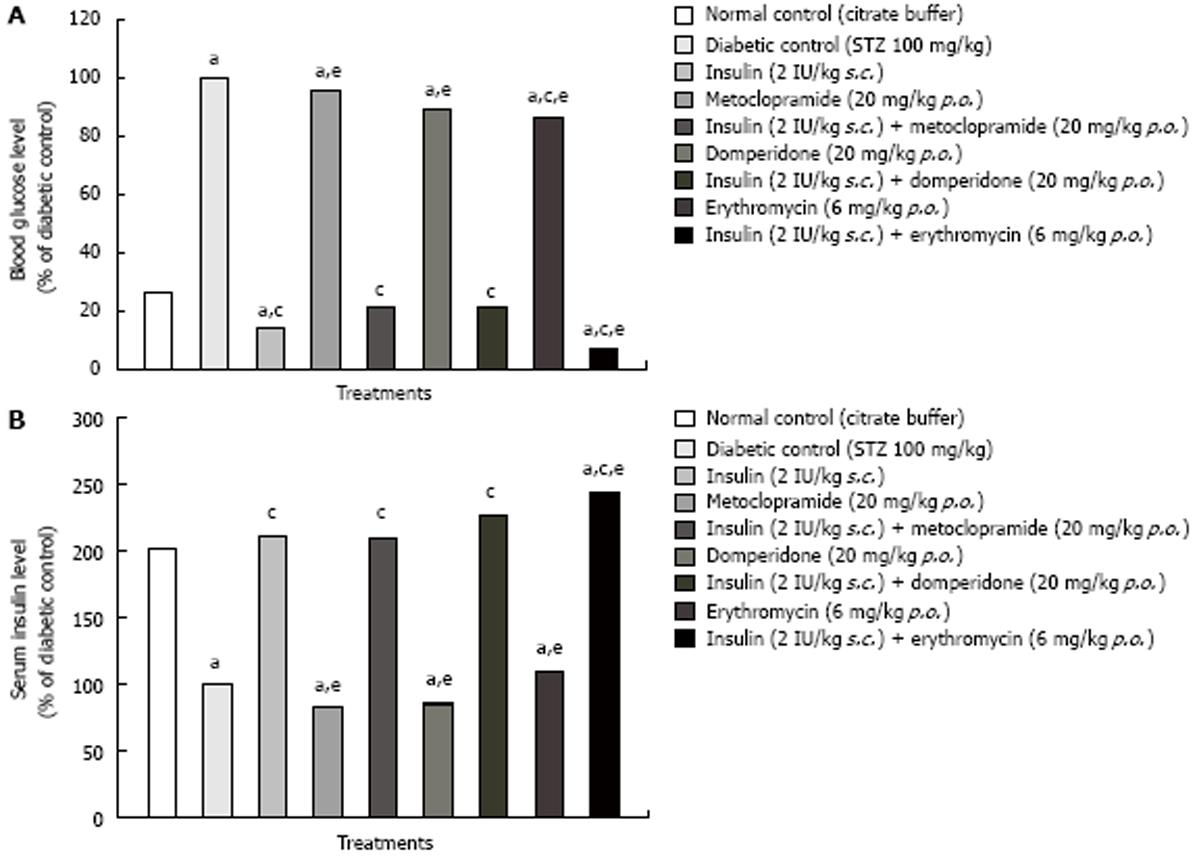
Figure 1 Acute effect in streptozotocin-induced diabetic mice of single doses of insulin, metoclopramide, domperidone and erythromycin individually as well as the combination of insulin with metoclopramide, domperidone or erythromycin.
A: Blood glucose level; B: Serum insulin level. Values represent the mean ± SE of eight mice per group. Significantly different from the normal control value at aP < 0.05; Significantly different from the diabetic control value at cP < 0.05; Significantly different from insulin value at eP < 0.05.
Figure 2 Subchronic effect in streptozotocin-induced diabetic mice of one week of daily administration of insulin, metoclopramide, domperidone and erythromycin individually as well as the combination of insulin with metoclopramide, domperidone or erythromycin.
A: Blood glucose level; B: Serum insulin level. Values represent the mean ± SE of eight mice per group. Significantly different from the normal control value at aP < 0.05; Significantly different from the diabetic control value at cP < 0.05; Significantly different from insulin value at eP < 0.05.
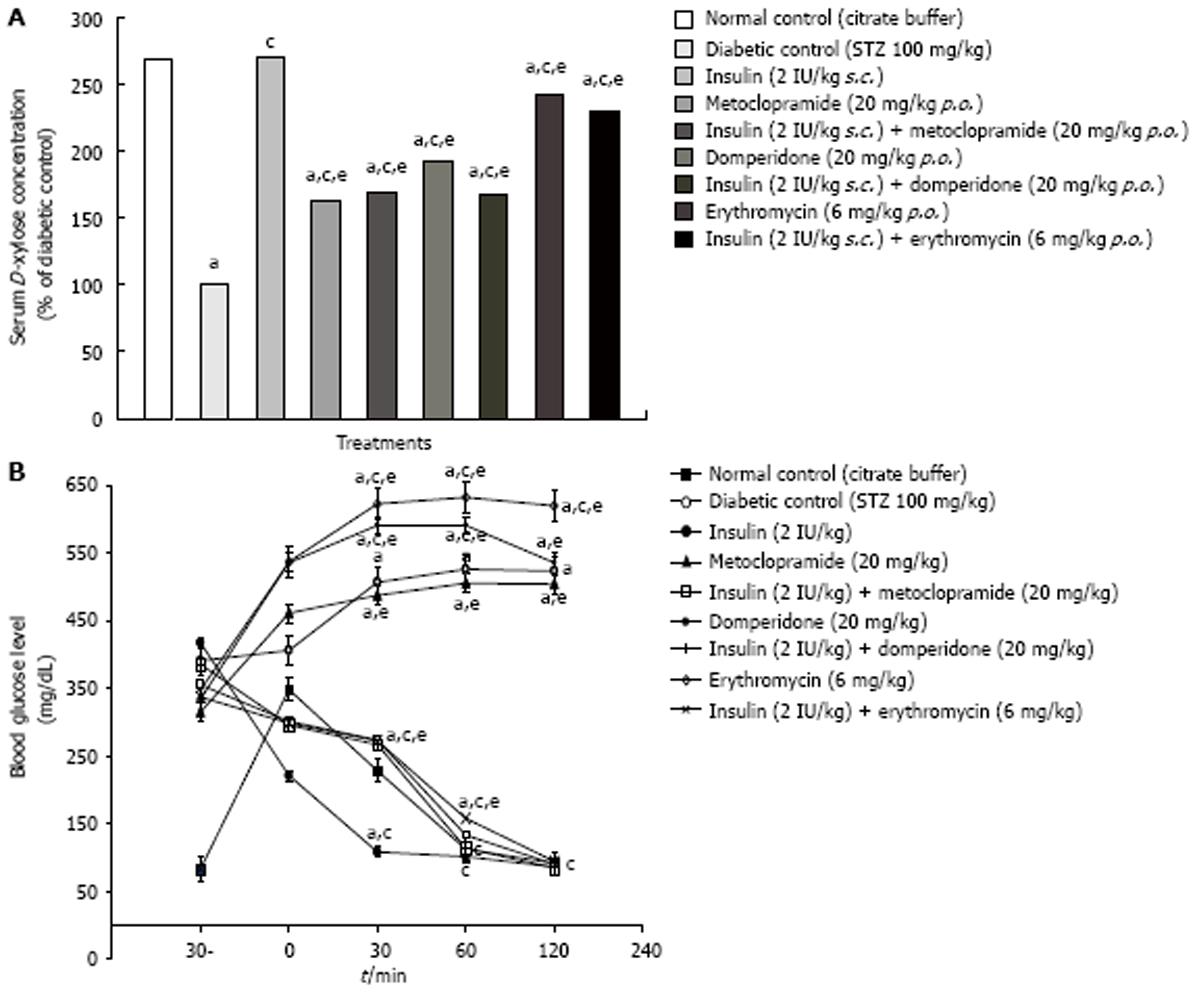
Figure 3 Effect on oral D-xylose absorption and tolerance test in streptozotocin-induced diabetic mice of single doses of insulin, metoclopramide, domperidone and erythromycin individually as well as the combination of insulin with metoclopramide, domperidone or erythromycin.
A: Oral D-xylose absorption test; B: Oral D-glucose tolerance test. Values represent the mean ± SE of eight mice per group. Significantly different from the normal control value at aP < 0.05; Significantly different from the diabetic control value at cP < 0.05; Significantly different from insulin value at eP < 0.05.
Figure 4 Effect on the area under the curve of blood glucose concentrations during oral glucose absorption test in streptozotocin-induced diabetic mice of single doses of insulin, metoclopramide, domperidone and erythromycin individually as well as the combination of insulin with metoclopramide, domperidone or erythromycin.
Values represent the mean ± SE of eight mice per group. Significantly different from the normal control value at aP < 0.05; Significantly different from the diabetic control value at cP < 0.05; Significantly different from insulin value at eP < 0.05. AUC: Areas under the curve.
- Citation: Shalaby MAF, Latif HAAE, Sayed MEE. Interaction of insulin with prokinetic drugs in STZ-induced diabetic mice. World J Gastrointest Pharmacol Ther 2013; 4(2): 28-38
- URL: https://www.wjgnet.com/2150-5349/full/v4/i2/28.htm
- DOI: https://dx.doi.org/10.4292/wjgpt.v4.i2.28


