Copyright
©2010 Baishideng Publishing Group Co.
World J Gastrointest Pharmacol Ther. Dec 6, 2010; 1(6): 123-131
Published online Dec 6, 2010. doi: 10.4292/wjgpt.v1.i6.123
Published online Dec 6, 2010. doi: 10.4292/wjgpt.v1.i6.123
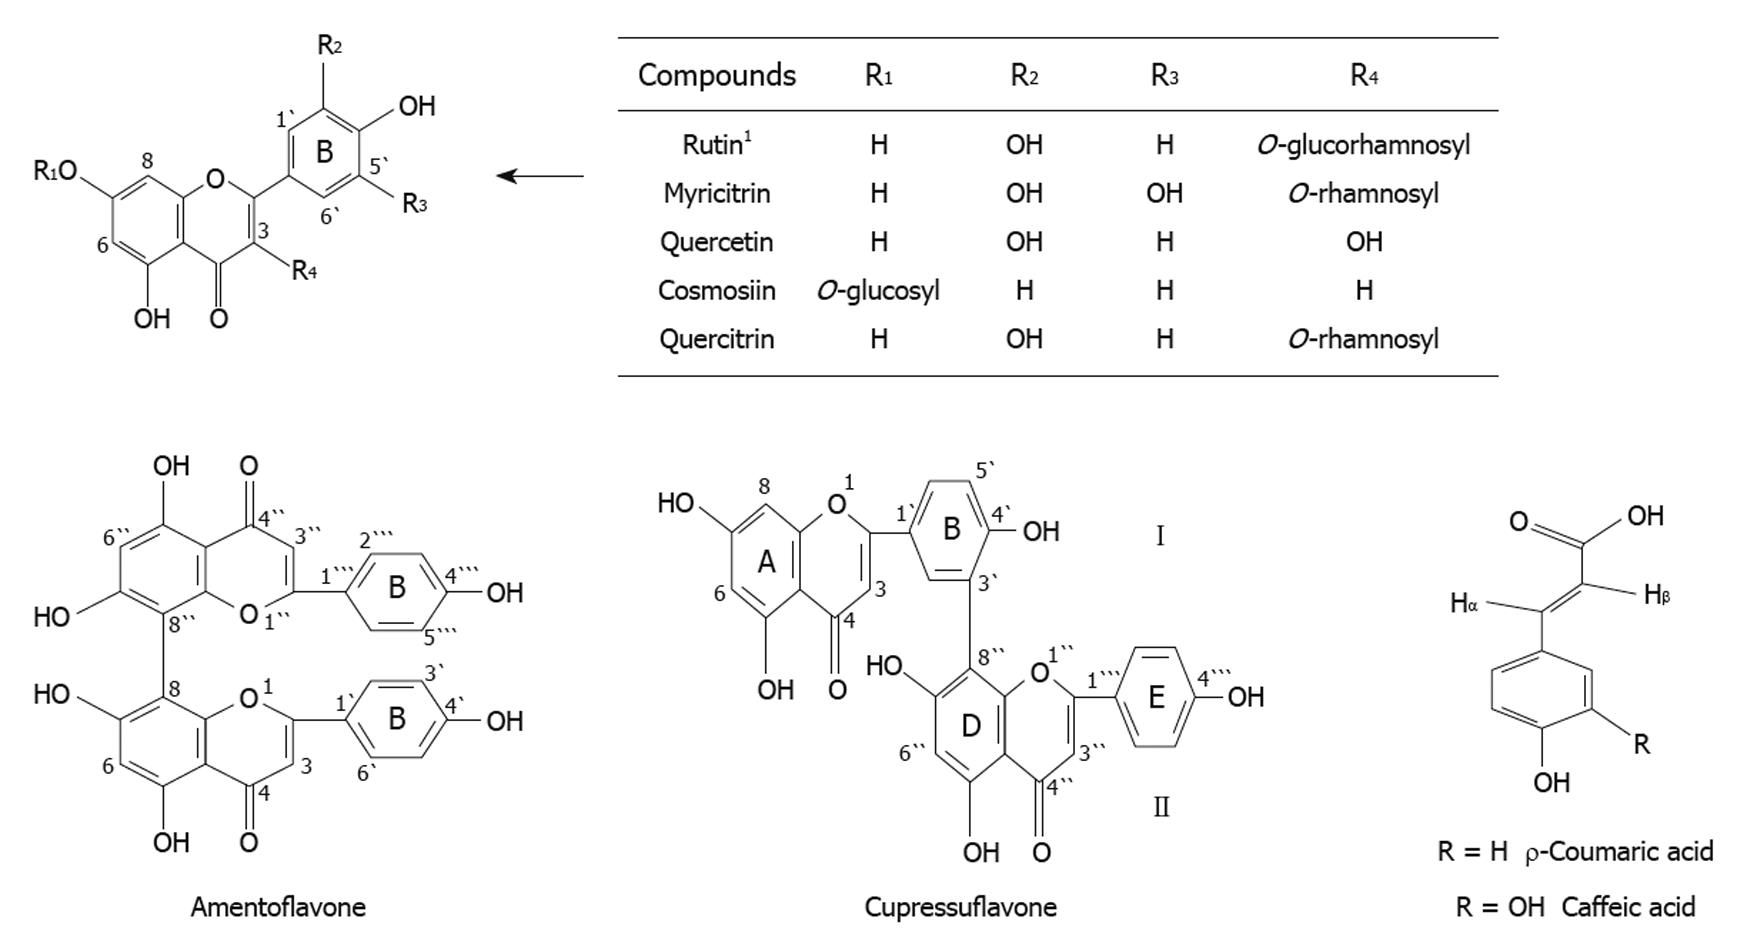
Figure 1 Chemical composition of the methanolic extracts of Cupressus sempervirens L.
or Juniperus phoenicea L.except Rutin present in Cupressus sempervirens L. only. 1Rutin present in Cupressus sempervirens leaves only and revealing a more remarkable effect in histological studies of liver and kidney.
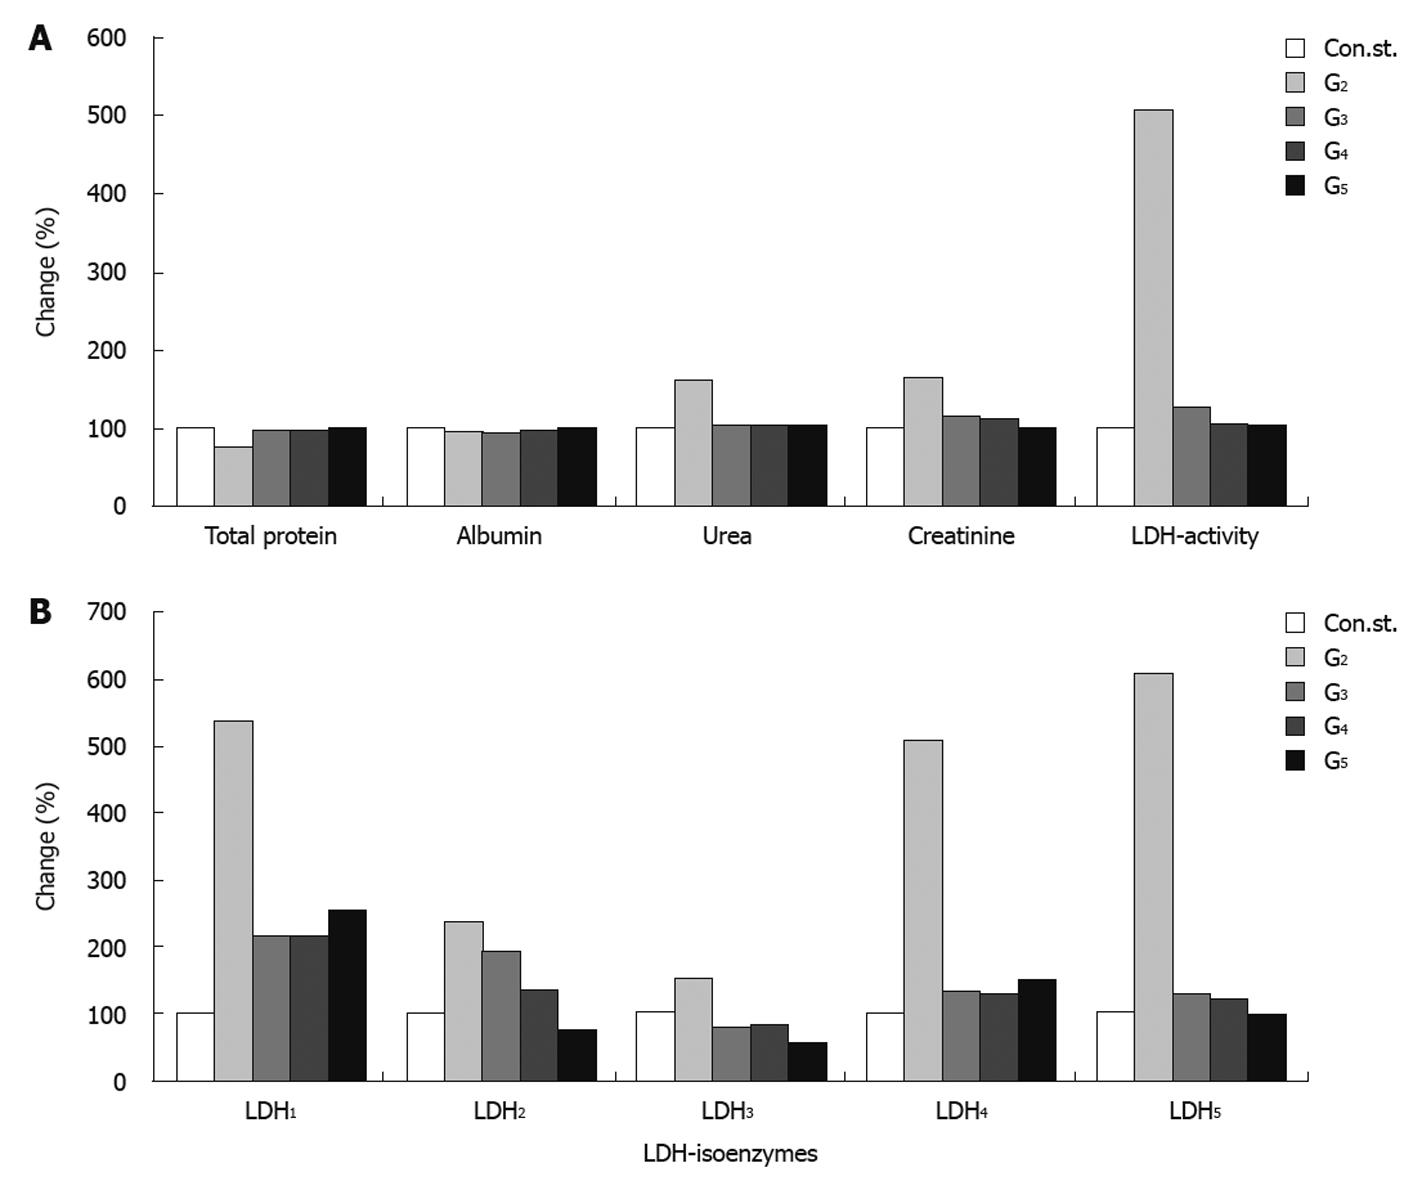
Figure 2 Diagrammatic representation illustrating the percentage change in total protein, albumin, urea, creatinine, lactate dehydrogenase-activity (A), and lactate dehydrogenase-isoenzymes (B) in rat serum of different groups as compared to control.
LDH: Lactate dehydrogenase.
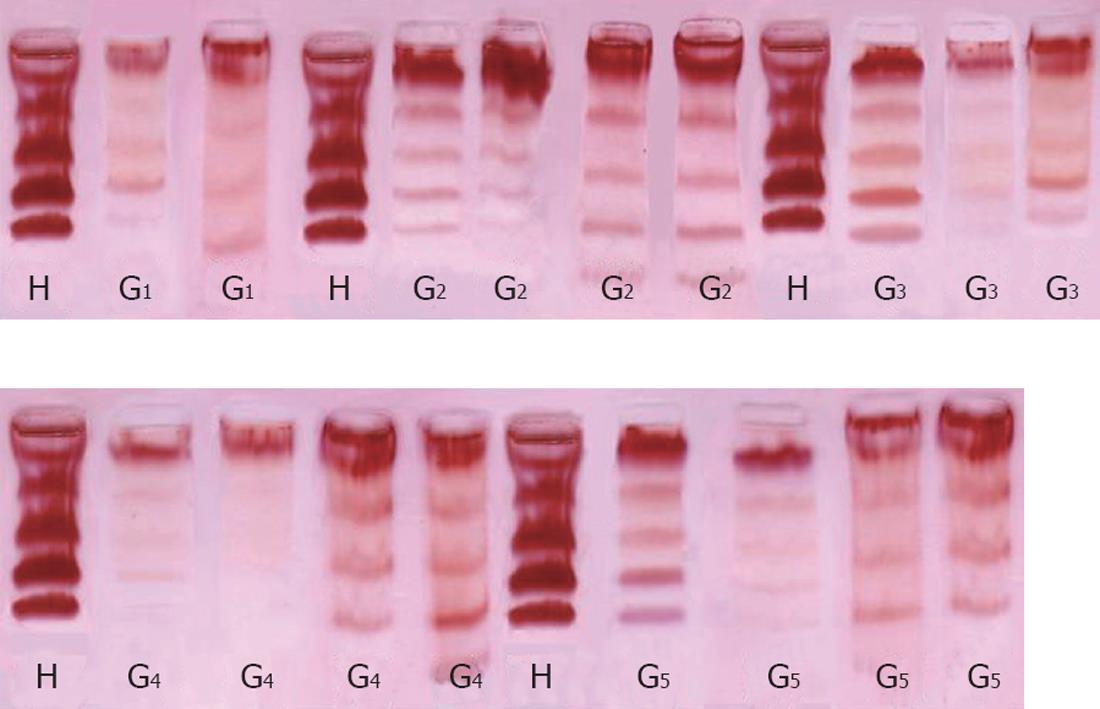
Figure 3 Electrophoretic profile of lactate dehydrogenase isoenzymes in heart (H), liver (L) of rats control group (G1); CCl4 group (G2); CCl4 (self-recovery) group (G3); CCl4 + Juniperus phoenicea group (G4); CCl4 + Cupressus sempervirens (G5).
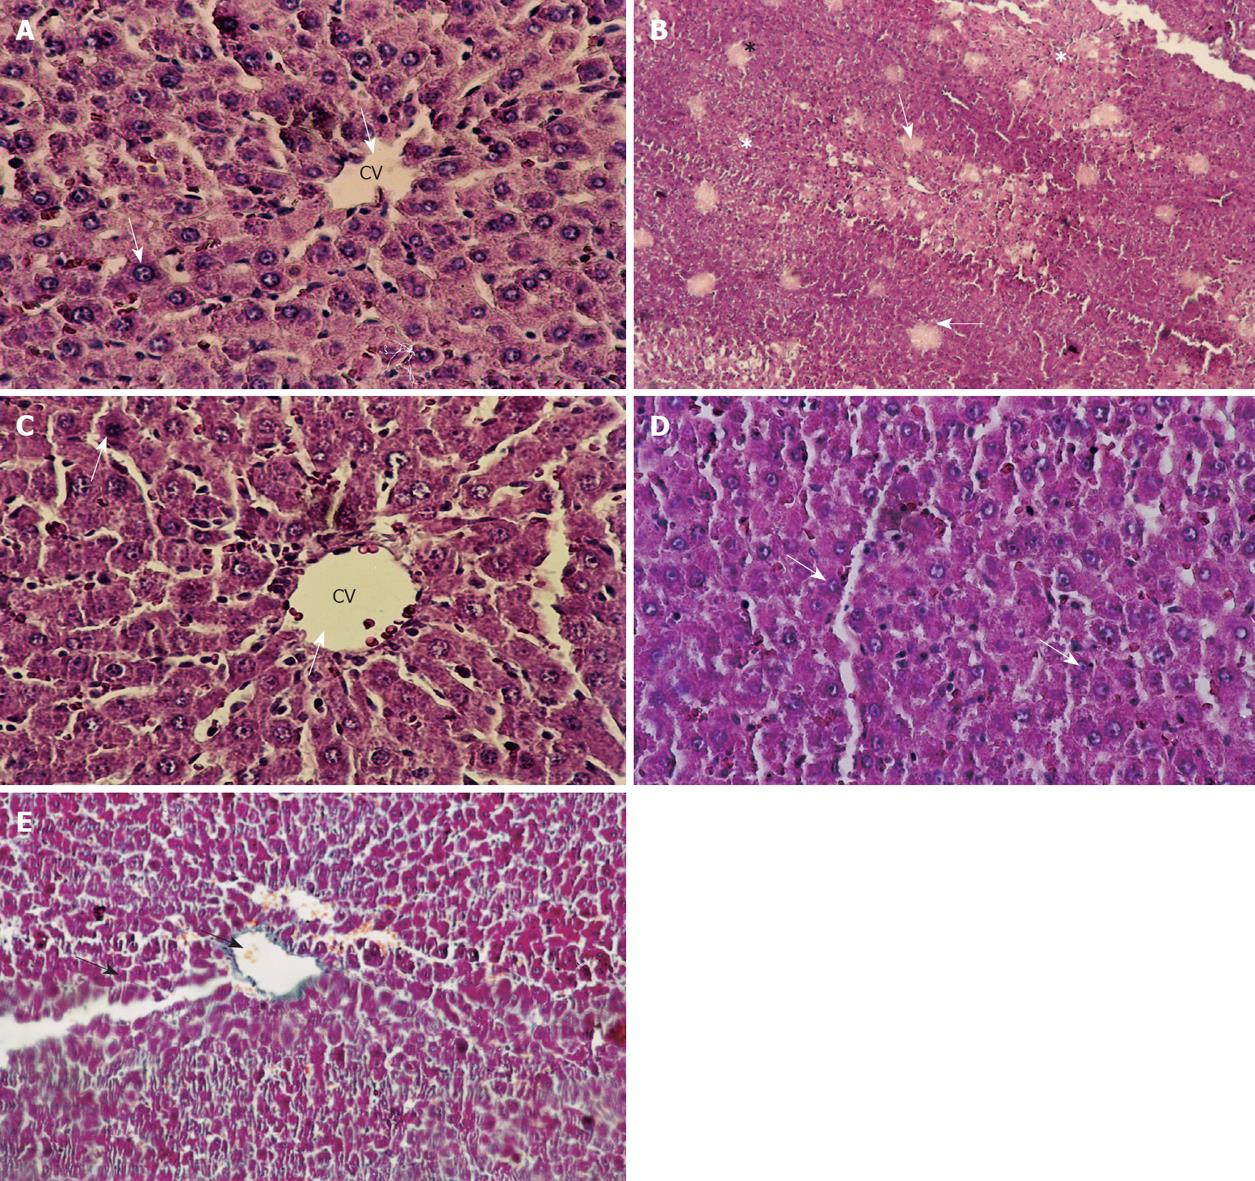
Figure 4 Histological appearance of the liver (HE staining).
A: Section of control liver showing a normal histological appearance (arrows) (× 200); B: Liver section of a rat treated with CCl4 (24 h) showing classic cirrhotic appearance (arrows) with the presence of coagulative necrosis (asterisks), note the necrosis of hepatic cells and formation of vacuoles (arrows) (× 100); C: Liver section of a rat treated with CCl4 + Cupressus sempervirens group showing hepatocytes, with normal histological profile, arrows indicated (CV) normal hepatocyte (× 200); D: Liver section of a rat treated with CCl4 + Juniperus phoenicea group, except for fatty degeneration (arrows), the lobular appearance is normal (× 100); E: Liver section of a rat treated with CCl4 (1.5 mo self-recovery group) showing micronodular cirrhosis (arrows) is seen along with moderate fatty change. Note the regenerative nodule surrounded by fibrous connective tissue extending between portal regions (× 100). CV: Central vein
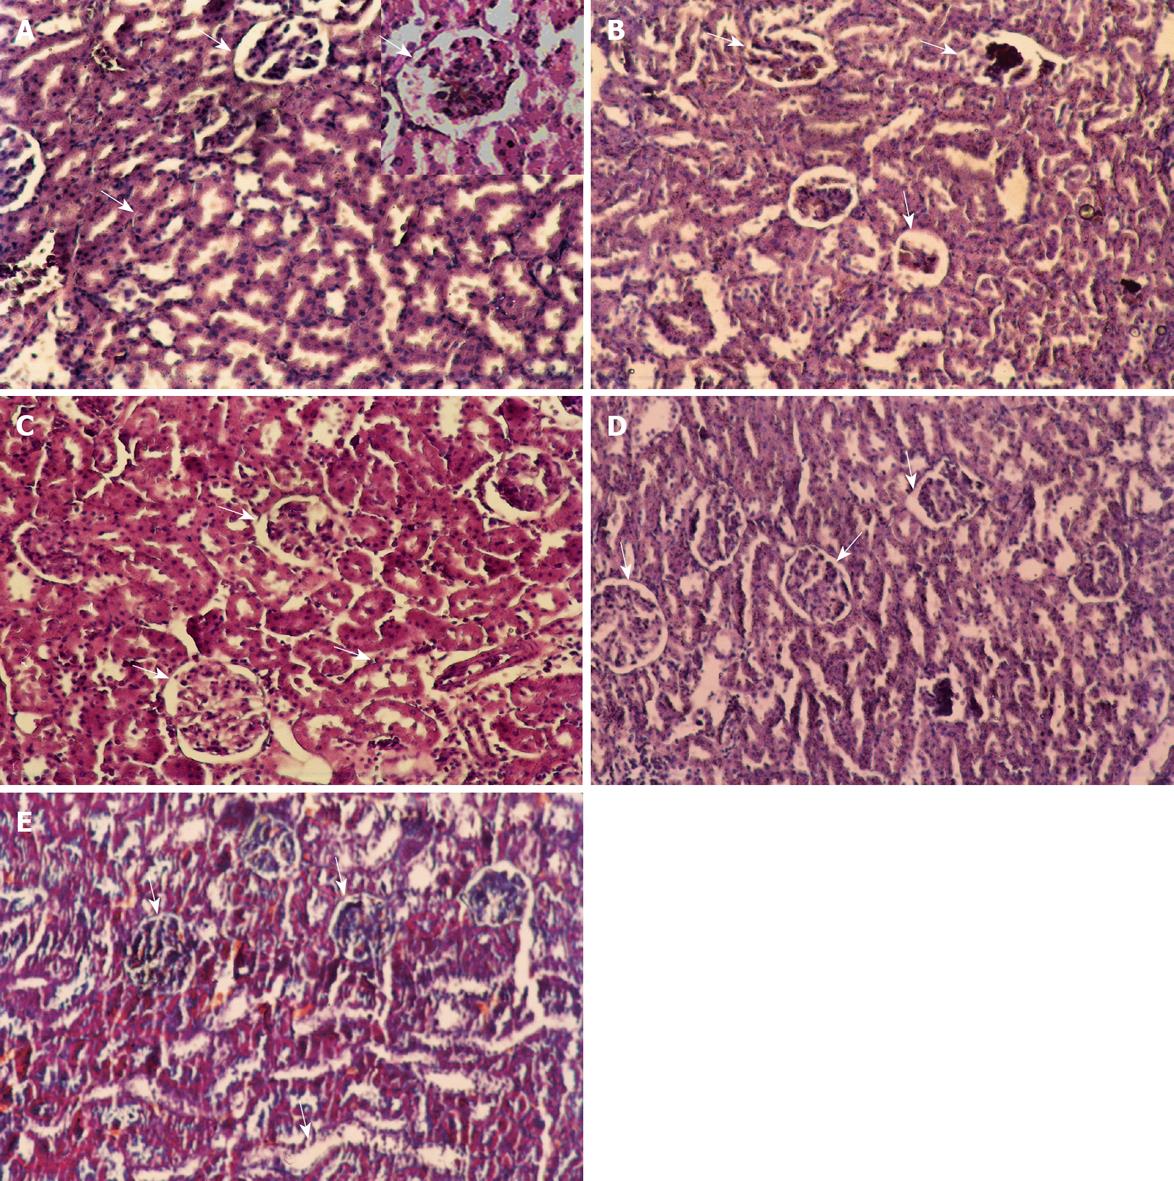
Figure 5 Histological appearance of the kidney (HE staining).
A: Section of control kidney showing a normal histological appearance glomeruli and tubules (arrows) appear normal (× 100), with higher magnification section (× 200); B: Renal cortex in CCl4 (24 h) group. Segmental glomerular necrosis (arrows) seen, tubular dilation (arrows) and detachment of tubular epithelial cells also visible (× 100); C: Renal cortex in CCl4 + Cupressus sempervirens group, glomeruli and tubules (arrows) appear normal in cortex (× 200); D: Renal cortex in CCl4 + Juniperus phoenicea group, glomeruli and tubules (arrows) appear normal seen in cortex (× 100); E: Renal cortex in CCl4 group (1.5 mo, self-recovery) group. Vacuolization, atrophy and detachment of tubular epithelial cells (arrows) seen (× 100).
-
Citation: Ali SA, Rizk MZ, Ibrahim NA, Abdallah MS, Sharara HM, Moustafa MM. Protective role of
Juniperus phoenicea andCupressus sempervirens against CCl4. World J Gastrointest Pharmacol Ther 2010; 1(6): 123-131 - URL: https://www.wjgnet.com/2150-5349/full/v1/i6/123.htm
- DOI: https://dx.doi.org/10.4292/wjgpt.v1.i6.123


