Copyright
©The Author(s) 2016.
World J Gastrointest Pathophysiol. May 15, 2016; 7(2): 235-241
Published online May 15, 2016. doi: 10.4291/wjgp.v7.i2.235
Published online May 15, 2016. doi: 10.4291/wjgp.v7.i2.235
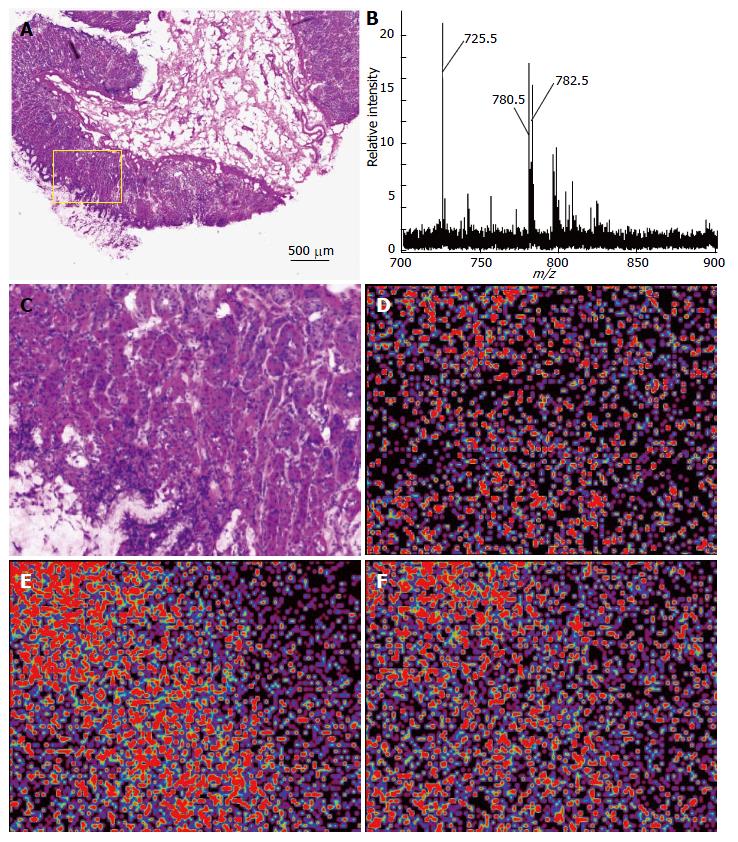
Figure 1 Imaging mass spectrometry analysis of a gastric mucosa.
A: HE staining of the gastric mucosa. Inset, ROI of the imaging analysis; B: Averaged spectra obtained from five gastric mucosae; C: Magnified view of the ROI represented in the inset of (A), HE; D: The ion at m/z 725.5; E: The ion at m/z 780.5; F: The ion at m/z 782.5 were imaged using BioMap.
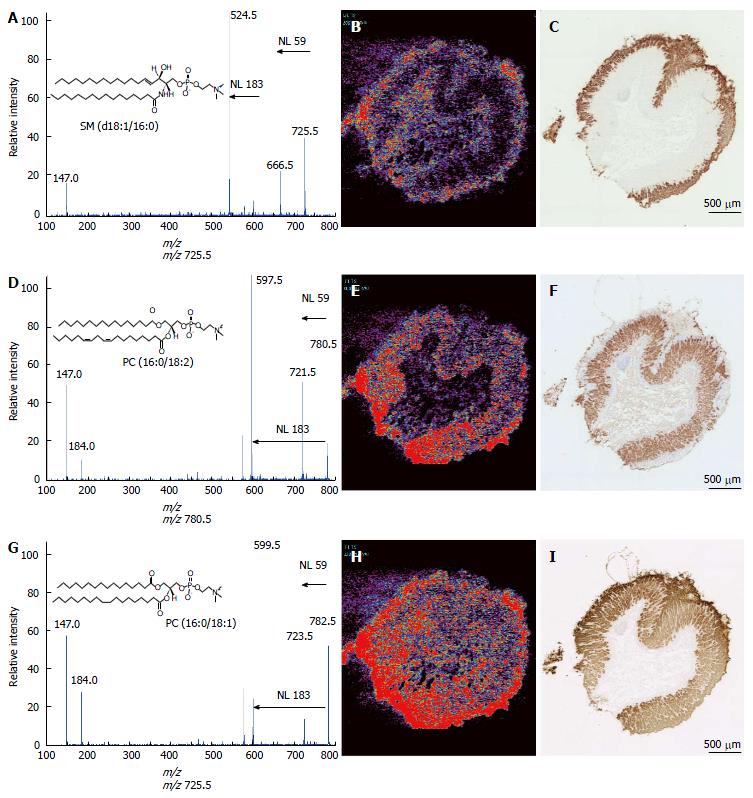
Figure 2 Ion assignment of m/z 725.
5, 780.5, and 782.5 and immunohistochemical analyses of the gastric mucosae. MS/MS analyses were performed to identify the ions at m/z 725.5 (A), 780.5 (D), and 782.5 (G). The ion images of m/z 725.5 (B), 780.5 (E), and 782.5 (H) are shown using BioMap software. Immunohistochemical analyses were performed using the antibodies against MUC5AC (C), H(+)-K(+)-ATPaseβ (F), and claudin18 (I) in the adjacent specimens used in the imaging MS analyses. Scale bar, 1 mm. MS: Mass spectrometry.
- Citation: Kurabe N, Igarashi H, Ohnishi I, Tajima S, Inoue Y, Takahashi Y, Setou M, Sugimura H. Visualization of sphingolipids and phospholipids in the fundic gland mucosa of human stomach using imaging mass spectrometry. World J Gastrointest Pathophysiol 2016; 7(2): 235-241
- URL: https://www.wjgnet.com/2150-5330/full/v7/i2/235.htm
- DOI: https://dx.doi.org/10.4291/wjgp.v7.i2.235


