Copyright
©The Author(s) 2016.
World J Gastrointest Pathophysiol. May 15, 2016; 7(2): 223-234
Published online May 15, 2016. doi: 10.4291/wjgp.v7.i2.223
Published online May 15, 2016. doi: 10.4291/wjgp.v7.i2.223
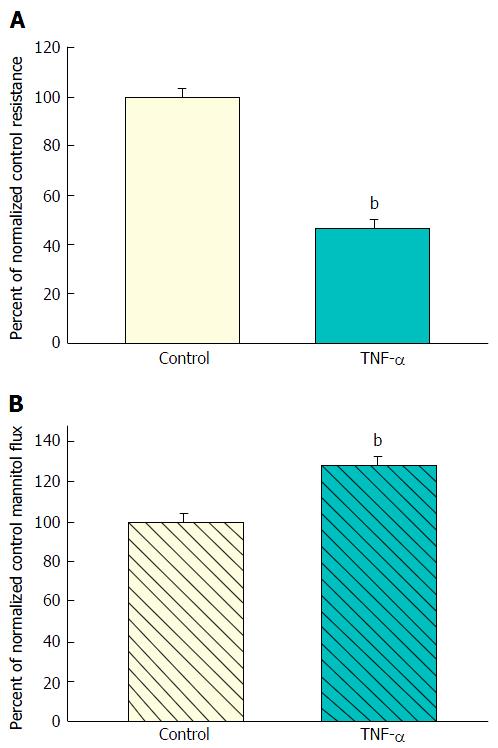
Figure 1 The effect of tumor necrosis factor-α on CACO-2 transepithelial electrical resistance and transepithelial flux of 14C-D-mannitol.
A: Seven-day post-confluent CACO-2 cell layers on Millipore polycarbonate filters were refed in control medium or medium containing 200 ng/mL tumor necrosis factor-α (TNF-α) (apical and basal-lateral compartments) 48 h prior to electrical measurements. Data shown represent the mean ± SE of 16 cell layers per condition. Data represent the percent of control resistance normalized across 3 experiments; B: After electrical measurements, radiotracer flux studies with 0.1 mmol/L, 0.1 μCi/mL 14C-D-mannitol were performed on CACO-2 cell layers, as described in Materials and Methods. Data represent the percent of control flux rate normalized across 4 experiments, and is expressed as the mean ± SE of 20 cell layers per condition. bP < 0.001 vs control (Student’s t test, one-tailed).
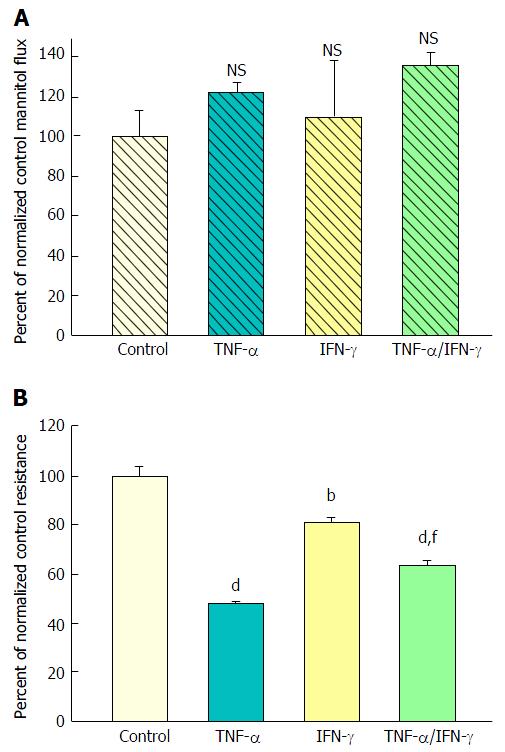
Figure 2 The effect of tumor necrosis factor-α and interferon-γ on CACO-2 transepithelial electrical resistance and transepithelial flux of 14C-D-mannitol.
A: Radiotracer flux studies were conducted as described in Figure 1 with the treatment conditions listed above. Data represent the percent of control flux rate, and is expressed as the mean ± SE of 4 cell layers per condition. NS indicates non significance vs control; B: CACO-2 cell layers were cultured and treated as described in Figure 1, using the following conditions: Control medium; medium containing 200 ng/mL tumor necrosis factor-α (TNF-α); medium containing 200 ng/mL Interferon-γ (IFN-γ); or medium containing a combination of 200 ng/mL TNF-α and 200 ng/mL IFN-γ. Data shown represent the mean ± SE of 4 cell layers per condition, with data expressed as the percent of control resistance. bP < 0.01 vs control; dP < 0.001 vs control; fP < 0.01 vs TNF-α alone (one-way ANOVA followed by Tukey’s post hoc testing).
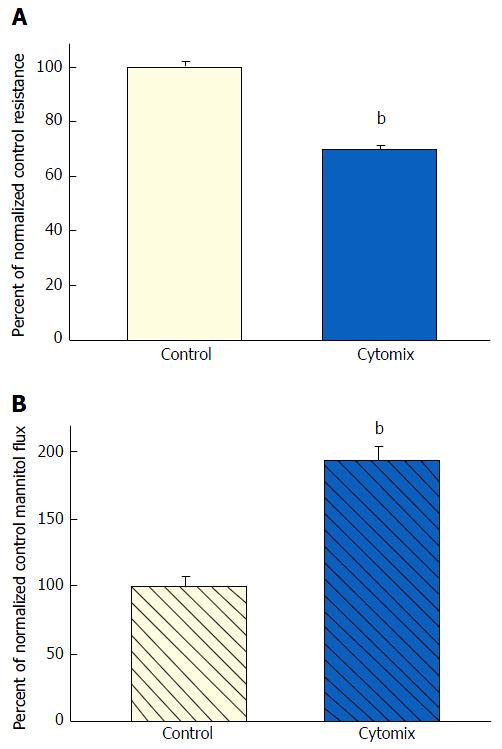
Figure 3 The effect of tumor necrosis factor-α + interferon-γ + interleukin-1β on CACO-2 transepithelial electrical resistance and transepithelial flux of 14C-D-mannitol.
A: Twenty-one day post-confluent CACO-2 cell layers cultured and treated as described in Figure 1, were refed in control medium or medium containing the combination of 200 ng/mL tumor necrosis factor-α, 150 ng/mL interferon-γ, and 50 ng/mL interleukin-1β. Data shown represent the mean ± SE of 16 cell layers per condition. Data represent the percent of control resistance normalized across 4 experiments; B: Radiotracer flux studies were conducted as described in Figure 1, with the same conditions listed above for panel A. Data represent the percent of control flux rate normalized across 2 experiments, and is expressed as the mean ± SE of 8 cell layers per condition. bP < 0.001 vs control (Student’s t test, one-tailed).
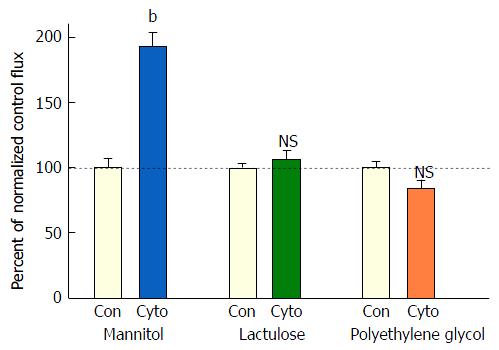
Figure 4 The effect of tumor necrosis factor-α + interferon-γ + interleukin-1β on transepithelial flux of 14C-D-mannitol, 3H-lactulose, and 14C-polyethylene glycol across CACO-2 cell layers.
Twenty-one day post-confluent CACO-2 cell layers on Millipore PCF filters were refed in control medium or medium containing the combination of 200 ng/mL tumor necrosis factor-α, 150 ng/mL interferon-γ, and 50 ng/mL interleukin-1β (apical and basal-lateral compartments) 48 h prior to radiotracer flux studies. These studies were performed using 0.1 mmol/L, 0.1 μCi/mL 14C-D-mannitol; 0.1 mmol/L, 0.25 μCi/mL 3H-lactulose; and 0.1 mmol/L, 0.3 μCi/mL 14C-polyethylene glycol as described in Materials and Methods. Data represent the percent of control flux rate normalized across 2 experiments, and is expressed as the mean ± SE of 8 cell layers per condition for the mannitol flux and 4 cell layers per condition for both the lactulose and polyethylene glycol fluxes. NS indicates non significance. bP < 0.001 vs control (Student’s t test, one-tailed).
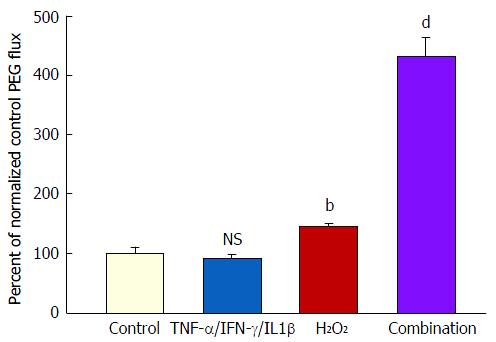
Figure 5 The effect of tumor necrosis factor-α + interferon-γ + interleukin-1β plus hydrogen peroxide on transepithelial flux of 14C-polyethylene glycol.
Seven-day and 21-d post-confluent CACO-2 cell layers on Millipore PCF filters were refed in control medium or medium containing the combination of 200 ng/mL TNF-α, 200 ng/mL IFN-γ, and 50 ng/mL IL1β (apical and basal-lateral compartments) 48 h prior to radiotracer flux studies. On the day of the experiment, the cell layers were treated for 5 h with control saline or saline containing 2 mmol/L H2O2. Paracellular permeability was assessed using 0.1 mmol/L, 0.3 μCi/mL 14C-polyethylene glycol as described in materials and methods. Data represent the percent of control flux rate normalized across 2 experiments, and is expressed as the mean ± SE for 8 cell layers per condition. NS indicates non significance vs control. bP < 0.01 vs control; dP < 0.001 vs control (one-way ANOVA followed by Tukey’s post hoc testing). IFN-γ: Interferon-γ; IL1β: Interleukin-1β; TNF-α: Tumor necrosis factor-α.
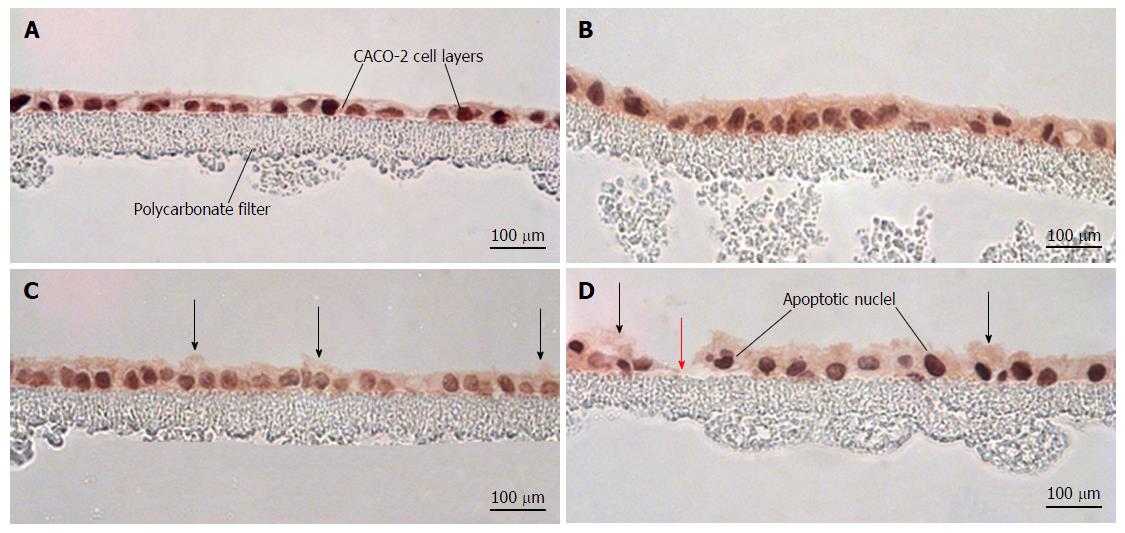
Figure 6 Morphological effects of cytokines and hydrogen peroxide on CACO-2 cell layers.
CACO-2 cell layers were cultured at confluent density onto Millipore polycarbonate filters. Seven day post-seeding, the cell layers were refed with control medium or medium containing the combination of 200 ng/mL tumor necrosis factor-α, 200 ng/mL interferon-γ, and 50 ng/mL interleukin-1β (“cytomix”) (apical and basal-lateral compartments) for 48 h, followed by exposure to saline or saline containing 2 mmol/L H2O2 for 5 h. Cell layers were then fixed in formalin and stained with hematoxylin and eosin. A: CACO-2 cell layers exposed to control medium and control saline; B: CACO-2 cell layers exposed to cytomix medium and control saline; C: CACO-2 cell layers exposed to control medium and saline containing hydrogen peroxide; D: CACO-2 cell layers exposed to cytomix medium and saline containing hydrogen peroxide. In C and D, black arrows indicate instances of cytoplasmic blebbing. The red arrow points at a gap in the epithelial barrier arising from cell death and detachment.
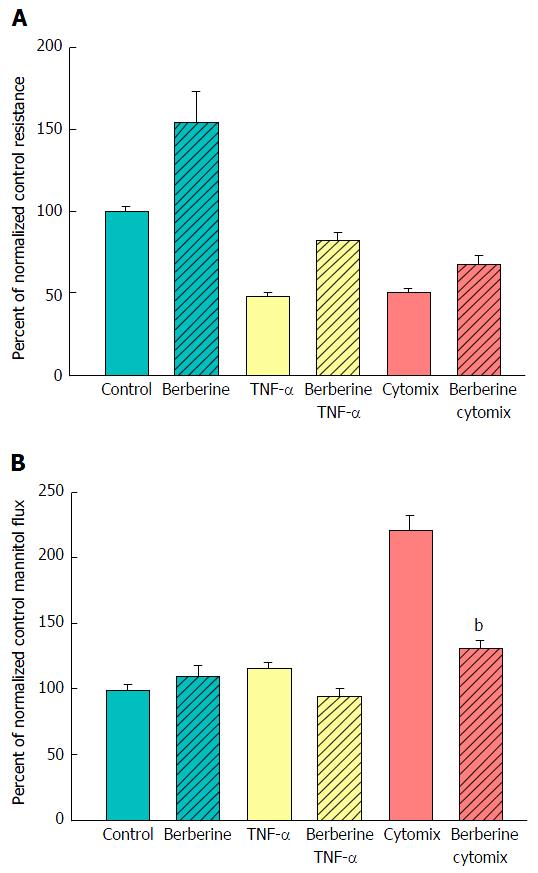
Figure 7 The effect of berberine on cytokine-induced leak of CACO-2 cell layers.
A: Seven-day post-confluent CACO-2 cell layers on Millipore polycarbonate filters were refed in control medium or medium containing 100 μmol/L berberine. After 24 h treatment with berberine alone, the cell layers were given either control or berberine medium in addition to being exposed to no cytokines, TNF-α alone, or cytomix (apical and basal-lateral compartments) for 48 h prior to electrical measurements. Data shown represent the mean ± SE of 8 cell layers per condition. Data represent the percent of control resistance normalized across experiments; B: After electrical measurements, the same CACO-2 cell layers represented in A were used to perform radiotracer flux studies with 0.1 mmol/L, 0.1 μCi/mL 14C-D-mannitol, as described in Materials and Methods. Data represent the percent of control flux rate normalized across experiments and is expressed as the mean ± SE of 8 cell layers per condition. bP < 0.001 vs cytomix alone (one-way ANOVA followed by Tukey’s post hoc testing). TNF-α: Tumor necrosis factor-α.
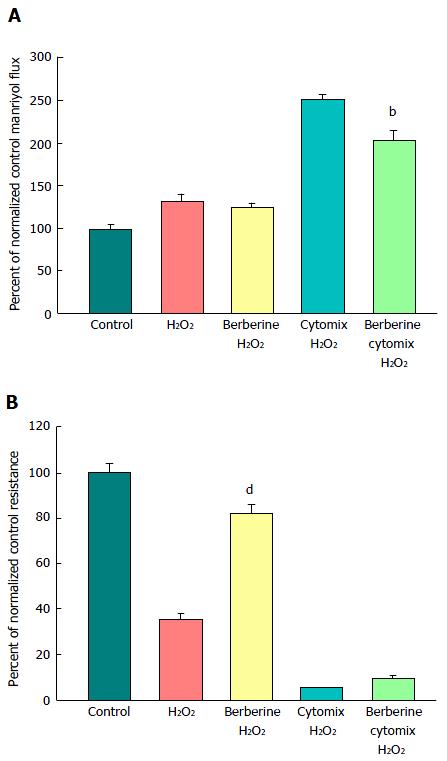
Figure 8 The effect of berberine on cytokine- and peroxide-induced leak of CACO-2 cell layers.
A: After electrical measurements, the same CACO-2 cell layers represented in B were used to perform radiotracer flux studies with 0.1 mmol/L, 0.025 μCi/mL 14C-PEG. Data represent the percent of control flux rate, and is expressed as the mean ± SE of 4 cell layers per condition (3 cell layers for the condition of cytomix + peroxide, due to removal of one outlier data point, as determined by a 90% confidence level in the Dixon’s Q test); B: Seven-day post-confluent CACO-2 cell layers on Millipore polycarbonate filters were refed in control medium or medium containing 100 μmol/L berberine. After 24 h treatment with berberine alone, the cell layers were given either control or berberine medium, in addition to being exposed to either cytomix (50 ng/mL tumor necrosis factor-α, 100 ng/mL interferon-γ, 50 ng/mL interleukin-1β) or no cytokines (apical and basal-lateral compartments) for 48 h. On the day of the experiment, the cell layers were treated for 5 h with control saline or saline containing 1 mmol/L hydrogen peroxide ± berberine. Data shown represent the mean ± SE of 4 cell layers per condition, with data expressed as the percent of control resistance. bP < 0.01 vs cytomix + H2O2; dP < 0.001 vs H2O2 alone (one-way ANOVA followed by Tukey’s post hoc testing). Experiment was repeated with similar results.
- Citation: DiGuilio KM, Mercogliano CM, Born J, Ferraro B, To J, Mixson B, Smith A, Valenzano MC, Mullin JM. Sieving characteristics of cytokine- and peroxide-induced epithelial barrier leak: Inhibition by berberine. World J Gastrointest Pathophysiol 2016; 7(2): 223-234
- URL: https://www.wjgnet.com/2150-5330/full/v7/i2/223.htm
- DOI: https://dx.doi.org/10.4291/wjgp.v7.i2.223


