Copyright
©The Author(s) 2015.
World J Gastrointest Pathophysiol. Nov 15, 2015; 6(4): 140-149
Published online Nov 15, 2015. doi: 10.4291/wjgp.v6.i4.140
Published online Nov 15, 2015. doi: 10.4291/wjgp.v6.i4.140
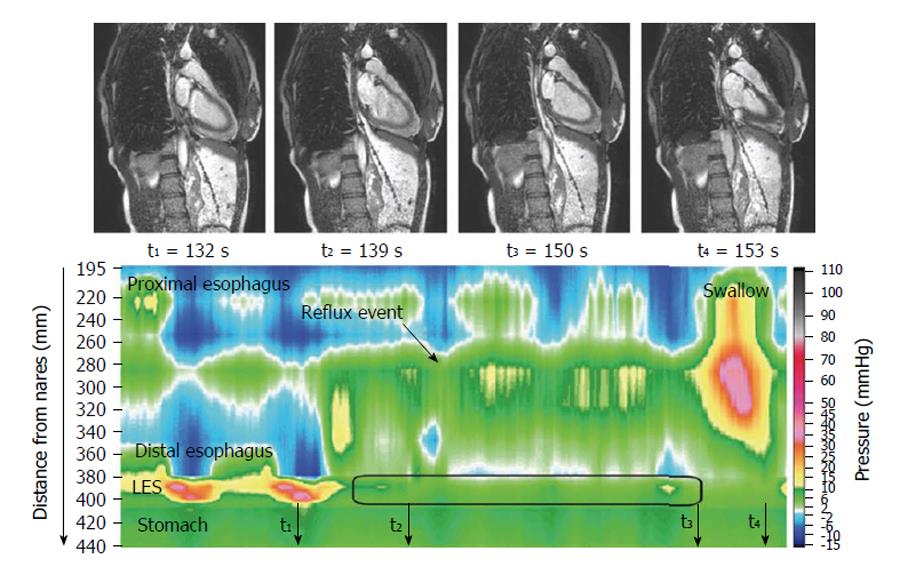
Figure 1 Concurrent high-resolution manometry and magnetic resonance imaging.
Representative image demonstrates concurrent high-resolution manometry and magnetic resonance imaging detection of reflux. Note that shortening of the esophagus in the dynamic magnetic resonance images appears to draw the proximal stomach upwards relative to the catheter (above). Reproduced with permission from ref. [11].
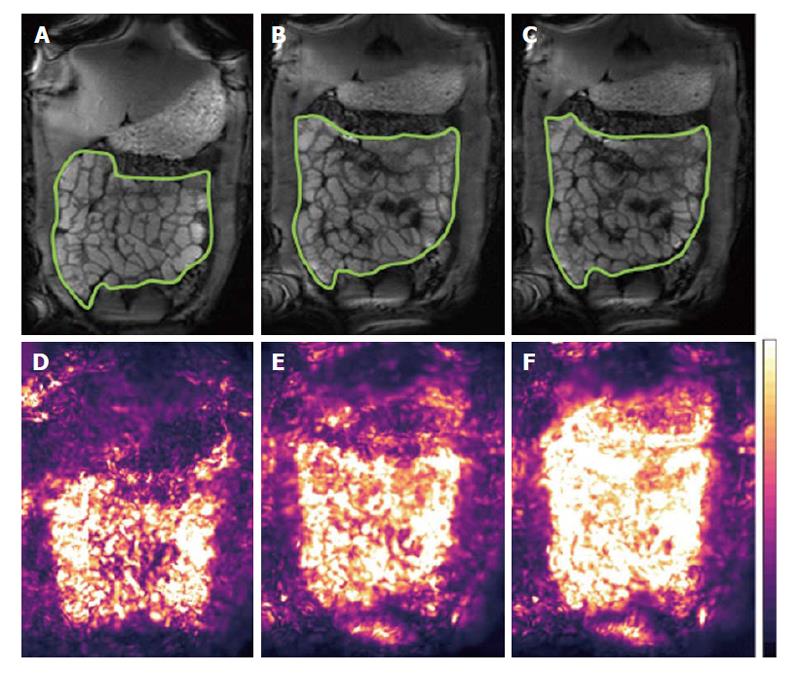
Figure 2 Small bowel motility maps.
Example of small bowel regions (contoured) in the upper panel and motility biomarker maps in the lower panel. Respectively: breath-hold ground truth (A and D), dual-registration of abdominal motion (B and E) and free breathing optical flow registration alone (C and F), respectively. Respiratory motion compensation is visible as reduced motility in the transverse colon closest to the diaphragm and systemically over the small bowel. The effect of robust data decomposition registration is less apparent in the lower bowel further from the diaphragm where the effects of free breathing are less pronounced. The color coding I the motility maps shows black as lower motility and white as higher. Reprinted with permission from ref. [28].
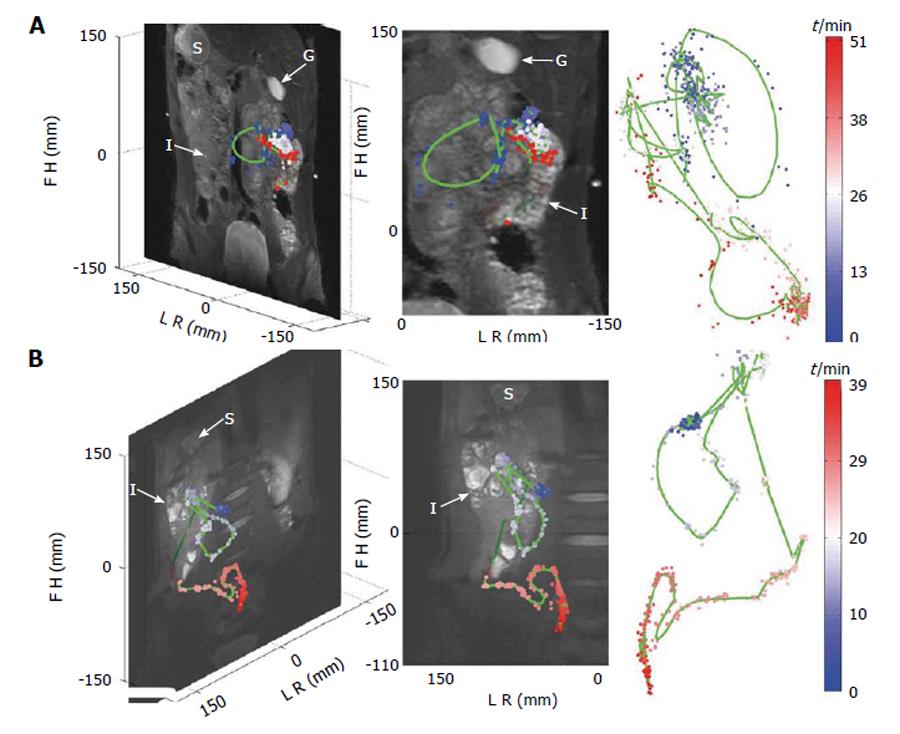
Figure 3 19F magnetic resonance imaging tracking of transit marker capsule in two healthy subjects.
The panel shows anatomical reference images, 19F capsules positions and the fitted intestinal course for subjects (A) and (B). The labels on the figure denote the stomach (S), gall bladder (G) and small intestine (I) and the time course of the two capsules is color coded. Reprinted with permission from ref. [62]. LR: Left-right; FH: Feet-head.
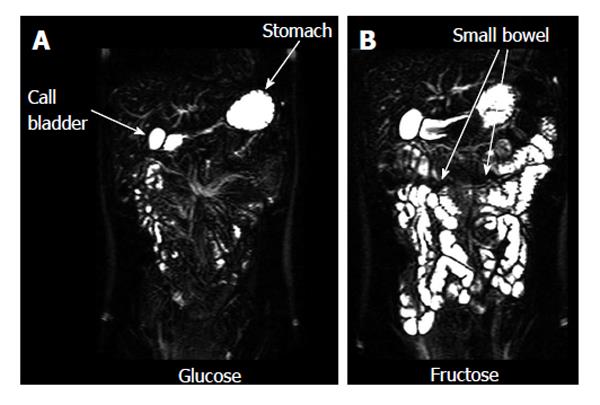
Figure 4 Small bowel water imaging.
Representative example of coronal images of the small bowel water from a single volunteer acquired 75 min after drinking 40 g of glucose (A) or 40 g fructose (B) in 500 mL water. Glucose is rapidly absorbed so the small bowel has very little water in it despite the large drink. Conversely fructose is poorly absorbed and osmotically active as shown by the large amount of water in the small bowel. Adapted with authors’ own copyright from ref. [77].
- Citation: Khalaf A, Hoad CL, Spiller RC, Gowland PA, Moran GW, Marciani L. Magnetic resonance imaging biomarkers of gastrointestinal motor function and fluid distribution. World J Gastrointest Pathophysiol 2015; 6(4): 140-149
- URL: https://www.wjgnet.com/2150-5330/full/v6/i4/140.htm
- DOI: https://dx.doi.org/10.4291/wjgp.v6.i4.140


