Copyright
©2014 Baishideng Publishing Group Inc.
World J Gastrointest Pathophysiol. Aug 15, 2014; 5(3): 373-379
Published online Aug 15, 2014. doi: 10.4291/wjgp.v5.i3.373
Published online Aug 15, 2014. doi: 10.4291/wjgp.v5.i3.373
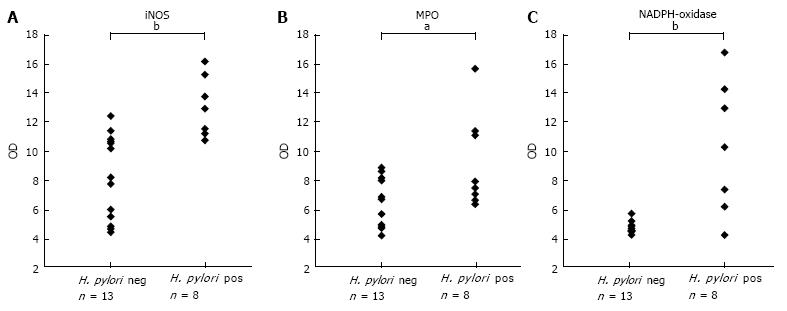
Figure 1 Scatter-plot demonstrating the result of Western blot inducible nitric oxide synthase, myeloperoxidase and nicotinamide adenine dinucleotide phosphate-oxidase protein expression in biopsies from the anrum of the Helicobacter pylori neg (n = 13) and Helicobacter pylori pos (n = 8) groups.
A: Inducible nitric oxide synthase (iNOS), bP < 0.01; B: Myeloperoxidase (MPO), aP < 0.05; C: Nicotinamide adenine dinucleotide phosphate (NADPH)-oxidase subunit p47-phox in biopsies from the antrum of the H. pylori neg. (n = 13) and H. pylori pos. (n = 8) groups, bP < 0.01, OD: Optical density.
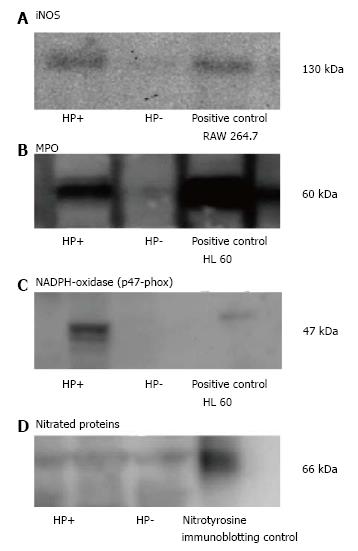
Figure 2 Western blot.
A: Western blot detecting inducible nitric oxide syntase (iNOS) with a band at 130 kDa in RAW 264.7 (pos contr.), and in human antral mucosa retrieved from Helicobacter pylori (H. pylori) pos. and H. pylori neg. volunteers during endoscopy; B: Western blot of the MPO positive 60 kDa band in the positive HL60 control and in gastric mucosal specimens of H. pylori pos. and H. pylori neg. volunteers; C: Western blot of p47-phox, representing NADPH-oxidase with a band at 47 kDa (pos. contr.) HL60, and in HP+ and HP- samples; D: Regarding Western blot representing Nitrotyrosine, several bands of Nitrated proteins could be analysed. Shown in the figure is a typical 66 kDa band in the pos. control and in H. pylori pos. and H. pylori neg. subjects.
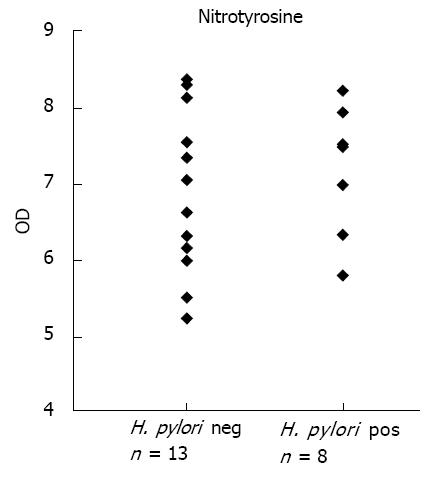
Figure 3 Nitrotyrosine.
Scatter-plot demonstrating the result of Western blot analysis of nitrotyrosine formation in biopsies from the antrum of the Helicobacter pylori (H. pylori) neg. (n = 13) and H. pylori pos. (n = 8) groups. There were no significant changes between groups. OD: Optical density.
-
Citation: Elfvin A, Edebo A, Hallersund P, Casselbrant A, Fändriks L. Oxidative and nitrosative stress enzymes in relation to nitrotyrosine in
Helicobacter pylori -infected humans. World J Gastrointest Pathophysiol 2014; 5(3): 373-379 - URL: https://www.wjgnet.com/2150-5330/full/v5/i3/373.htm
- DOI: https://dx.doi.org/10.4291/wjgp.v5.i3.373


