Copyright
©2014 Baishideng Publishing Group Inc.
World J Gastrointest Pathophysiol. Aug 15, 2014; 5(3): 355-358
Published online Aug 15, 2014. doi: 10.4291/wjgp.v5.i3.355
Published online Aug 15, 2014. doi: 10.4291/wjgp.v5.i3.355
Figure 1 Optical coherence tomography image showing separation of the sensory retina from the retinal pigment epithelium.
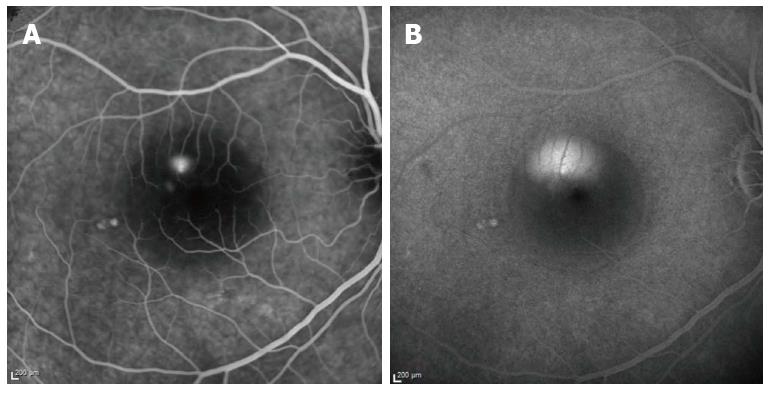
Figure 2 Fluorescein angiography at 2 (A) and 20 (B) min.
A: The early phase shows a hyperfluorescent spot due to leakage of dye through the RPE; B: During the late venous phase, fluorescein passes into the subretinal space and spreads until the entire area is filled with dye.
-
Citation: Mateo-Montoya A, Mauget-Faÿse M.
Helicobacter pylori as a risk factor for central serous chorioretinopathy: Literature review. World J Gastrointest Pathophysiol 2014; 5(3): 355-358 - URL: https://www.wjgnet.com/2150-5330/full/v5/i3/355.htm
- DOI: https://dx.doi.org/10.4291/wjgp.v5.i3.355


