Copyright
©2011 Baishideng Publishing Group Co.
World J Gastrointest Pathophysiol. Apr 15, 2011; 2(2): 26-30
Published online Apr 15, 2011. doi: 10.4291/wjgp.v2.i2.26
Published online Apr 15, 2011. doi: 10.4291/wjgp.v2.i2.26
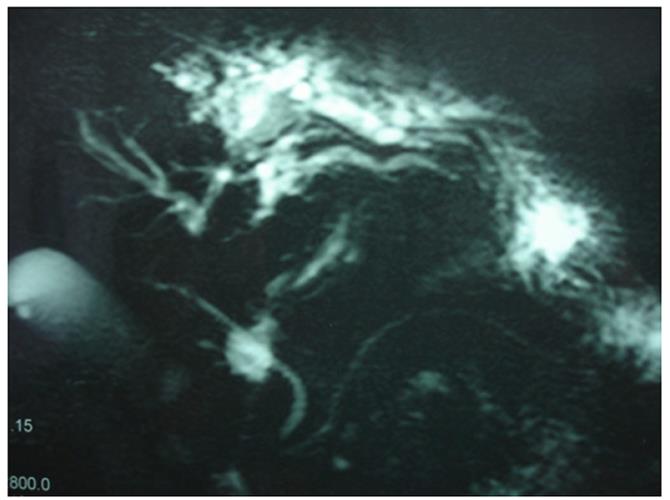
Figure 1 Magnetic resonance cholangiopancreatography revealing dilatation of left liver lobe biliary tree.
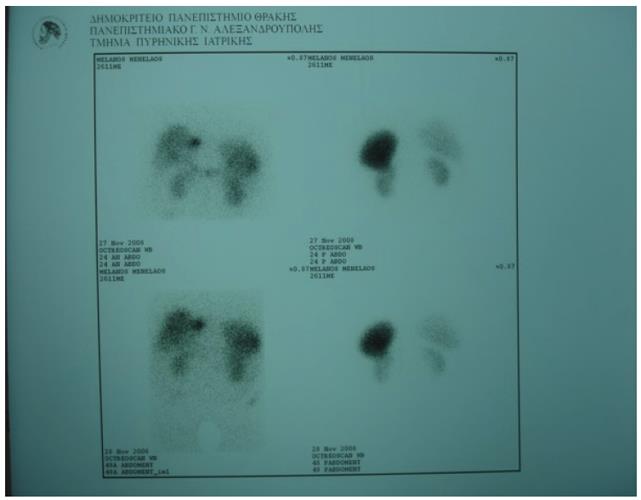
Figure 2 Octreoscan showing increased uptake close to the left liver lobe.
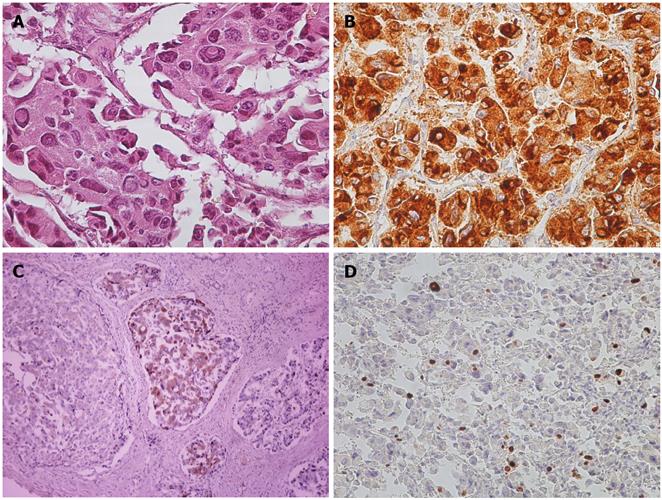
Figure 3 Pathological and immunohistochemical staining images.
A: Hematoxylin and Eosin stain (×200); B: Chromogranin A+ (×200); C: Gastrin+ (×200); D: Ki67 15% (×200).
- Citation: Tsalis K, Vrakas G, Vradelis S, Dimoulas A, Pilavaki M, Papaemmanouil S, Micheli A, Lazarides C, Kartalis G. Primary hepatic gastrinoma: Report of a case and review of literature. World J Gastrointest Pathophysiol 2011; 2(2): 26-30
- URL: https://www.wjgnet.com/2150-5330/full/v2/i2/26.htm
- DOI: https://dx.doi.org/10.4291/wjgp.v2.i2.26


