Copyright
©The Author(s) 2024.
World J Gastrointest Pathophysiol. May 24, 2024; 15(2): 92791
Published online May 24, 2024. doi: 10.4291/wjgp.v15.i2.92791
Published online May 24, 2024. doi: 10.4291/wjgp.v15.i2.92791
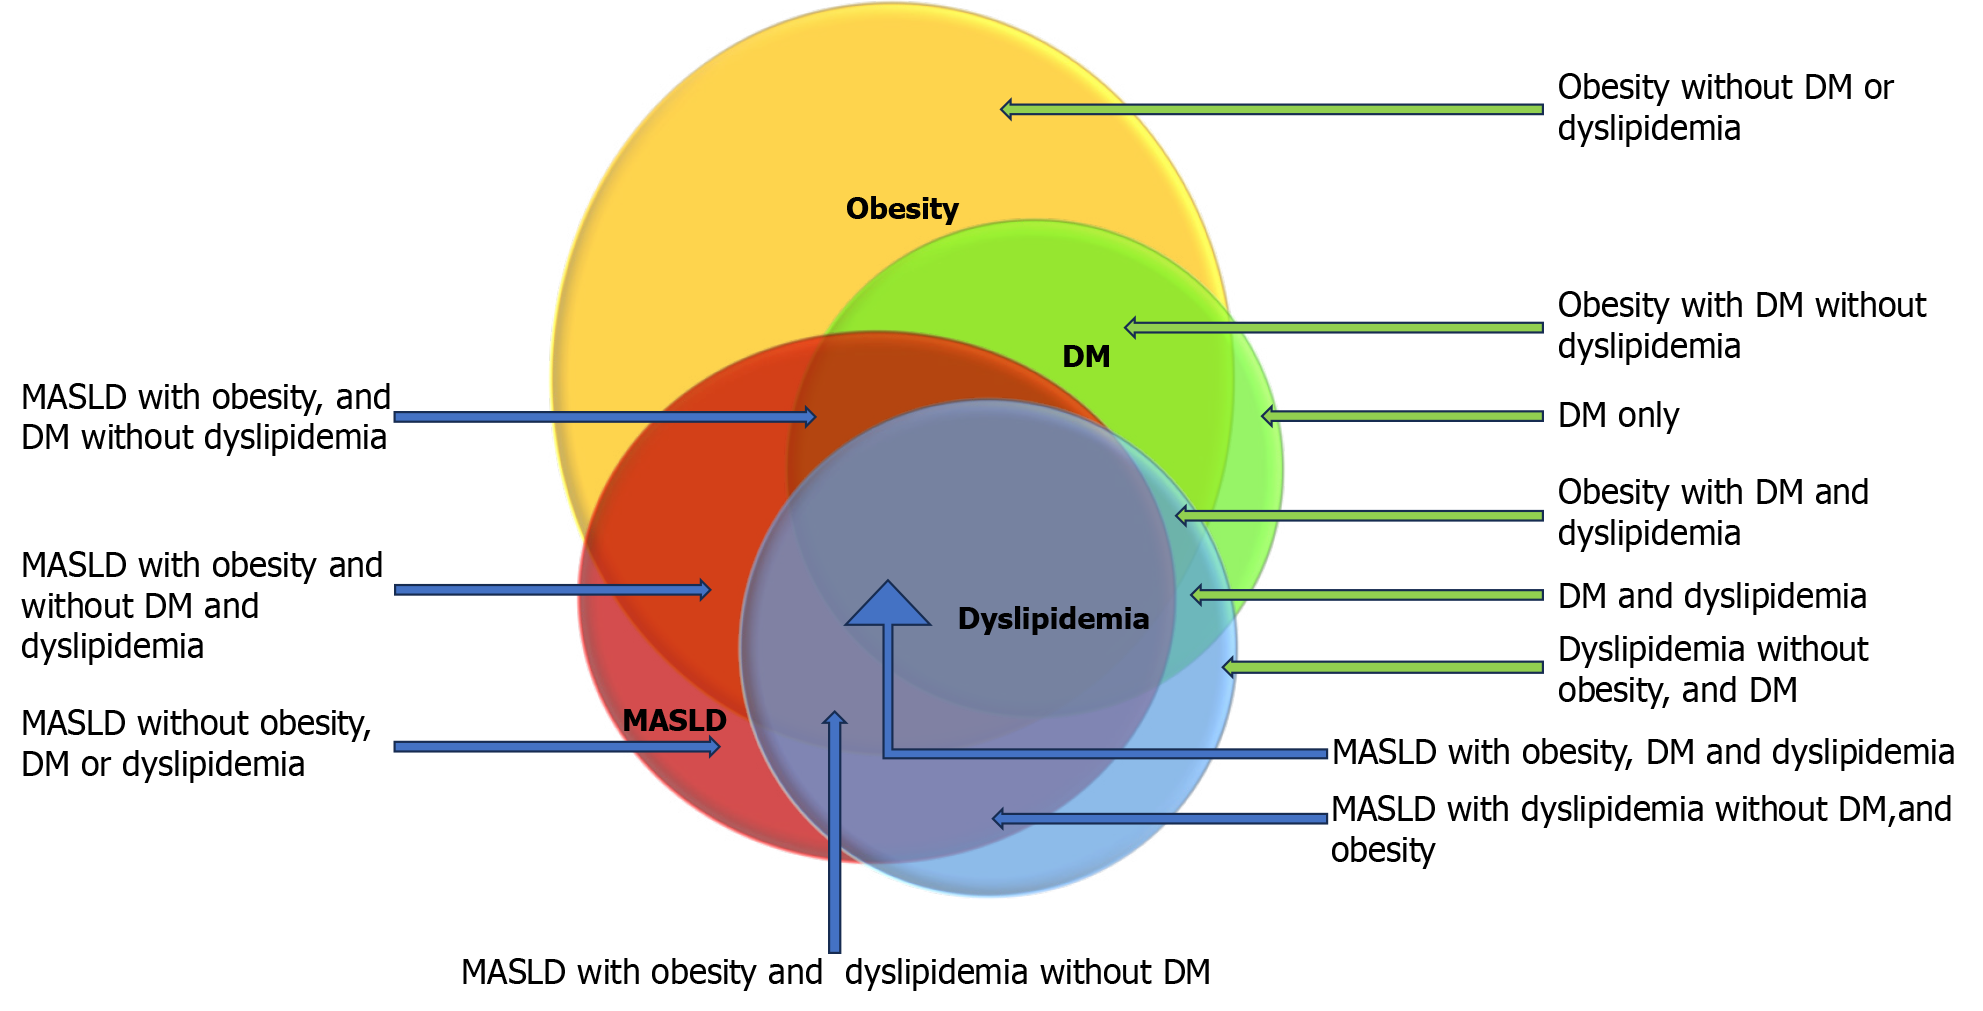
Figure 1 Overlap of metabolic comorbidities.
This diagram shows a hypothetical overlap of metabolic risk factors to highlight the heterogeneity of metabolic overlap. Metabolic risk factors are represented with colors: Obesity; yellow, DM; green, dyslipidemia; blue and metabolic dysfunction-associated steatotic liver disease (MASLD); red. The proportion of overlaps were based upon the data from epidemiological studies. Blue arrow represents MASLD patients and green arrow represents non-MASLD patients but has metabolic risk factors. MASLD: Metabolic dysfunction-associated steatotic liver disease; DM: Diabetes mellitus.
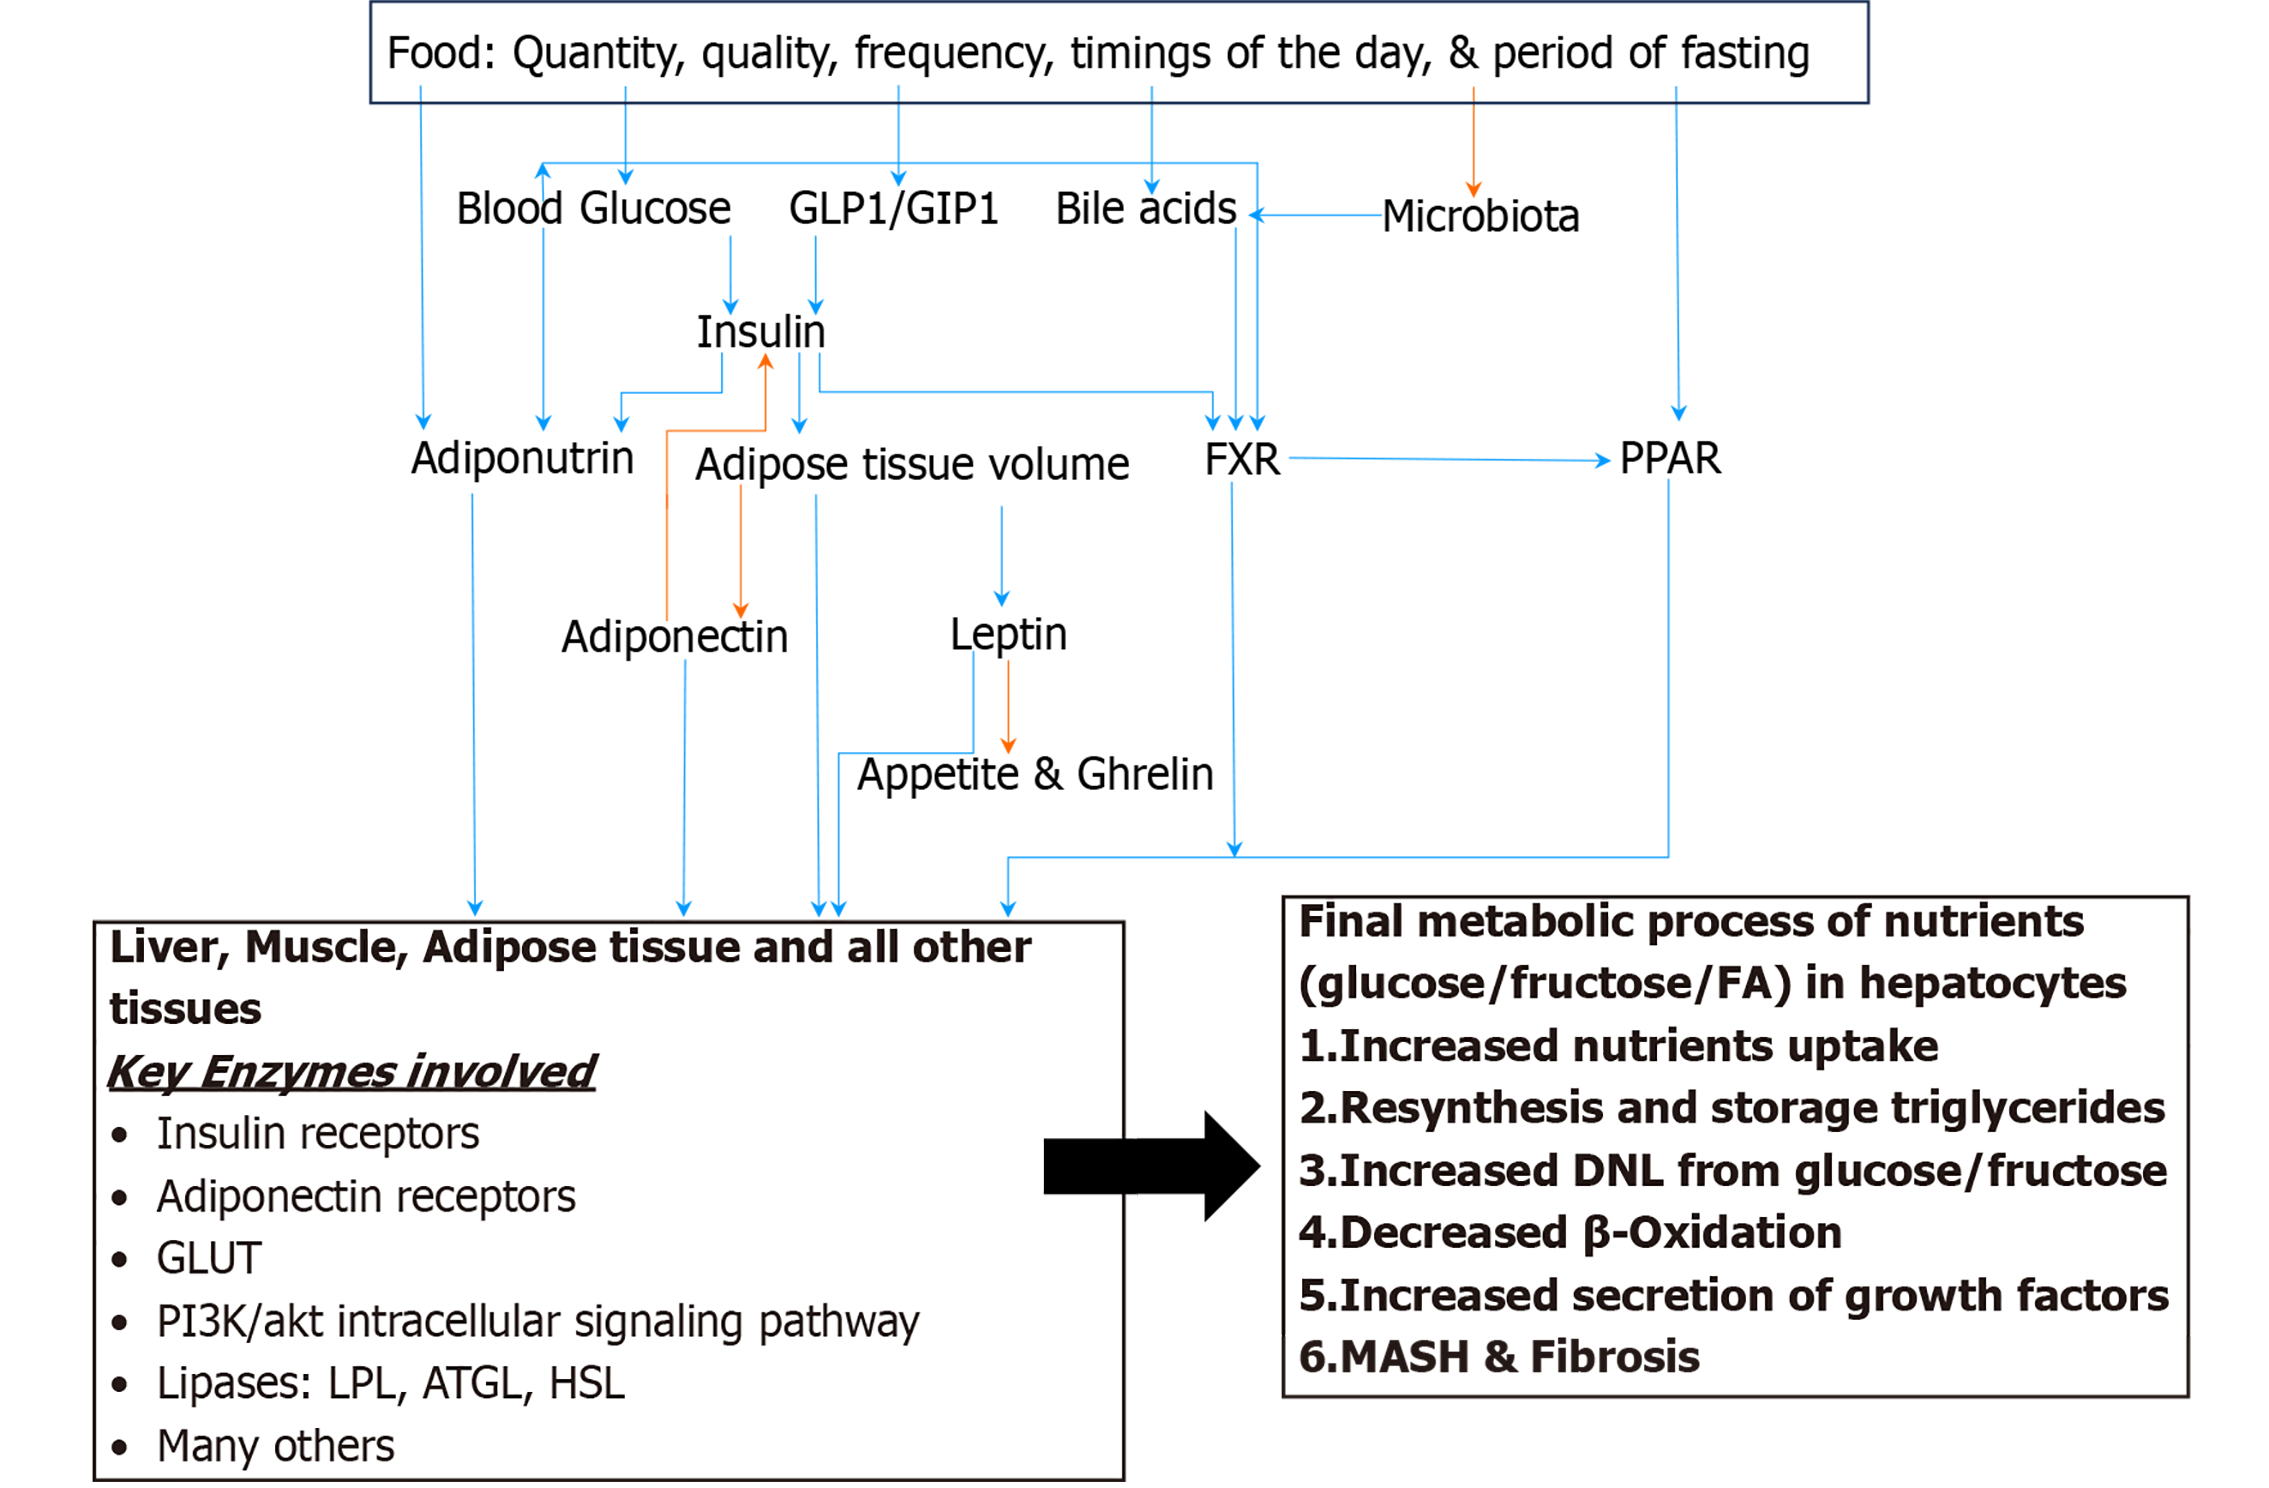
Figure 2 The key modulators of carbohydrate and fat metabolism.
Red arrow indicates negative relationship and blue arrow indicates positive relationship. FA: Fatty acid; GLP1: Glucagon like peptide 1; GIP1: Gastric inhibitory peptide 1; FXR: Farnesoid X receptor; PPAR: Peroxisome proliferator-activated receptor.
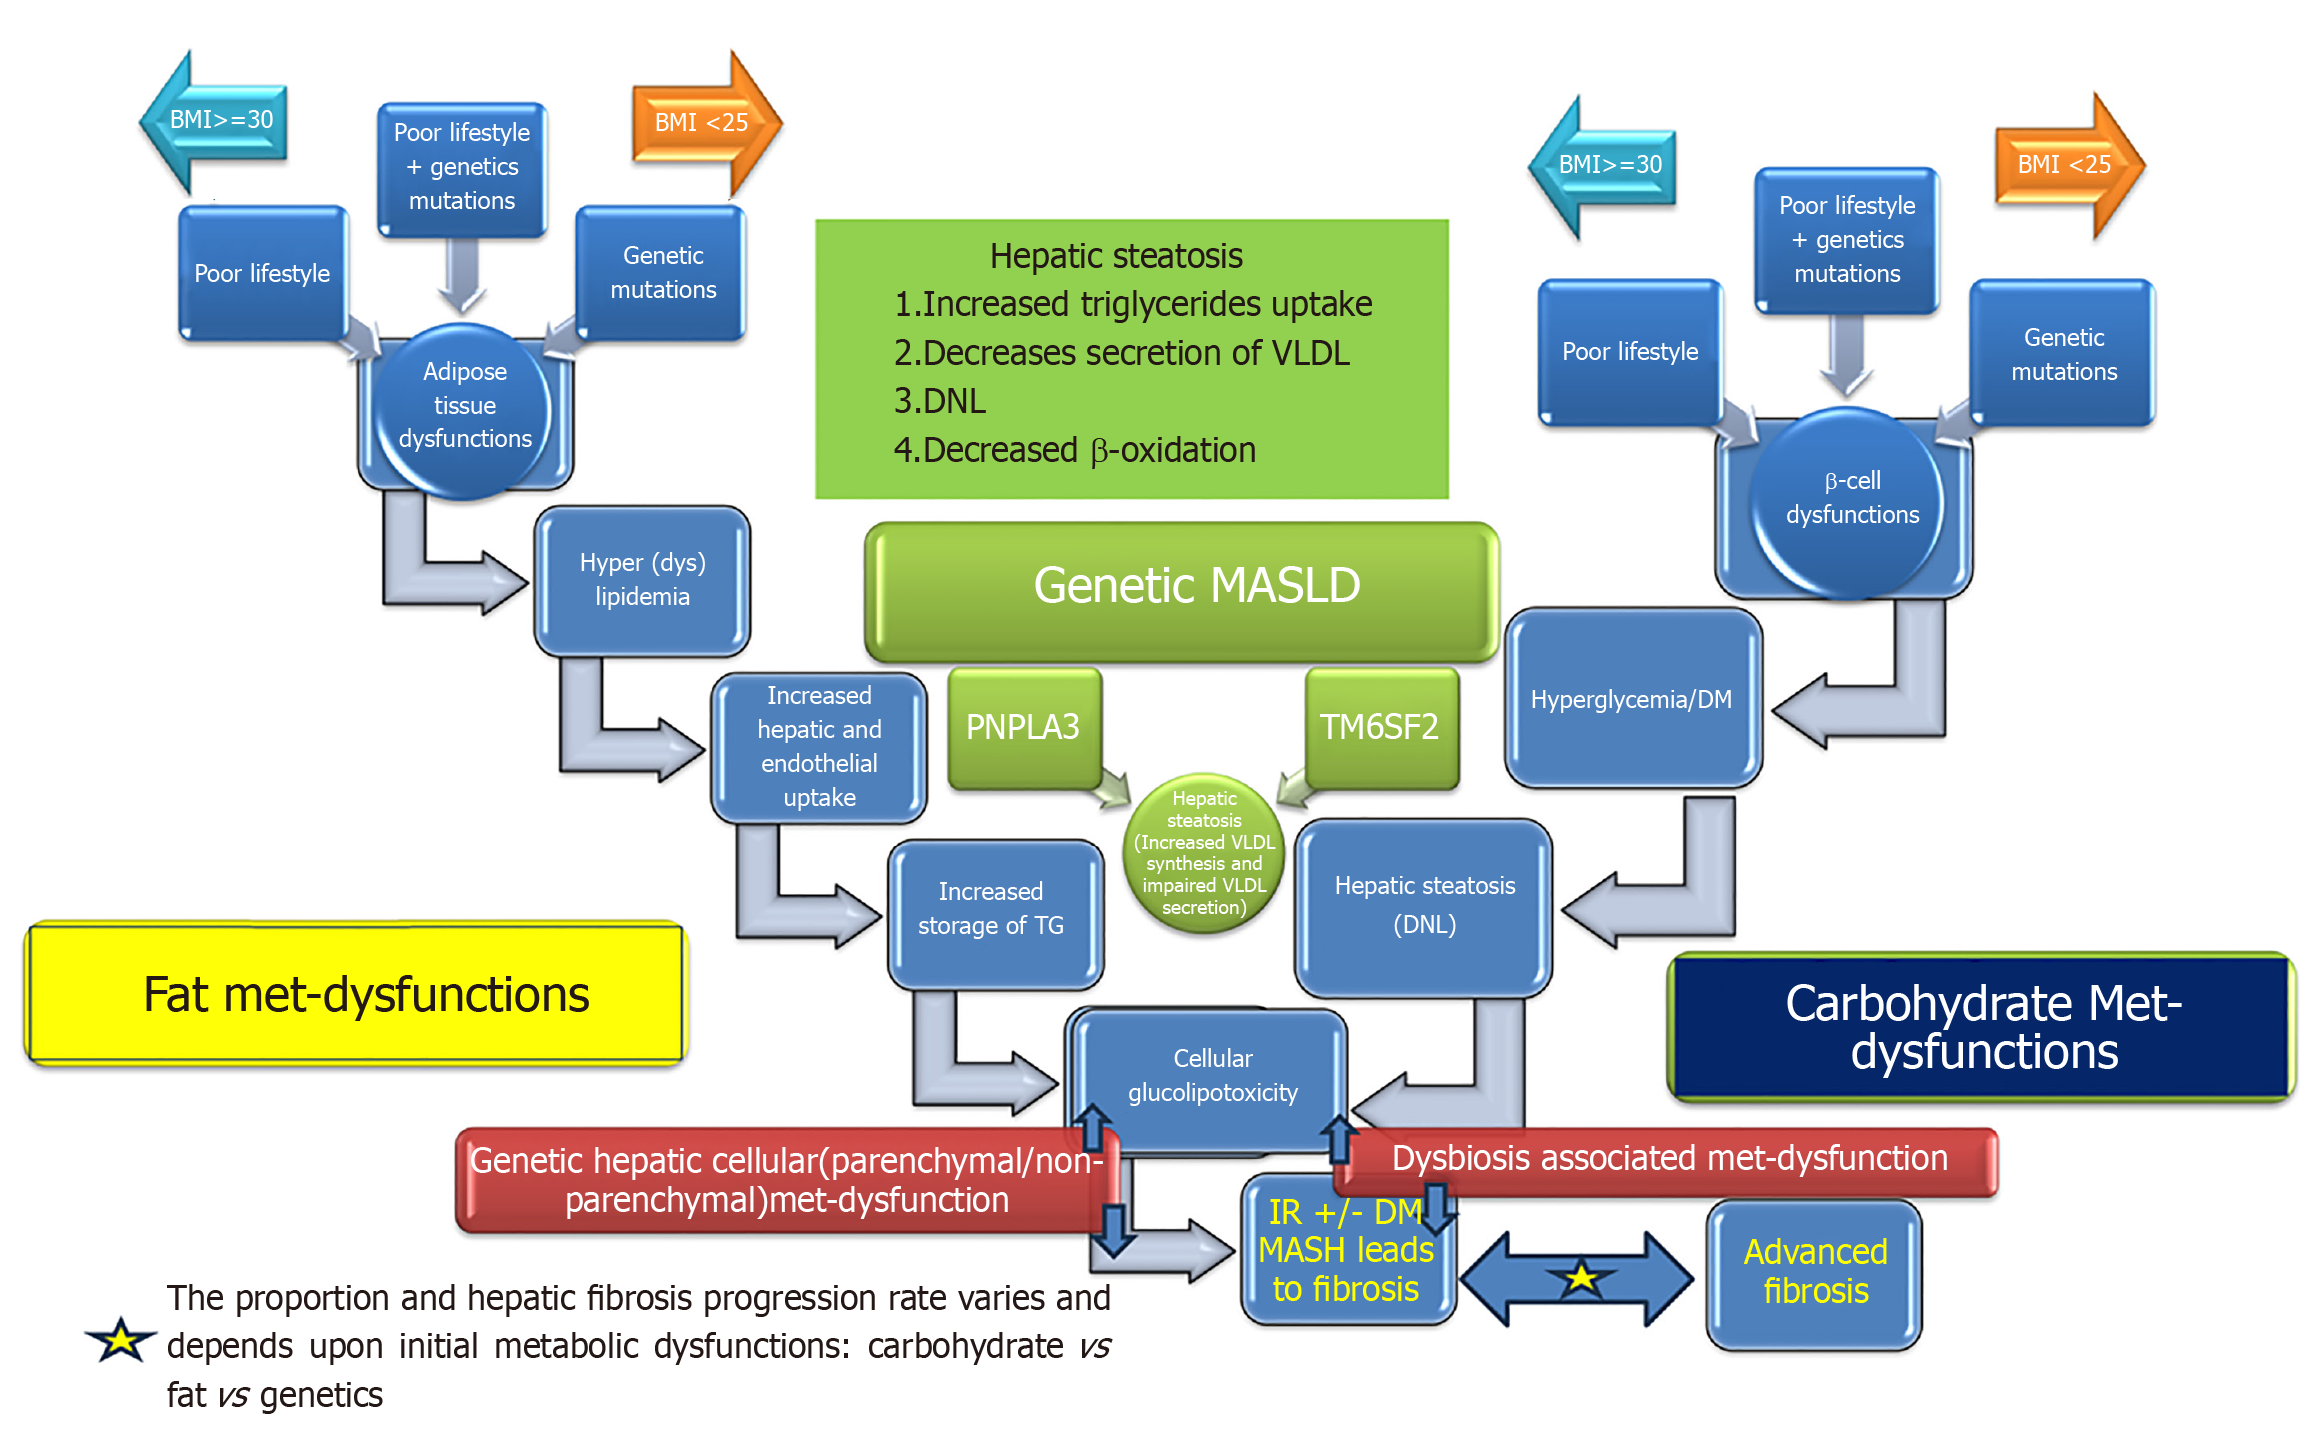
Figure 3 Diversity of pathogenetic mechanisms leading to metabolic dysfunction-associated steatotic liver disease.
MASLD: Metabolic dysfunction-associated steatotic liver disease; DNL: De novo lipogenesis.
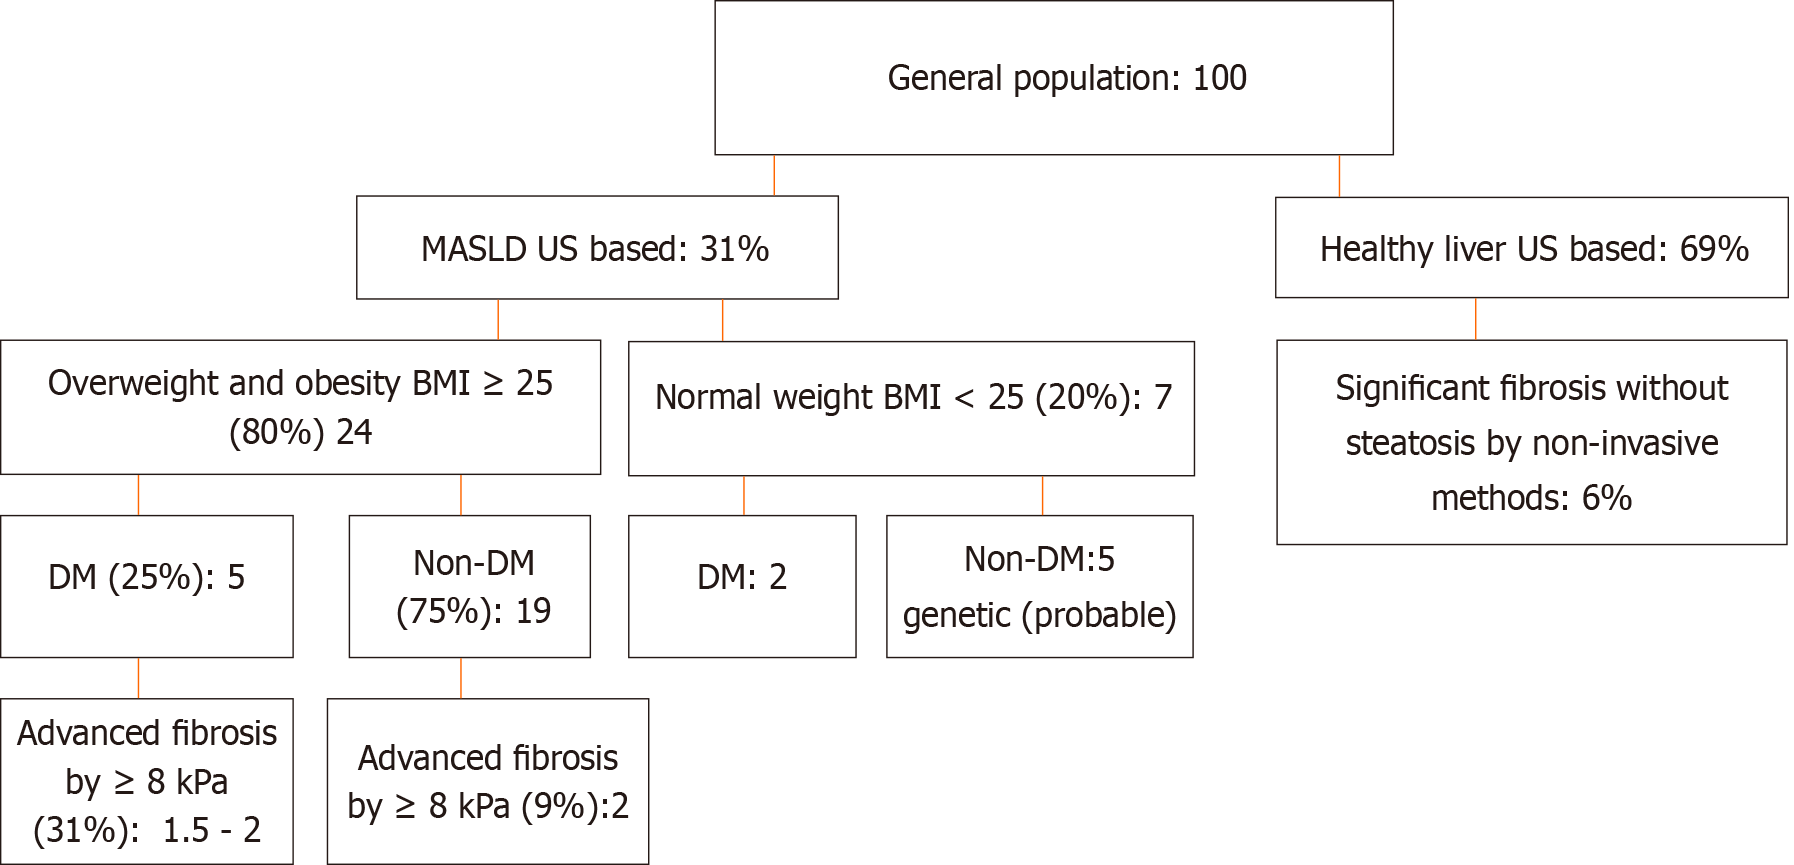
Figure 4 Estimated prevalence of metabolic dysfunction-associated steatotic liver disease subtypes.
MASLD: Metabolic dysfunction-associated Steatotic liver disease, US: Ultrasound: DM: Diabetes mellitus; BMI: Body mass index.
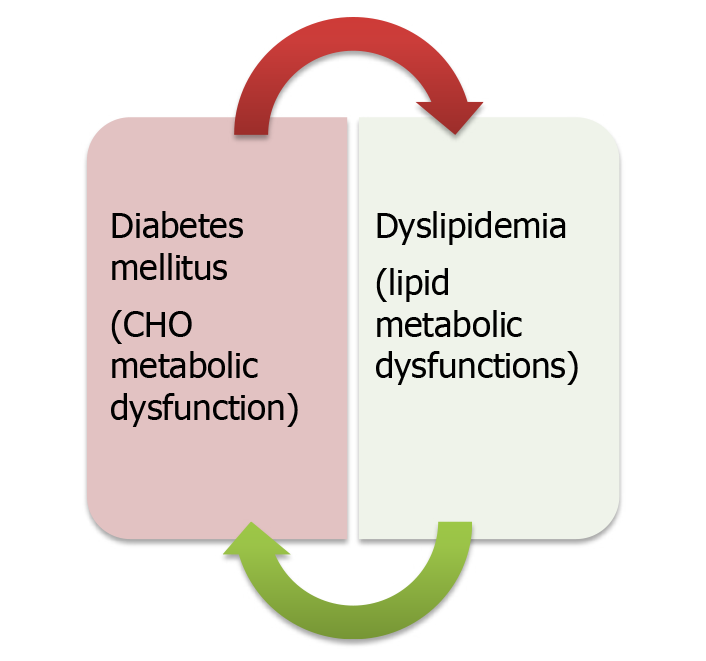
Figure 5
Bidirectional connection between two pathogenetic pathways leading to insulin resistance.
- Citation: Habib S. Metabolic dysfunction-associated steatotic liver disease heterogeneity: Need of subtyping. World J Gastrointest Pathophysiol 2024; 15(2): 92791
- URL: https://www.wjgnet.com/2150-5330/full/v15/i2/92791.htm
- DOI: https://dx.doi.org/10.4291/wjgp.v15.i2.92791


