Copyright
©The Author(s) 2024.
World J Gastrointest Pathophysiol. Apr 22, 2024; 15(1): 91100
Published online Apr 22, 2024. doi: 10.4291/wjgp.v15.i1.91100
Published online Apr 22, 2024. doi: 10.4291/wjgp.v15.i1.91100
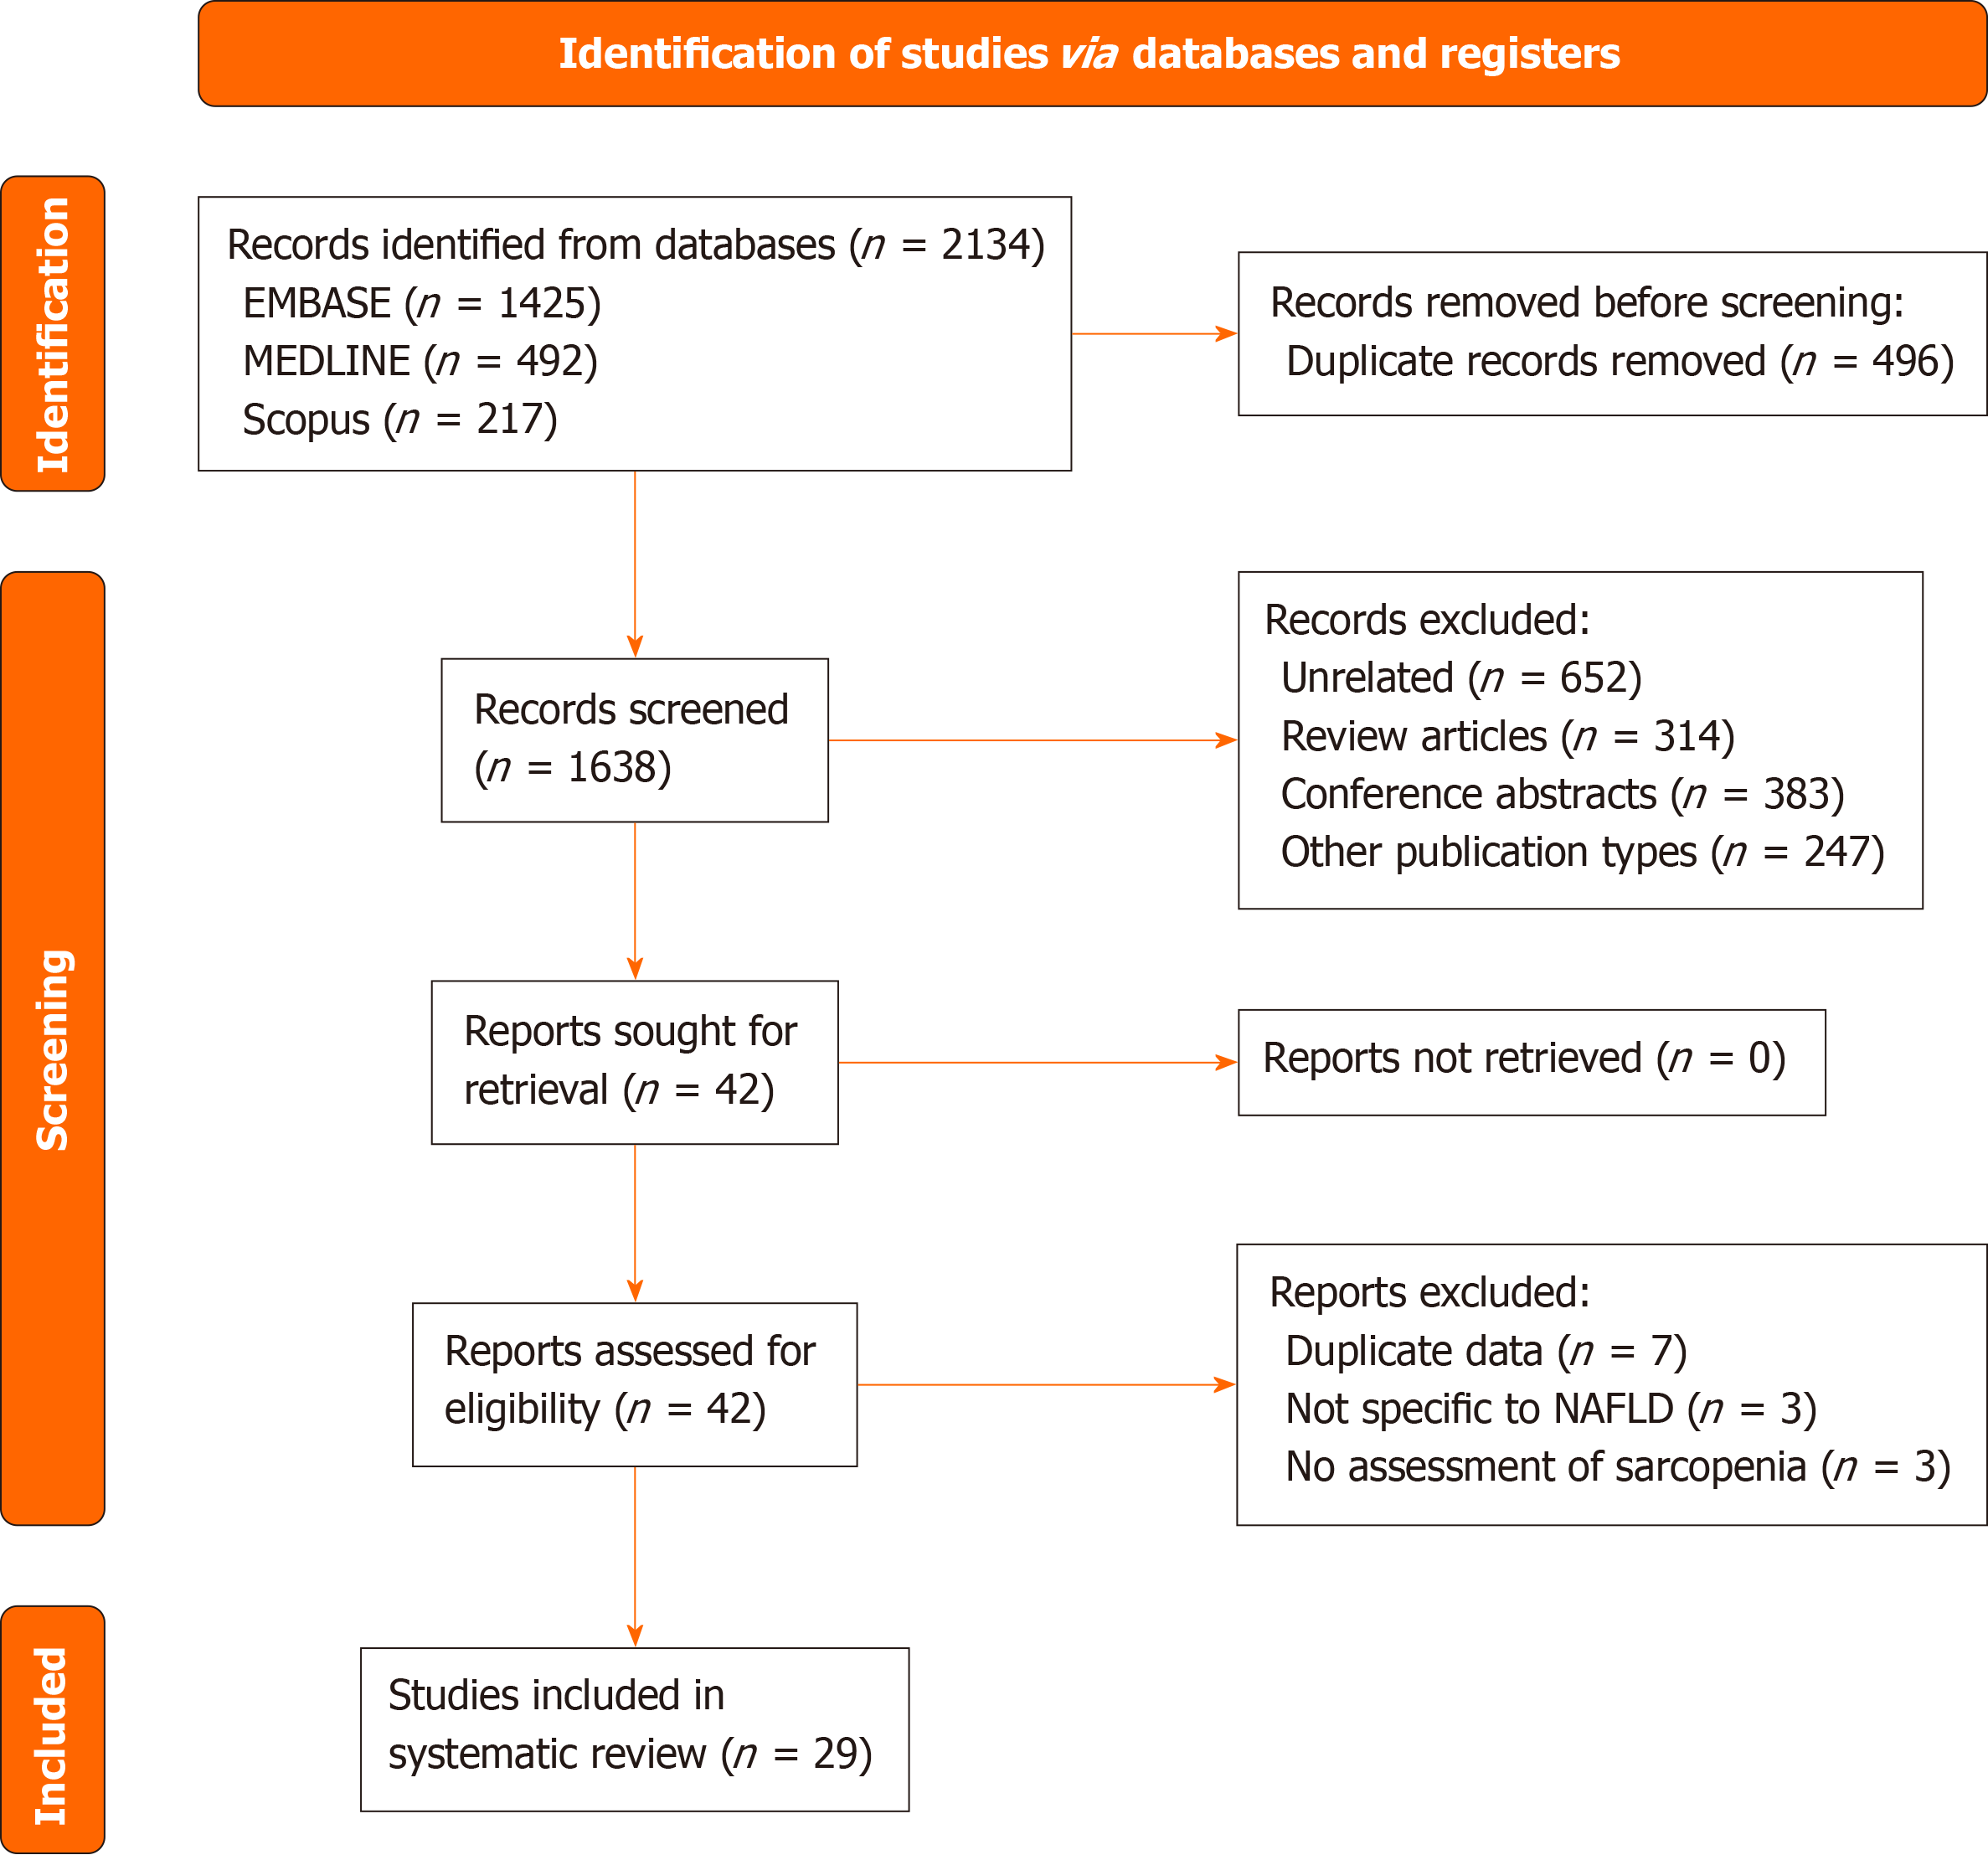
Figure 1 PRISMA flowchart for study identification, selection, and inclusion process.
NAFLD: Nonalcoholic fatty liver disease.
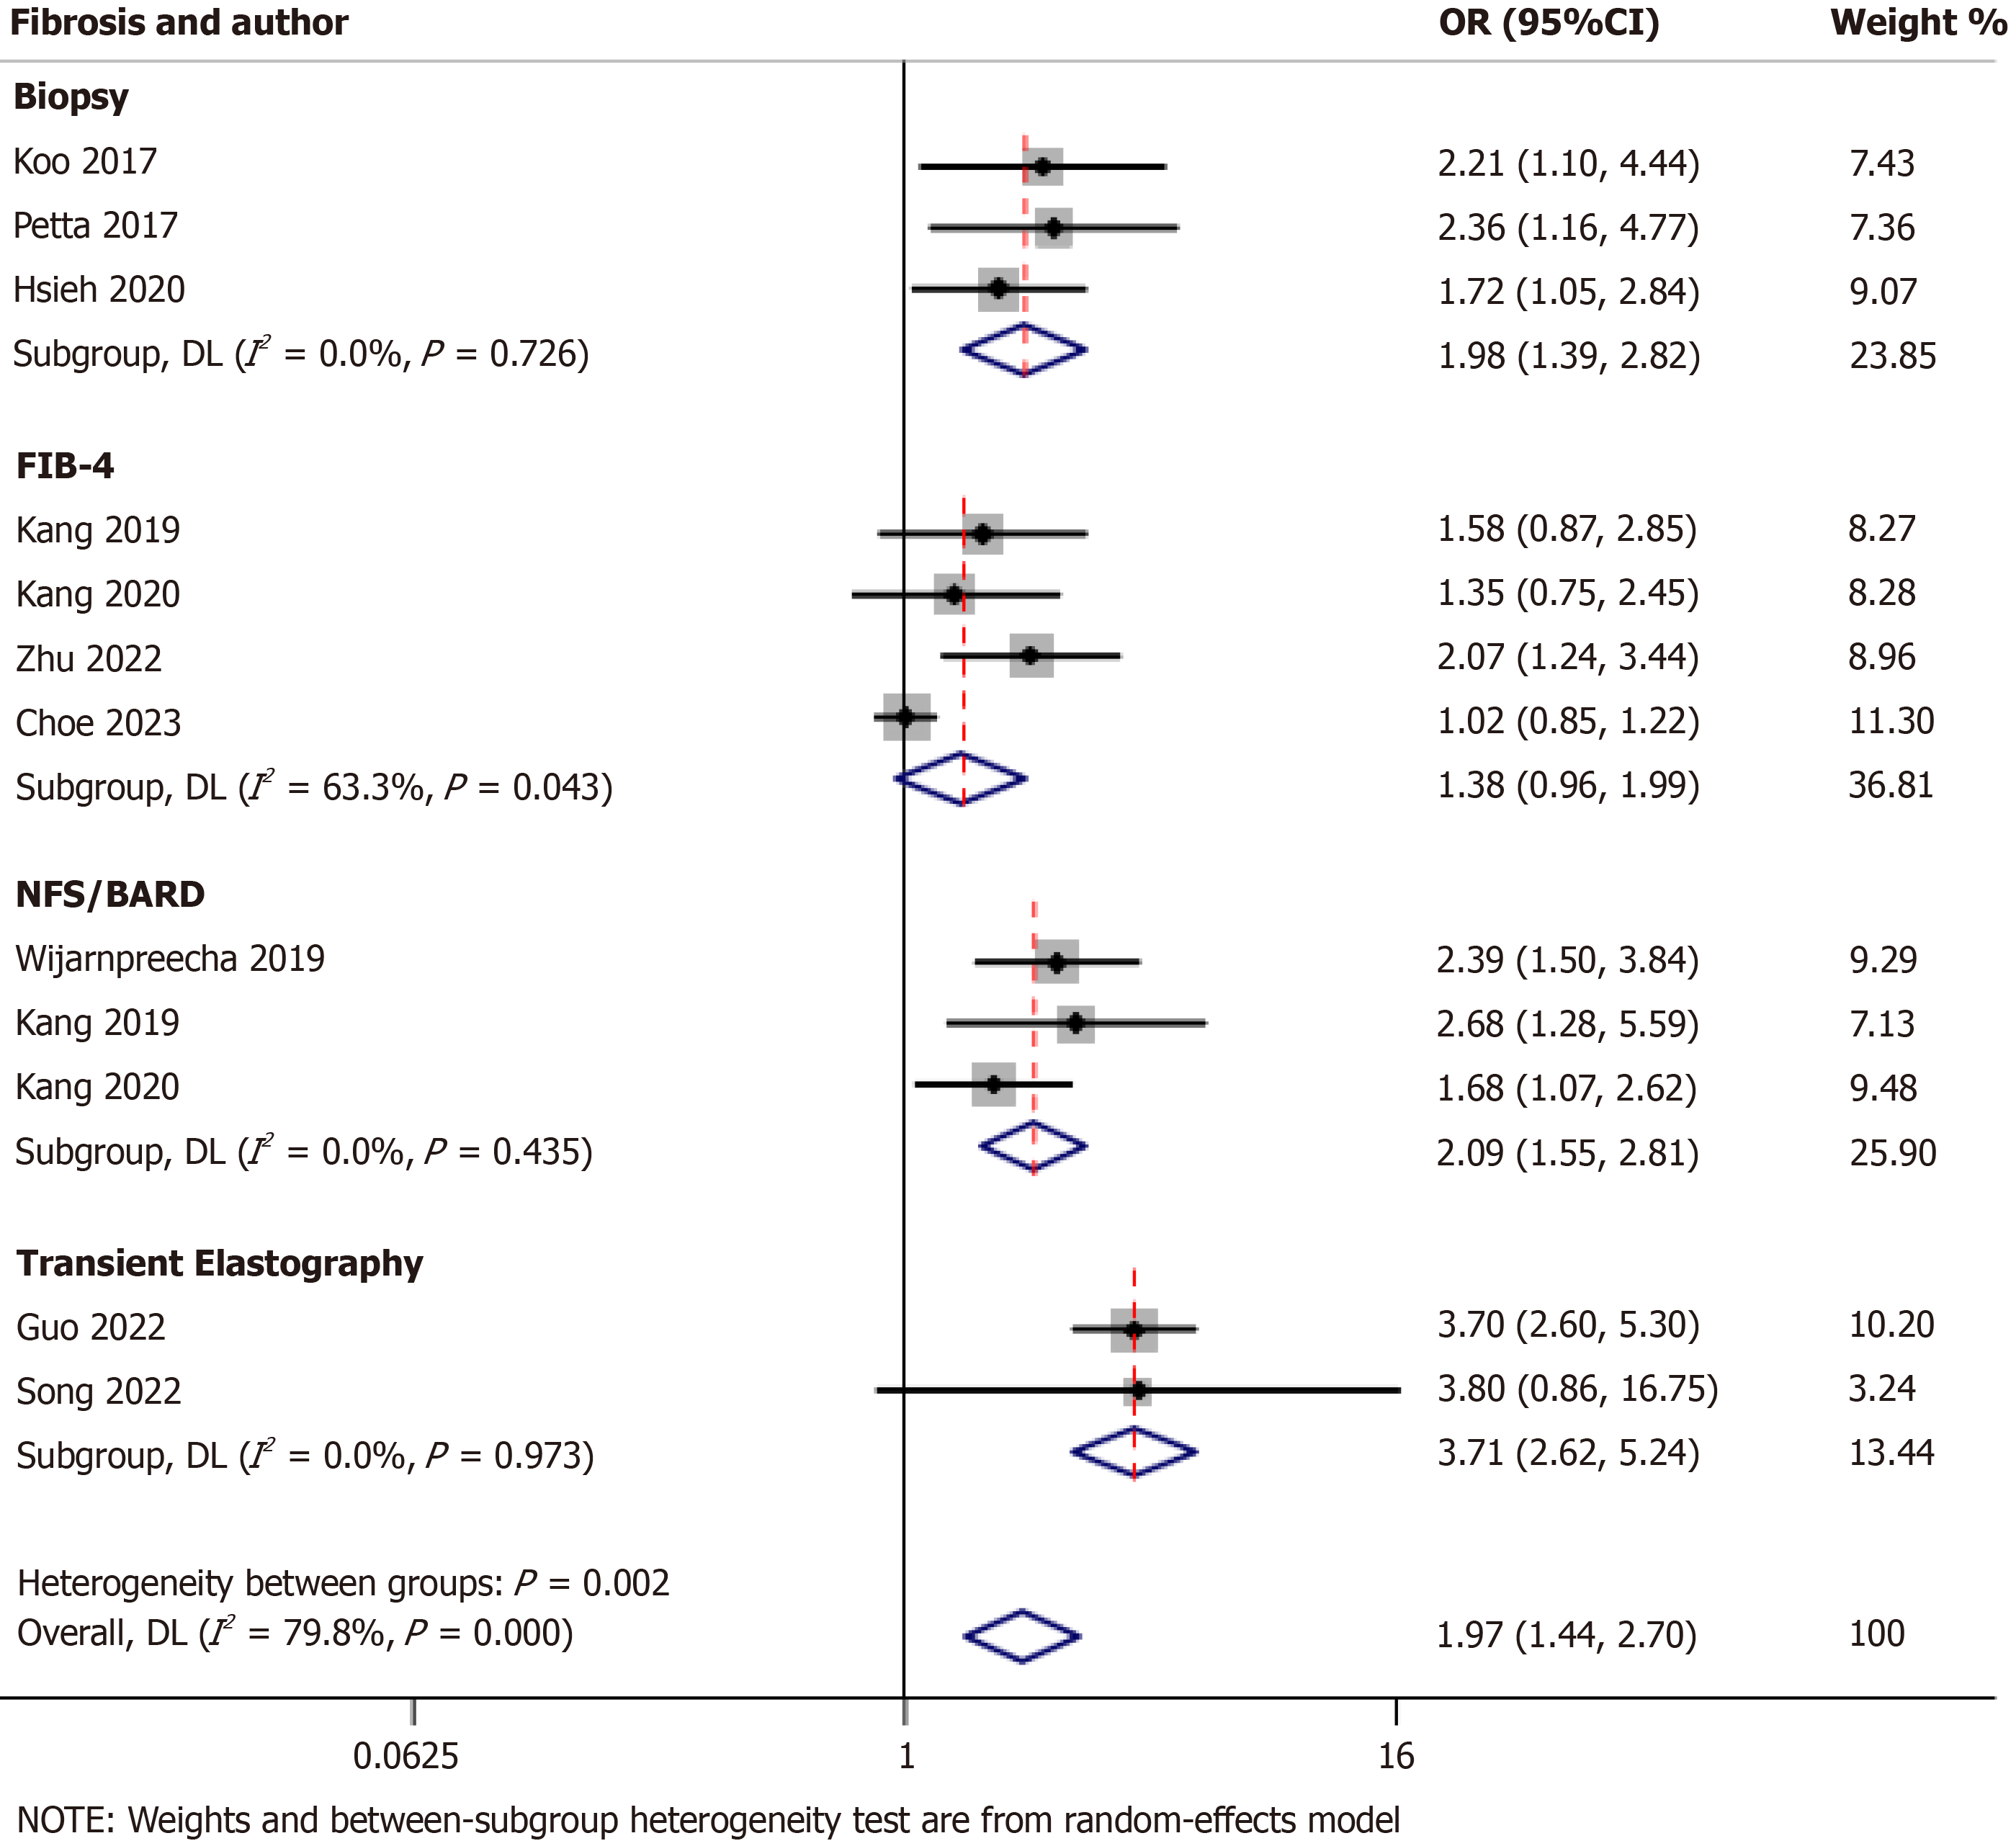
Figure 2 Forest plot showing the odds of advanced fibrosis with sarcopenia in patients with non-alcoholic fatty liver disease with subgroup analysis based on the method of fibrosis assessment.
OR: Odds ratio; 95%CI: 95% confidence interval; FIB-4: Fibrosis-4; NFS/BARD: Non-alcoholic fatty liver disease fibrosis scores/body mass index, the ratio of aspartate aminotransferase to alanine aminotransferase, diabetes; DL: DerSimonian and Laird.
- Citation: Giri S, Anirvan P, Angadi S, Singh A, Lavekar A. Prevalence and outcome of sarcopenia in non-alcoholic fatty liver disease. World J Gastrointest Pathophysiol 2024; 15(1): 91100
- URL: https://www.wjgnet.com/2150-5330/full/v15/i1/91100.htm
- DOI: https://dx.doi.org/10.4291/wjgp.v15.i1.91100


