INTRODUCTION
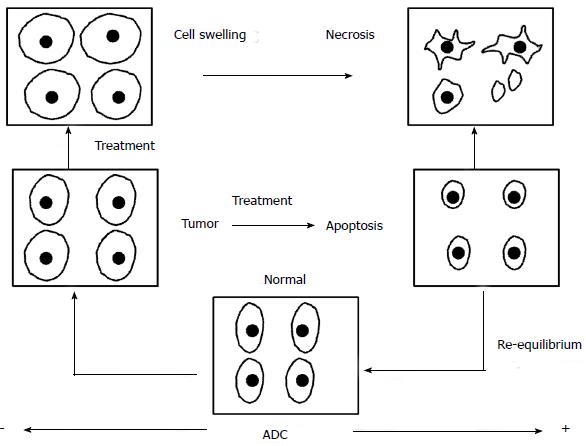
“Oncology” is a multi-disciplinary science, which requires inputs from various streams for optimal patient management. Humongous progress in the treatment modalities available and the increasing need to provide functional information in addition to the morphological data; has led to leaping progress in the field of imaging. Magnetic resonance imaging (MRI) has undergone tremendous progress with various newer MR techniques providing vital functional information and becoming a cornerstone in “radiomics or radiogenomics”[1-3]. Diffusion-weighted imaging (DWI) is capitalizes on tendency of water protons to diffuse randomly in a given system. This technique has revolutionized oncological imaging, by giving vital qualitative and quantitative information regarding tumor biology which helps in detection, characterization and post treatment surveillance of the lesions (Figure 1).
Figure 1 Diffusion imaging in oncology.
The pictorial diagram depicts the diffusion changes and corresponding ADC values in correlation to the pre and post-treatment tumor microenvironment. Increased cell density in the tumor tissue leads to low ADC values as compared to the normal tissue. When subjected to antitumor therapy the cells undergo swelling in the immediate post-treatment phase which leads to further decrease in the ADC values. Once the cell death cycle sets in the cell membranes are more permeable and diffusivity increases which leads to higher ADC values. This ADC normalizes during the healing phase. ADC: Apparent diffusion coefficient.
DWI imaging challenges the notion that “one size fits all” and is becoming an integral part of “personalized oncology”[1,2]. DWI is one of the most recent, reliable and robust imaging biomarkers for oncological imaging[1,4,5]. The tremendous progress in MRI like higher strength of magnets used, stronger and faster gradients, multichannel coils, echoplanar imaging, faster and improved analytical software’s, etc. has expedited advancement in the acquisition of the diffusion weighted images and hence expanded the scope of DWI, especially in oncology[1,4,5].
BASIC PRINCIPLE
DWI is based on the principle of “Brownian motion”; which states that water protons have a tendency to diffuse randomly in space[4,5]. The backbone of DWI is Stejskal Tanner sequence[6], which comprises of a spin echo sequence with diffusion gradients applied before and after 180-degree pulse. The magnitude of diffusion weighting is denoted by the “b value”, an operator selected parameter which depends on the amplitude (G), separation (Δ) and duration (δ) of the diffusion gradients. The higher the “b value”, the higher the diffusion effects, which is achieved by increasing the gradient amplitude and duration and by widening the interval between the gradient pulses. The formula for “b” value is stated as
b = γ2 G2 δ2 (Δ - δ/3); (where γ is the gyromagnetic ratio)
A measure of diffusion is “apparent diffusion coefficient (ADC)”[5,6]. The ADC values are calculated from “b value zero” and using various higher “b values” and displayed as an ADC map. ADC maps are generally correlated with the DWI images to confirm diffusion restriction and negate the “T2 shine through effect”. The DWI images can be further analyzed quantitatively by assessing the ADC values. This signifies the extent of diffusion restriction and hence, is an objective evaluation tool.
Various other analytical ways are used like the ADC histogram mapping or the ADC slope analysis which gives a qualitative as well quantitative impression of the ADC in the suspicious area and comparative assessment between normal and suspicious area respectively[7,8]. Colored maps give a better qualitative assessment of the tumor diffusivity and helps detect subtle changes in the tumor microenvironment which might be overlooked on the grey scale ADC maps. In our experience colored ADC maps are superior to the grey scale maps; especially in sub-centimeter sized lesions, and follow-up response assessment imaging[1]. Thus, DWI forms an integral part of present era’s oncological imaging. We hereby present the various non-neuro applications of DWI in oncological imaging with a case based approach.
APPLICATIONS OF DWI IN ONCOLOGY
Head and neck tumors
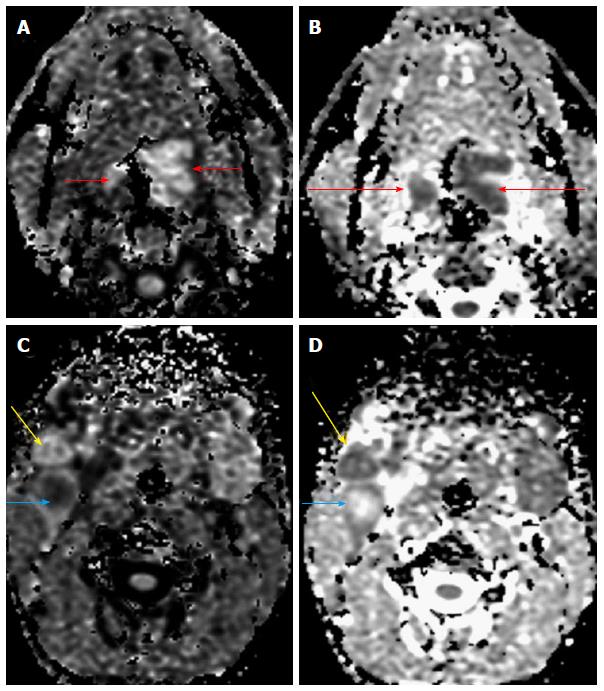
“Head and neck tumors” constitute the sixth most common cancer worldwide, overall accounting for approximately 560000 new cases worldwide annually[9]. DWI has been evaluated and applied extensively in head and neck imaging. Many studies have advocated the use of DWI in characterization of head and neck tumors (Figure 2)[10,11]. Srinivasan et al[11] concluded that the mean ADC value of malignant tumors was significantly lower than the benign lesions (1.071 ± 0.293 × 10⁻³ mm2/s; 95%CI: 0.864-1.277, respectively and 1.505 ± 0.487 × 10⁻³ mm2/s; 95%CI: 1.305-1.706), and recommended a threshold value of 1.3 × 10⁻³ mm2/s for differentiation between benign and malignant tumors on 3 T[11]. They also reported that lymphomas have significantly lower ADC values than carcinomas, which in turn, have significantly lower ADC values than benign solid tumors. However, studies have found some overlap in the ADC values of these lesions and hence, caution needs to be executed when considering ADC values in isolation while characterizing a lesion[12,13].
Figure 2 A 70-year-old male presented with a lesion in the base of tongue.
Diffusion weighted imaging revealed restricted diffusion (A) in the primary lesion (short arrows) with reduced ADC values (B, long arrows). Restricted diffusion was also noted in the two right level II nodes with reduced ADC values (C and D) indicating nodal metastases (yellow and blue arrows). One of the nodes, showed raised central ADC values suggestive of necrosis (blue arrow). Biopsy of the primary lesion revealed squamous cell carcinoma. ADC: Apparent diffusion coefficient.
DWI contributes in predicting prognosis, since low pretreatment ADC values have been found to predict a favorable response to chemo-radiotherapy[13,14]. DWI has also proved useful in differentiating post treatment changes from residual tumor or tumor recurrence[15]. Tumor recurrence comprises of densely packed cells and hence reduced intercellular space. This restricts water proton motion and hence shows decreased ADC values. Post therapy changes are less cellular and with increased interstitial space; hence the higher ADC values[16,17]. Numerous studies have shown the potential of 2-deoxy-2[F-18] fluoro-D-glucose positron emission tomography (FDG-PET) alone or hybrid PET/CT, in evaluating residual/recurrent head and neck tumors[14,18]. However, PET results are confounded by the local inflammation post treatment, especially in early post treatment phase in nasopharyngeal cancers[19,20]. Post treatment surveillance is routinely done by morphological imaging techniques like CT/MRI. Both of these modalities have low diagnostic sensitivity and accuracy. DWI has proved to be a useful biomarker for assessing treatment response in head and neck cancer. Pretreatment primary tumor SUV (max) and ADC values have been shown to correlate significantly and negatively with a potential to predict disease free survival or disease events of head and neck squamous cell carcinoma[20-23]. Role of DWI imaging has also been explored in characterizing thyroid lesions and initial results suggests that combined multimodality MRI, ultrasound and PET imaging has significant role to play in indeterminate thyroid lesions especially the Bethesda category-III[24-26].
Breast tumors
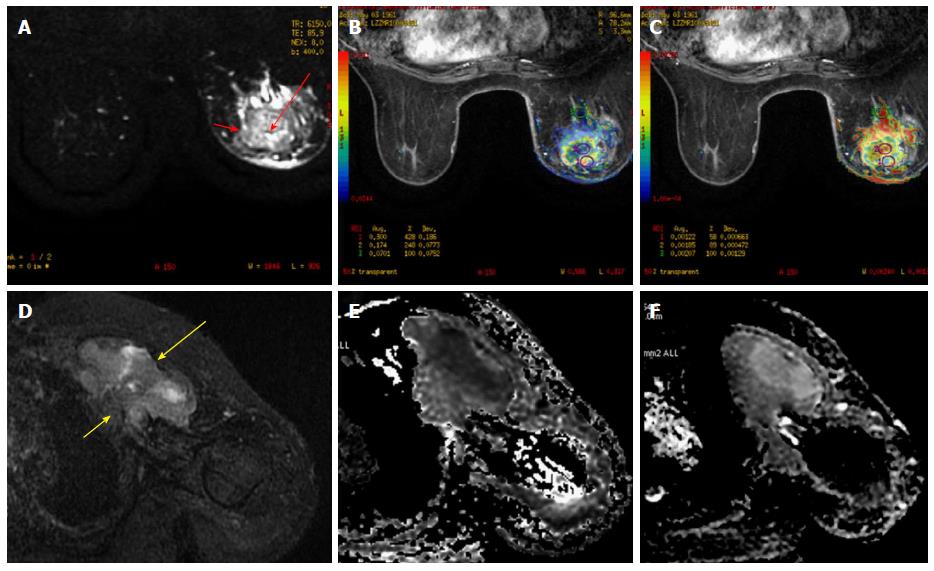
DWI has been successfully applied to evaluate breast malignancies in both females and males (Figure 3). Sinha et al[27] first concluded that the average ADC value of normal breast parenchyma (2.37 × 10⁻³ mm2/s ± 0.27) and benign lesions (2.01 × 10⁻³ mm2/s ± 0.46) is significantly higher than that of malignant breast lesions (1.60 × 10⁻³ mm2/s ± 0.36). In atypical lesions diffusion and multiparametric MRI has been found to increase the diagnostic accuracy for characterizing these lesions. Apart from characterizing a lesion as malignant, DWI has also shown promise in gauging the tumor grade[28,29]. Costantini et al[30] concluded that ADC values show an inverse relationship to tumor grade (P < 0.001), when b values of 0 and 1000 s/mm2 are used. The mean ADC value of the “less aggressive” disease (Grade 1 and in-situ lesions) was 1.19 × 10⁻³ mm2/s, while the mean ADC value of the “more aggressive” disease group (Grade 2-Grade 3 invasive carcinomas) was 0.96 × 10⁻³ mm2/s (P < 0.001)[30]. Ei Khouli et al[31] demonstrated a significant correlation between the expression of estrogen receptors and human epidermal growth factor receptor 2 and average ADC value of invasive ductal carcinoma of the breast. Recent studies have evaluated the utility of pre-therapy ADC values of breast cancer in the predicting tumor response to neo-adjuvant chemotherapy[32]. Park et al[33] found that the pretherapy ADC values in responders was significantly lesser than that in non-responders and suggested a cutoff value of 1.17 × 10⁻³ mm2/s (sensitivity of 94%, specificity of 71%). DWI with ADC quantification has been found to be more contributory in evaluating tumor response to neo-adjuvant chemotherapy than morphologic imaging parameters such as tumor volume and dynamic contrast-enhanced MRI parameters[34,35].
Figure 3 A 51-year-old female presented with a lump in the left breast.
A: FS T2 weighted images revealed a well-defined rounded mass with smooth margins in the left breast with central hyperintensity (long red arrow) and a hypointense rim (short red arrow). Diffusion weighted imaging (B) revealed restricted diffusion in the periphery of the lesion (ROI 1) with reduced ADC values (C). The center of the lesion showed facilitated diffusion suggestive of necrotic areas (ROI 2). Biopsy revealed invasive ductal carcinoma; D: FS T2 weighted images revealed a well-defined heterogeneously hyperintense irregular mass in the left breast (long yellow arrow) with chest wall invasion (short yellow arrow). Diffusion weighted imaging (E) revealed restricted diffusion with reduced ADC values (F). Biopsy revealed invasive ductal carcinoma. ADC: Apparent diffusion coefficient.
Hepatic tumors
Recent advances in technology have enhanced the applications of DWI in liver imaging. Various studies have proven that images obtained using low-b-values (less than 100-150 s/mm2) detect hepatic lesions better than are images obtained at a b value of 0. Parikh et al[36] concluded that at a b value of 50 s/mm2, the sensitivity of DWI for detection of liver lesions was significantly higher than that of conventional T2-weighted imaging (87.7% vs 70.1%, respectively). DWI is also being evaluated as a technique, complementary to contrast imaging for lesion detection. While evaluating 50 hepatocellular carcinoma nodules, Nishie et al[37] showed that the use of superparamagnetic iron oxide-enhanced MRI combined with DWI gives a larger area under the ROC curve, than does the use of the former imaging technique alone (0.870 ± 0.04 vs 0.820 ± 0.05, P =0.025).
DWI contributes to lesion characterization when higher b values (> 500 s/mm2) and quantitative ADC assessment are used. Miller et al[38] reported that the mean ADC values for benign liver lesions was 2.5 × 10⁻³ mm2/s, whereas that of and malignant lesions was 1.52 × 10⁻³ mm2/s. The ADC values however showed overlap between solid benign and malignant lesions, thus making a diagnosis based solely on DWI difficult (Figures 4 and 5). False-positive results may be obtained due to T2 shine-through effect or cellular benign lesions such as adenoma, focal nodular hyperplasia, or abscesses; whereas false-negative results may be obtained in necrotic or cystic tumors such as mucinous adenocarcinoma or well-differentiated hepatocellular adenocarcinoma[39,40].
Figure 4 Pre-therapy magnetic resonance imaging in 57-year-old patient with hepatocellular carcinoma.
A: DCE MR of liver showed enhancing lesion in segment V, VI, VII and VIIII of the liver (long arrow-A) with enhancing portal vein thrombus (short white arrow-A). Diffusion weighted imaging revealed restricted diffusion in the hepatic lesion (long arrow-B) and the portal vein thrombus (short arrow-B) with reduced ADC values (B and C). Biopsy revealed hepatocellular carcinoma. Thus DWI helps in confirming the diagnosis of malignant portal vein thrombosis. ADC: Apparent diffusion coefficient; MR: Magnetic resonance; DWI: Diffusion-weighted imaging.
Figure 5 A 45-year-old female with ovarian malignancy, post therapy, presented with sudden onset of abdominal pain and high grade fever.
A: Axial T2 W images showed well defined lesions in the right lobe of liver with central hyperintensity and hypointense rim (arrow). However, DWI showed restricted diffusion (B) in the periphery of the lesion with reduced ADC values (C) with central necrotic component which showed facilitated diffusion. The case was diagnosed as necrotic metastases. Final histopathology was hepatic metastasis. ADC: Apparent diffusion coefficient; DWI: Diffusion-weighted imaging.
DWI has also proved to be useful in qualitatively and quantitatively assessing post-chemo-embolization/radio-embolization tumor response[41,42]. Qualitative analysis is based on visually assessed changes in signal intensity in the form of increase in ADC signal in lesions that have shown response to treatment or new areas of abnormal signal intensity due to disease progression. Post-treatment DWI shows different signal intensity behaviors depending on the tissue component and the type of therapy used. After transarterial chemoembolization or radioembolization, the ADC values of a hepatocellular carcinoma may show a transient early decrease followed by increase. Transient decrease in ADC values may be due to cellular swelling, decreased extracellular space or decreased blood flow. This is followed by consistent increase, representing necrotic changes[41,42].
Pancreatic tumors
A major diagnostic dilemma in pancreatic imaging is to differentiate mass forming pancreatitis from pancreatic tumor[43,44]. Fattahi et al[45] evaluated application of DWI in differentiating mass forming focal pancreatitis from pancreatic tumor and found that pancreatic cancer showed restricted diffusion with ADC values significantly lower than rest of pancreas (1.46 ± 0.18 × 10⁻³ mm2/s vs 2.11 ± 0.32 × 10⁻³ mm2/s, P < 0.0001). However, mass-forming FP showed no restriction of diffusion, without any significant difference between the ADC values of mass-forming focal pancreatitis and the remaining pancreas. Sandrasegaran et al[46] however found no significant difference between the signal intensity on DW images (P = 0.82, P = 0.85) or ADC values (P = 0.51, P = 0.76) between pancreatic cancer and chronic pancreatitis.
Gastrointestinal tumors
Ichikawa et al[47] concluded that DWI (at b value 1000 s/mm2) showed 90.9% sensitivity and 100% specificity for depicting colorectal cancers. Studies have shown DWI to be useful not only in localizing, but also provide information that helps in staging and follow up after therapy of GI tumors (Figures 6 and 7). Extra-serosal spread can be seen on DWI as a hyperintense peri-rectal tumor extension through a thickened wall[48,49]. Involvement of mesorectal fascia in patients with rectal cancer may also be seen as high-signal-intensity tumor extensions into the mesorectal margins. Desmoplastic changes have low signal intensity on both DWI and ADC maps. So, DWI may help distinguish between desmoplastic reaction and tumor extension[50,51]. DWI is also used in assessing patients undergoing rectal cancer treatment and to predict prognosis. DWI can also help distinguish between residual/recurrent cancer and post-RT changes, with low ADC values indicating recurrent disease while higher ADC values representing post-RT changes[52,53]. Addition of DWI to conventional T2-weighted sequences has been found to significantly improve the diagnostic performance of MRI in the evaluation of ypCR and a high ΔADC post-ADC pre (> 0.3 × 10⁻³ mm2/s) is found to be predictor of ypCR (complete response)[53].
Figure 6 A 62-year-old male presented with bleeding per rectum.
(A) Axial post contrast T1W fat suppressed image showed eccentric rectal wall thickening (arrow) which showed restricted diffusion (B) on diffusion weighted images (ROI 1) with reduced ADC values (C) as compared to the adjacent normal rectal wall (ROI 2). Histopathological evaluation revealed adenocarcinoma of rectum.
Figure 7 A 51-year-old male previously treated for rectal malignancy presented with suspected recurrence.
A: Axial T2 W images showed irregular polypoidal mass lesions with necrosis within in the perianal region. However, diffusion weighted images (exponential map image B and apparent diffusion map image C) showed facilitated diffusion (arrowhead, ROI 1) in both the solid polypoidal as well as the necrotic component favoring a benign etiology. A diagnosis of perianal abscess was made and patient underwent debridement which revealed ischiorectal abscess.
Genito-urinary tumors
Renal tumors are commonly evaluated by morphological imaging techniques like CECT and CE-MRI. Detection of enhancing solid components in a renal lesion is highly indicative of a renal neoplasm. However, many renal neoplasms present as necrotic lesions, with few mimicking complex renal cysts. Differentiating these lesions on imaging has obvious therapeutic and prognostic implications. Solid renal tumors have lower ADCs values as compared to the necrotic or cystic tumor tissue, in which the ADCs are lower than those in benign cysts (Figure 8)[54,55]. The recommendation is to perform DW-MRI with a maximum b value ranging from 800 to 1000 s/mm2 at 3.0 T. Also, few studies have reported different ADC values in tumors with differing compositions, thus possibly aiding in characterizing a renal lesion[56]. Zhang et al[54] meta-analysis reported the differences in ADC values between benign renal lesions (2.47 ± 0.81 × 10⁻³ mm2/s) and malignant renal lesions (1.81 ± 0.41 × 10⁻³ mm2/s) with a P value < 0.001. DWI is also studied in bladder malignancies, especially to evaluate the depth of invasion, deciding the T stage of bladder cancer which decides the management protocol[57,58]. Management of urinary bladder cancer is primarily determined on distinguishing superficial tumors (stage T1 or lower) from invasive ones (stage T2 or higher). Takeuchi et al[58] found that the accuracy of determining the T stage diagnosis for T2-weighted images alone was 67%, for T2-weighted plus DW images was 88%, for T2-weighted plus contrast-enhanced images was 79%, and for all three image types together was 92%.
Figure 8 A 61-year-old male presented with hematuria and right sided flank pain.
Superimposed DWI and T2 W images revealed a well-defined right renal mass which showed restricted diffusion (A-white arrow) with low ADC values (B-red arrow) suggestive of malignant mass. Post histopathological evaluation revealed renal cell carcinoma. ADC: Apparent diffusion coefficient; DWI: Diffusion-weighted imaging.
Prostate cancer
Conventional MR has been used in prostate cancer predominantly for staging (to assess Extracapsular spread and seminal vesicle involvement). However, DWI is now also used for assessing tumor location, size, and aggressiveness (Figure 9)[59,60]. Also, the ADC values have been correlated with the Gleason’s score and tumor volume[61]. There has been a significant overlap in the various groups due to which a consistent classification of the tumors according to the aggressiveness is not possible. Despite this, the ADC values do form a surrogate marker of the aggressiveness of the tumor and the total tumor volume[62,63]. The lowest ADC value within tumor (ADCmin) is found to have an inverse correlation with the Gleason score and lower values are seen in tumors with Gleason score 3 + 4 than in the tumors with Gleason score 3 + 3 (0.54 ± 0.11 × 10⁻³ mm2/s vs 0.64 ± 0.12 × 10⁻³ mm2/s, P < 0.05)[61].
Figure 9 A 65-year-old male presented with symptoms of bladder outlet obstruction and raised serum PSA.
DCE-MRI revealed a focal lesion in the central gland on the left side (white arrow in A), with restricted diffusion (white arrow in B) and low ADC values (white arrow in C) suggestive of malignancy. Biopsy revealed prostatic adenocarcinoma. ADC: Apparent diffusion coefficient; MRI: Magnetic resonance imaging.
Gynecological tumors
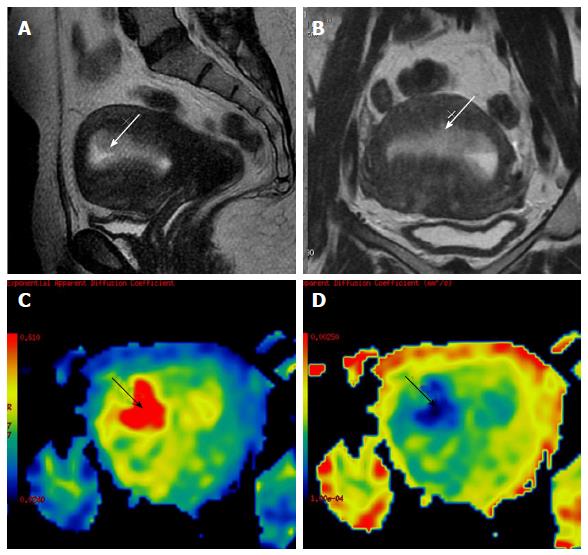
DWI has been evaluated extensively in characterization, management and follow-up female pelvic lesions. Tamai et al[64] found that uterine malignant lesions showed lower ADC values than normal myometrium or benign lesions like leiomyomas (Figure 10). Also, they demonstrated that higher grade tumors showed lower ADC values. DWI has also been fused with conventional T2 W images and used in endometrial cancers to assess the extent of myometrial invasion and thus decide stage of the lesion. Shen et al[65] found that DWI depicted multi-centricity and multi-focality in cases of uterine lesions. DWI has been applied to delineate cervical tumor especially in isointense tumors in young females, or early cervical cancer (Figure 11). A study by Naganawa et al[66] of 12 patients with cervical cancer demonstrated significantly lower mean ADC values in cervical cancer lesions (1.09 ± 0.20 × 10⁻³ mm2/s) than in normal cervical tissue (1.79 ± 0.24 × 10⁻³ mm2/s) (P < 0.0001), findings that suggest the potential use of DW imaging as a tool to differentiate normal from cancerous cervical tissue. Liu et al[67] reported the ADC values of squamous carcinoma to be significantly lesser than those of adenocarcinoma (P = 0.040), and thus proposed the potential ability of DWI to indicate the histologic type of cervical cancer. They showed negative correlation between ADC values of cervical cancer and cellular density (r = -0.711, P = 0.000) and tumor grade (r = -0.778, P = 0.000). However, the results of studies that have used ADC values to distinguish tumor histology are mixed[67].
Figure 10 A 60-year-old female on tamoxifen, presented with post-menopausal bleeding.
MRI revealed a heterogeneously hyperintense lesion in the endometrium (white arrow in A and B) which showed restricted diffusion (black arrow in C) with low ADC values (black arrow in D). Surgery was performed and histopathology showed tamoxifen induced hyperplasia harboring carcinoma of the endometrium. ADC: Apparent diffusion coefficient; MRI: Magnetic resonance imaging.
Figure 11 A 59-year-old female presented with post-menopausal bleeding.
MRI revealed heterogeneously enhancing mass in the cervix which showed restricted diffusion (A-ROI 1) with low ADC (B-ROI-1) values and higher values on diffusion histogram maps (C) suggestive of malignancy. Biopsy revealed squamous cell carcinoma of the cervix. ADC: Apparent diffusion coefficient; MRI: Magnetic resonance imaging.
Mahajan et al[68] found that in operated cervix cancer, the accuracy of diagnosing vaginal vault or local recurrent lesions was higher at combined multiparametric MRI and conventional MRI (100%) than at conventional MRI (70%) or multiparametric MRI (96.7%) alone. Restricted diffusion was seen in 23 of the 24 cases and all the benign cases showed facilitated diffusion. They found that the median ADC of recurrent carcinomas (1.23 ± 0.20 × 10⁻³ mm2/s) was significantly lower than benign vault tissue (2.56 ± 0.46 × 10⁻³ mm2/s) (P < 0.001)[68]. Diffusion has also shown to aid in predicting prognosis, follow-up of these patients and detects metastatic disease with higher degree of accuracy[69,70]. Wang et al[71] metaanalysis showed that DWI has prognostic implications and serves as a biological marker for survival in cervical cancer. Tumors with low ADC were associated with higher risks of tumor recurrence[71].
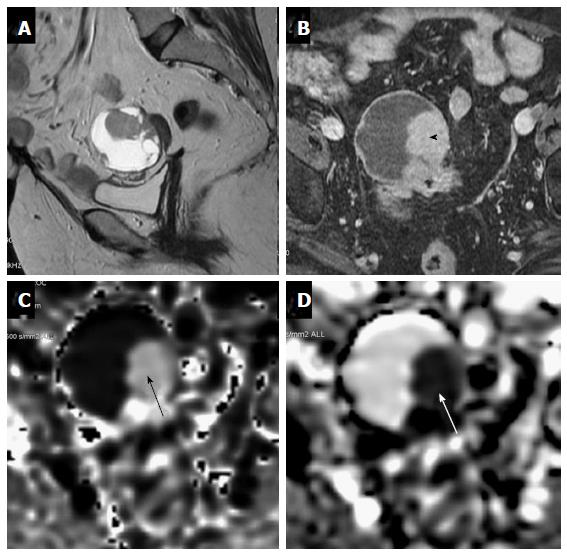
DWI has been applied to evaluate ovarian lesions[72,73]. Thomassin-Naggara et al[74] found that complex solid cystic ovarian lesions with solid components showing restricted diffusion turned out to be malignant. However, restricted diffusion is also seen in benign ovarian lesions like benign cystic teratoma, endometriomas, hemorrhagic ovarian cysts and ovarian cysts with high content of mucin[75,76] (Figure 12). Peritoneal metastases can also be assessed with DWI, presence of which precludes surgery[77]. The sensitivity and specificity of CT and conventional MRI decreases when a peritoneal deposit is smaller than 1 cm. DWI may depict small peritoneal deposits with high sensitivity because signal from the normal surrounding organs, ascites, and bowel is suppressed. A diffuse pattern of hyperintensity in the peritoneum may also be seen in patients with extensive peritoneal disease[77,78]. Compared to surgical findings, DW-MRI has reported sensitivities of 71%-90% and specificities of 74%-96% for detecting peritoneal dissemination in gynecologic cancers[77].
Figure 12 A 63-year-old female under evaluation for ovarian mass.
(A) Sagittal T2W images showing a well-defined complex ovarian cyst showing hyperintense solid component which shows post contrast enhancement (black arrowhead-B) and restricted diffusion (black arrow-C) with low ADC values (white arrow-D). Restricted diffusion in the solid component was suggestive of this lesion to be a malignant ovarian mass. Final histopathology revealed mucinous cystadenocarcinoma..
NODAL EVALUATION
Nodal evaluation is vital in the management of malignancies. Malignant infiltration of nodes leads to distorted nodal architecture, which may subsequently cause alterations in water diffusivity (Figure 2)[79,80]. Thus, DWI has been largely evaluated in characterization of the nodes in oncology. Many studies have reported significant reduction in ADC values in metastatic nodes compared to benign lymph nodes[80,81]. Vandecaveye et al[82] even found that DWI had a sensitivity of 76% and a specificity of 94% in the detection of subcentimetre sized (4-9 mm) nodes compared to the conventional MRI sequence, which had a sensitivity of 7% and a specificity of 99.5% for the same. In a study done by Sumi et al[83], however, they reported significantly higher ADC values in metastatic lymph nodes than in benign nodes, which may be due to inclusion of a large number of necrotic regions within the metastatic nodes in this study.
DWI can also contribute in evaluating enlarged necrotic nodes; to differentiate between nodes associated with inflammation or neoplastic diseases[84,85]. Koc et al[85] reported that abscesses and necrotic lymphadenitis appear hyperintense on DWI and exhibit lower ADC values compared to the necrotic nodal metastases that appear hypo-intense on DWI with higher ADC. A recent metaanalysis by Zhou et al[80] on role of DW-MRI in detecting nodal metastases reported a pooled sensitivity and specificity of 0.82 (95%CI: 0.76-0.87) and 0.92 (95%CI: 0.88-0.94), respectively.
Bone tumors
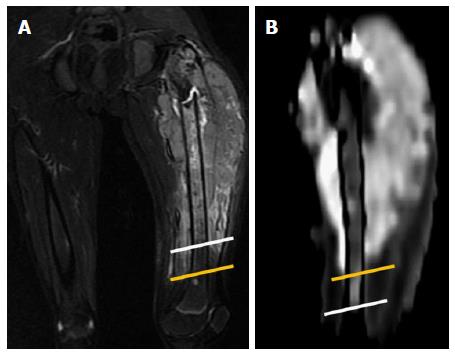
DWI has been applied in detection and characterization of bone and soft tissue tumors[86,87]. Baur et al[88] first demonstrated in 1998 that DWI can help in differentiating osteoporotic and neoplastic vertebral fractures, with the neoplastic marrow showing restricted diffusion. Also, DWI has been applied to differentiate benign bone disease, bone tumors and tumor like bone lesions, for instance Ewing’s sarcoma from osteomyelitis and for predicting length of tumor infiltrated marrow (Figure 13)[89]. Moreover, measurement of ADC values can be used in the follow-up of tumors and their response to therapy[89,90]. ADC values greater than 0.77 × 10⁻³ mm2/s is suggestive of neoplastic marrow infiltration. This cut-off value is shown to have a sensitivity of 85% and specificity of 90% for predicting neoplastic marrow infiltration. For soft tissue tumors, a threshold ADC value of 1.34 × 10⁻³ mm2/s is used in differentiating benign from malignant masses with an overall accuracy of 91%[90]. DWI is also found to have a diagnostic value in evaluating patients with multiple myeloma. The reported mean ADCs for normal marrow, focal, and diffuse marrow involvement pattern is 0.360 × 10⁻³ mm2/s ± 0.110, 1.046 × 10⁻³ mm2/s ± 0.232, and 0.770 × 10⁻³ mm2/s ± 0.135, respectively[91].
Figure 13 Case of Ewing’s sarcoma in a 12-year-old boy.
A: Coronal T2W-FS image showing altered marrow signal intensity in the femoral diaphysis (white line representing inferior extent) with associated soft tissue mass and surrounding edema (yellow line representing inferior extent); B: DWI shows restricted diffusion in the involved marrow which was significantly less (inferior extent represented by the white line) than that noted on the T2w Images thus differentiating the marrow edema from marrow infiltration and soft tissue edema from infiltration (yellow line representing inferior extent). The soft tissue mass shows restricted diffusion, suggestive of infiltrative tumor mass and not reactive inflammation. DWI: Diffusion-weighted imaging.
RECENT ADVANCES
Whole body MR-DWI
WB-MR-DWI compliments PET imaging and has been found to contribute significantly in diagnosis, staging and follow-up imaging of many cancers[92,93]. It is a fast and robust technique for tumor-detection (primary tumor, residual disease, recurrence, and metastases), tumor distribution/burden, characterization and treatment monitoring, which provides high tumor to background contrast[94,95]. WB-DWI has been proven to be a “one stop shop” imaging tool metastatic workup both in pediatric as well as adult tumors and also in hematological malignancies such as lymphoma[95,96]. One such technique which has been extensively developed and used in clinic is Diffusion-weighted whole-body imaging with background body signal suppression (DWIBS), which can be employed for whole body DWI in free breathing and provides high SNR. The most important clinical applications are: Relatively small primary and metastatic lesions can be accurately detected with this technique due to whole body coverage and high SNR. Other applications are similar to that of DWI like lymphoma diagnosis, staging, monitoring response to therapy and detection of tumor persistence or recurrence as opposed to post-therapeutic change[97,98].
Intravoxel incoherent motion in diffusion-weighted MRI
When DWI is performed in well-perfused tissues at low b values (e.g., 0-100 s/mm2), both the water diffusion and microcirculation within the normal capillary network result in phase dispersion at DW-MRI and contribute to the measured signal attenuation. Le Bihan et al[99] called the behavior of protons that display signal attenuation at DW-MRI as showing IVIM. In this IVIM model, two separate parameters have been proposed to reflect the tissue diffusivity and capillary perfusion, in the mathematical form of a bi-exponential decay function. Microcirculatory perfusion of blood within capillaries has no specific orientation and is hence termed as “pseudodiffusion”. It depends on the velocity of the flowing blood and the vascular architecture. The effect of pseudodiffusion on the signal attenuation is dependent on the b-value in each imaging voxel and the rate of signal attenuation that results from pseudodiffusion is typical for an order of magnitude greater than the tissue diffusion. This is due the larger distances of proton displacement that takes place during the application of the motion-probing gradients[100,101]. Therefore, at higher b values in tissues that are normally perfused, pseudodiffusion contributes for a small proportion (if any) of the measured signal. At lower b values, this contribution to the DWI signal becomes more significant. The parameters derived from IVIM with biexponential analysis are: Diffusion coefficient (ADCslow), pseudo-diffusion coefficient (ADCfast) and perfusion fraction (f)[1,102].
Stretched exponential DWI
Diffusion medium is postulated to be multi-compartmental. Bennett et al[103] introduced the stretched exponential DWI model to describe the heterogeneity of intravoxel diffusion rates and the distributed diffusion effect. Application of stretched exponential DWI model gives water molecular diffusion heterogeneity index (α) and the distributed diffusion coefficient (DDC) as follows[103,104]: S(b)/S(0) = exp [-(b.DDC)α]. Alpha (α) varies between 0 and 1 and is related to the intravoxel water molecular diffusion heterogeneity. A numerically high α value represents the low intravoxel diffusion heterogeneity. The DDC represents the mean intravoxel diffusion rate and represents the composite of individual ADCs, weighted by the volume fraction of water molecules in each part of the continuous distribution of ADCs. Kwee et al[105] demonstrated that the heterogeneity index of high-grade gliomas was significantly different from that of normal brain structures. Bai et al[104] demonstrated that α was significantly lower in high-grade gliomas than in low-grade gliomas, suggesting that high-grade gliomas exhibit more intravoxel diffusion heterogeneity than low-grade gliomas since they possess more histologic heterogeneity, such as heterogeneous cellularity and tortuous vascular hyperplasia. Also, Bedair et al[106] assessed early treatment response to neo-adjuvant chemotherapy in breast cancer using non-mono-exponential diffusion models. They concluded that baseline diffusion coefficients showed significant differences between complete pathological responders and non-responders, that increase in ADC and DDC at mid-treatment can discriminate responders and non-responders. And that the treatment effects can potentially be assessed by non-mono-exponential diffusion models[106].
Diffusion kurtosis imaging
Diffusion kurtosis imaging (DKI) attempts to account for the alteration of the normative pattern of distribution and provide more accurate model of diffusion, capturing the non-Gaussian diffusion behavior as a marker for tissue heterogeneity. Most commonly used DKI parameters are mean kurtosis (MK), the average of diffusion kurtosis along all directions; radial kurtosis (RK), the kurtosis along the radial direction of the diffusion ellipsoid and axial kurtosis (AK), the kurtosis along axial direction of diffusion ellipsoid[107]. Studies have shown that evaluation of variant distribution pattern can provide important microstructural information about brain, especially while imaging ischemic tissue, traumatic brain injury, neoplasms, neurodegenerative and demyelinating diseases[108-112].
To conclude, DWI is a functional imaging technique with diverse applications in “personalized oncology” and hence radiologists should now be well acquainted with the technique and various applications of DWI in Oncology. It not only improves the sensitivity and specificity of conventional MRI but provides information in regard to the tumor microenvironment that is not available from the conventional MR sequences. As a Radiomic/Radiogenomic marker it has the potential to be an imaging biomarker for “personalized oncology” and help in individualized patient management.
SUMMARY OF DIFFUSION WEIGHTED MRI IN PERSONALIZED ONCOLOGY
DWI requires no contrast and thus is useful in patients with severe renal dysfunction. DWI is an echo planar sequence, which requires less time, and hence finds its applications in diverse scan protocols. It can be acquired in the same plane as conventional MR sequences and hence provide good correlation between morphological and functional imaging.
Acquisition
The b value (s/mm2) is an indicator of the diffusion weighting of the images. Low-b-value (e.g., < 100-150 s/mm2) provides images that are more sensitive to tissue perfusion and are recommended for IVIM imaging, whereas high b value (e.g., > 500 s/mm2) images are more specific for impaired Brownian motion that are indicative of true restricted diffusion and are recommend for DWI imaging. Typical b values used in routine oncological imaging range from 50 to 1000 s/mm2 however from the literature review we recommend diffusion-weighted images to be obtained with b values of 0, 500 and 1000 s/mm2. Additional higher-b-value images (1500 s/mm2) are suggested for MRI of the prostate and values of 700-800 s/mm2 are recommended for breast and cervix imaging.
Detection of lesion
DWI offers various advantages, which justify it to be an integral part of oncological imaging; one of them being its very high sensitivity. Since, DWI reflects changes at the cellular level; it shows positive changes earlier than the morphological imaging techniques. So, this is very sensitive technique for early lesion detection. Neoplasms are known to be more cellular than the organ of origin and hence show restricted diffusion with reduced ADC values. Not only the primary, but the nodal and distant metastases show restricted diffusion, and hence can be accurately characterized on DWI. ADC histogram mapping or the ADC slope analysis gives a qualitative as well quantitative impression of the ADC in the suspicious area and comparative assessment between normal and suspicious area respectively. Colored ADC maps are superior to the grey scale maps; especially in sub-centimeter sized lesions, and follow-up imaging.
Characterization of lesions
Differentiation of benign and malignant lesion forms the initial portal of patient management in oncology. DWI being a functional imaging modality depicts the tissue milieu at the cellular level. Malignant neoplasms are more cellular than a benign lesion, and hence show reduced ADC as compared to a benign process. The use of ADC cut off value (b value of 500 s/mm2) of 1.5 × 10⁻³ mm2/s and ADC cut off value (b value of 1000 s/mm2) of 1.0 × 10⁻³ mm2/s gives a good specificity and is recommended for differentiating malignant from benign. Also, DWI may predict the aggressiveness and grade of the tumor.
Post therapy evaluation
Oncological treatments result in tumor lysis, loss of cell membrane integrity, increased extracellular space and therefore, an increase in water diffusion. Hence, the effectiveness of the treatment can be monitored by DWI. Anti-cancer treatment like radiotherapy leads to considerable alteration in the local anatomy and hence, precludes the evaluation of the diseased area with morphological imaging. Also, it is imperative to detect residual/recurrent disease in this area, due to obvious therapeutic and prognostic implications. Morphological imaging techniques have their limitations due to altered milieu. DWI comes to the rescue in evaluation of post RT surveillance. DWI, being a functional imaging technique, detects residual/recurrent disease with high sensitivity and specificity. Also, unlike PET imaging, it is not confounded by the local inflammatory changes.
Predicting response
Research has found that tumors with low baseline pretreatment ADC values show better response to chemotherapy or radiation treatment. It is postulated that that tumors with high ADC values more likely to be necrotic. Since, necrotic tumors are frequently hypoxic, acidotic, and poorly perfused, it leads to decreased sensitivity of the tumor to chemotherapy and radiation therapy.
Limitations and challenges
One of the major limitations of DWI is no standardized acquisition protocol, which precludes its successful use as a research tool. It is also very sensitive to artifacts. The current available post-processing software tools are mostly for commercial use and do not allow complex post-processing. Lastly radiogenomics comparisons are essential in giving robust validation for its application as an imaging biomarker in personalized oncology.


