Published online Aug 28, 2016. doi: 10.4329/wjr.v8.i8.729
Peer-review started: February 21, 2016
First decision: March 25, 2016
Revised: April 12, 2016
Accepted: July 11, 2016
Article in press: July 13, 2016
Published online: August 28, 2016
Processing time: 190 Days and 6.7 Hours
The aim of this study was to prospectively assess the accuracy gain of Bayesian analysis-based computer-aided diagnosis (CAD) vs human judgment alone in characterizing solitary pulmonary nodules (SPNs) at computed tomography (CT). The study included 100 randomly selected SPNs with a definitive diagnosis. Nodule features at first and follow-up CT scans as well as clinical data were evaluated individually on a 1 to 5 points risk chart by 7 radiologists, firstly blinded then aware of Bayesian Inference Malignancy Calculator (BIMC) model predictions. Raters’ predictions were evaluated by means of receiver operating characteristic (ROC) curve analysis and decision analysis. Overall ROC area under the curve was 0.758 before and 0.803 after the disclosure of CAD predictions (P = 0.003). A net gain in diagnostic accuracy was found in 6 out of 7 readers. Mean risk class of benign nodules dropped from 2.48 to 2.29, while mean risk class of malignancies rose from 3.66 to 3.92. Awareness of CAD predictions also determined a significant drop on mean indeterminate SPNs (15 vs 23.86 SPNs) and raised the mean number of correct and confident diagnoses (mean 39.57 vs 25.71 SPNs). This study provides evidence supporting the integration of the Bayesian analysis-based BIMC model in SPN characterization.
Core tip: The aim of this study was to prospectively assess the net accuracy gain of using computer-aided diagnosis in characterizing solitary pulmonary nodules detected at computed tomography. One-hundred randomly selected nodules with a definitive diagnosis were reviewed by 7 radiologists, before and after computer predictions. A net gain in diagnostic accuracy was found in 6 out of 7 readers. This study provides further evidence supporting the integration of computer aided diagnosis in nodule characterization.
- Citation: Perandini S, Soardi GA, Motton M, Augelli R, Dallaserra C, Puntel G, Rossi A, Sala G, Signorini M, Spezia L, Zamboni F, Montemezzi S. Enhanced characterization of solid solitary pulmonary nodules with Bayesian analysis-based computer-aided diagnosis. World J Radiol 2016; 8(8): 729-734
- URL: https://www.wjgnet.com/1949-8470/full/v8/i8/729.htm
- DOI: https://dx.doi.org/10.4329/wjr.v8.i8.729
Solitary pulmonary nodules (SPNs) are a common radiological finding at computed tomography (CT)[1]. While the presence of multiple nodules can be suggestive of secondary pulmonary involvement, a single SPN can be more problematic to characterize. Benign and malignant SPNs are often difficult to discriminate on the basis of their appearance, due to the overlap of radiographic features such as shape, edge, size, and location within the lungs[2]. The presence of accessory findings such as calcifications within the nodule, hilar or mediastinal adenopathy and pleural effusion, can help the radiologist in better assessing the nature of the lesions[3]; however, this is rarely the case. The Fleischner Society has issued recommendations about the work-up of a newly discovered SPN, suggesting to obtain a pre-test probability of malignancy[4]. A few malignancy prediction algorithms have been introduced in the literature[5-7] to aid radiologists in integrating clinical and imaging information into a reproducible and quantitative evaluation of the malignancy risk of a lesion. Among these, the recently introduced Bayesian Inference Malignancy Calculator (BIMC, http://www.simoneperandini.com/bimc/) model has shown promising results in SPN classification[8]. However, there is little or no evidence in the literature that these prediction models can enhance discrimination of SPNs at the time of diagnosis. Bayesian analysis is a form of statistical inference in which the probability favoring a hypothesis increases or lowers as more information becomes available. It fits particularly well in actual clinical scenarios, where data are often partly available. The primary purpose of this study was to evaluate the net accuracy gain of an integrated human and computer-aided diagnosis (CAD) approach vs human judgment alone in distinguishing benign from malignant SPNs detected at CT. The secondary aim was to assess how the adoption of the model modifies judgment among raters, and, in particular, whether it allows for more accurate diagnosis of nodules perceived as having intermediate risk by human judgment alone.
A total of 100 solid SPNs from 100 patients, consisting of 35 benign and 65 malignant nodules, were randomly collected from the local database of SPNs referred to our center for characterization. The inclusion criteria were the presence of one solid (defined as a nodule with at least a solid component > 80% of the total volume) SPN, an available thin section CT scan encompassing the lungs and a definitive diagnosis by means of tissue biopsy or imaging follow-up, as suggested by guidelines[4]. The exclusion criteria were the presence of visible nodule calcifications and the presence of more than one nodule in the same patient. Patients were imaged with a 256-row multi-detector computed tomography (MDCT) system (Brilliance iCT: Philips Healthcare) or a 64-row MDCT system (LightSpeed: General Electrics Healthcare). CT scans were performed using sub-millimetric (0.9 mm), millimetric (1 mm) or near-millimetric (1.25 mm) contiguous slices. Data were reconstructed with a matrix of 512 × 512. The diameters of all nodules were measured by means of a linear digital caliper tool. The nodules were independently reviewed by 7 radiologists with expertise in thoracic imaging ranging from 3 to 10 years, blinded to final diagnosis and prevalence of malignancy, on Multi-Planar Reconstruction images on a professional workstation (Carestream Picture Archiving and Communication System, Carestream Health, 2011). All nodules were independently reviewed by the raters in the same order. Clinical and anamnestic data were collected from the hospital electronic records and made preliminarily available to raters. The reviewer was firstly asked to assess image quality as optimal or sub-optimal for diagnosis. They were subsequently asked to classify the probability of malignancy of the lesion before and after disclosure of the BIMC model result according to the classes detailed in Table 1, and to record and enter personal results in a spreadsheet. The BIMC model is a recent SPN risk prediction model developed in 2015; it works by providing the user with a risk probability after the collection of all available data. It currently supports the following features: Age, smoking (Pack-years), history of previous malignancy, size (mm), location within the lungs, edges, volume doubling time, minimum focal density, contrast enhancement and F-18 fluorodeoxyglucose positron emission tomography SUVmax value. Since it was developed as a Bayesian classifier, it tolerates partial data collection. The model was designed to be a useful tool for integrating all available data in an objective, reproducible manner. In this study the BIMC model was accessed either in the version of a computer application (http://www.simoneperandini.com/npsbimc/download.htm) or in its web counterpart (http://www.simoneperandini.com/bimc/).
| Class | Probability of malignancy |
| 1 | Minimal risk; almost certainly benign |
| 2 | Low risk; probably benign |
| 3 | Intermediate risk; not further characterizable |
| 4 | High risk; probably malignant |
| 5 | Very high risk; almost certainly malignant |
A different operator, which was not included among the raters, merged the data and performed the analysis. Reviewers’ performance was assessed by means of receiver operating characteristic (ROC) curve analysis. Analysis of ROC curves was performed according to DeLong et al[9]. Risk class ratings before and after disclosure of CAD data were collected in a spreadsheet and analyzed. Statistical analyses were conducted with MedCalc Statistical Software (MedCalc Software bvba, Ostend, Belgium; http://www.medcalc.org; 2014).
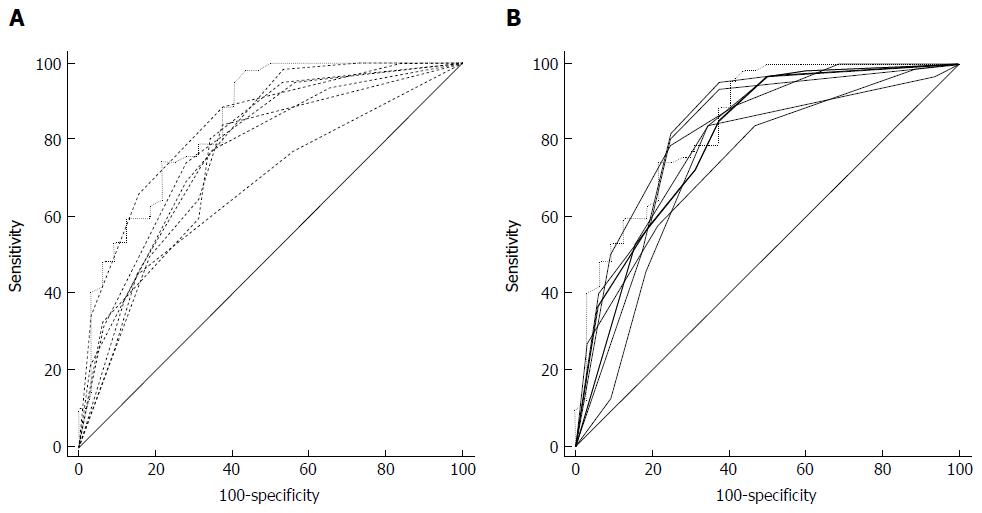
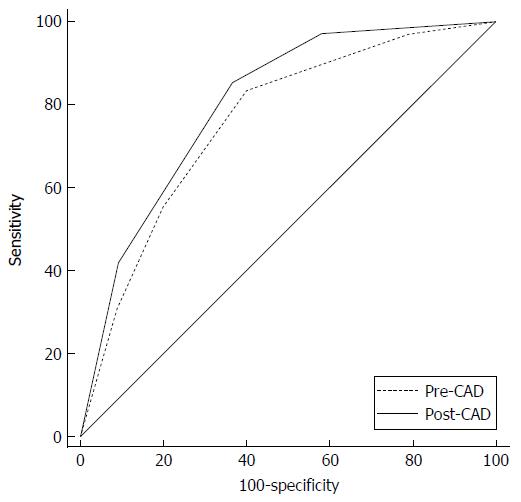
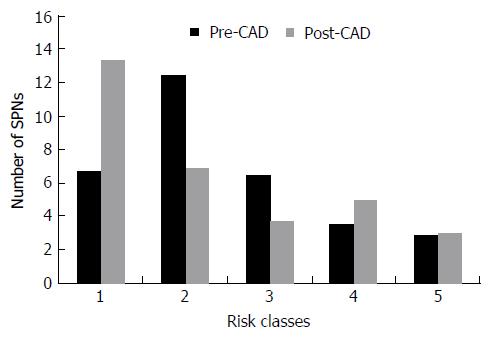
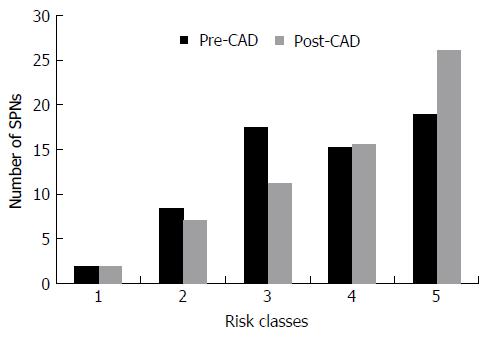
Six nodules were discarded from the original 100 because at least one of the reviewers found image quality to be sub-optimal for diagnosis. The study population consisted of 94 nodules from 94 different patients (57 males and 37 females). Mean age ± standard deviation (SD) was 65 ± 9 years. Mean nodule diameter ± SD was 14.84 ± 7.23 mm. The resulting population consisted of 62 malignant nodules and 32 benign nodules. Definitive diagnoses were obtained by tissue biopsy in 78 nodules and by lack of significant growth according to guidelines or volumetric reduction in 16 nodules. Benign nodules were composed of 8 hamartomas, 2 fibrotic nodules, 3 non-tubercular granulomas, 1 tubercular granuloma, 1 lymph node with signs of histiocytosis, 1 nodule of organizing pneumonia, and 16 nodules which proved stable according to American College of Chest Physicians guidelines. Malignancies were composed of 4 large cell carcinomas, 29 adenocarcinomas (4 minimally invasive, 11 not otherwise specified, 14 invasive), 5 squamocellular carcinomas, 12 typical carcinoids, and 12 metastases. ROC curve analysis is summarized in Table 2 and illustrated in Figures 1 and 2. SPN ratings are summarized in Table 3 and illustrated in Figures 3 and 4. Mean risk class shifts after the disclosure of BIMC data were 37.14 (39.5%) out of 94 ratings. Mean risk class of benign SPNs before and after CAD results was 2.48 and 2.29, respectively. Mean risk class of malignancies before and after CAD results was 3.66 and 3.92, respectively. Mean indeterminate SPNs (both benign and malignant nodules in class 3) were 23.86 and 15 before and after awareness of CAD predictions, respectively. Mean correct confident diagnoses (benign nodules in class 1 and malignant nodules in class 5) were 25.71 and 39.57 before and after awareness of CAD predictions, respectively.
| Rater | SPNs | AUC blinded | AUC unfolded | Difference | Significance |
| 95%CI | 95%CI | ||||
| BIMC | 94 | 0.845 | - | - | - |
| 0.755-0.911 | |||||
| Rater 1 | 94 | 0.734 | 0.769 | 0.035 | P = 0.3329 |
| 0.633-0.820 | 0.671-0.850 | ||||
| Rater 2 | 94 | 0.788 | 0.820 | 0.032 | P = 0.2170 |
| 0.691-0.865 | 0.727-0.892 | ||||
| Rater 3 | 94 | 0.788 | 0.830 | 0.042 | P = 0.0592 |
| 0.692-0.866 | 0.738-0.899 | ||||
| Rater 4 | 94 | 0.739 | 0.795 | 0.056 | P = 0.0048 |
| 0.639-0.825 | 0.699-0.871 | ||||
| Rater 5 | 94 | 0.751 | 0.815 | 0.064 | P = 0.0300 |
| 0.651-0.834 | 0.721-0.887 | ||||
| Rater 6 | 94 | 0.836 | 0.833 | -0.003 | P = 0.9308 |
| 0.745-0.904 | 0.742-0.902 | ||||
| Rater 7 | 94 | 0.682 | 0.756 | 0.074 | P = 0.0054 |
| 0.578-0.774 | 0.657-0.839 | ||||
| Overall | 658 | 0.758 | 0.803 | 0.045 | P = 0.0003 |
| 0.723-0.790 | 0.770-0.833 |
| Risk class | Benign SPNs | Malignant SPNs | ||
| Pre-CAD | Post-CAD | Pre-CAD | Post-CAD | |
| 1 | 6.71 | 13.43 | 1.86 | 1.86 |
| 2 | 12.43 | 6.86 | 8.43 | 7.14 |
| 3 | 6.43 | 3.71 | 17.43 | 11.29 |
| 4 | 3.57 | 5.00 | 15.29 | 15.57 |
| 5 | 2.86 | 3.00 | 19.00 | 26.14 |
Mean correct diagnosis shift (benign nodules with a lesser score or malignant nodules with a higher score after CAD disclosure) was 26.42.
Lung cancer is currently one of the leading causes of cancer deaths worldwide[10]. Most patients are diagnosed at an advanced stage and only about 15% have the opportunity of surgical resection[11]. Accurate assessment, proper treatment and timely surgical resection of malignant pulmonary nodules will be highly beneficial to the survival of patients with lung cancer.
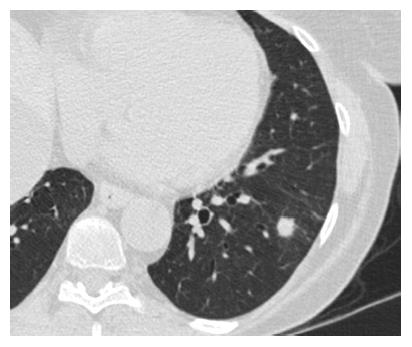
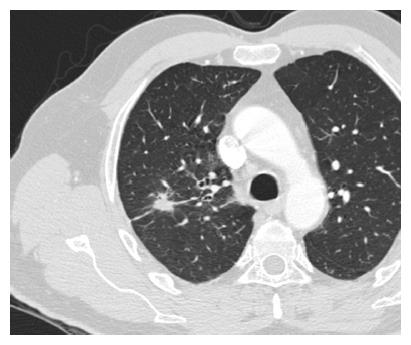
SPNs are a common radiological finding at CT[1] and they often represent a diagnostic challenge for the physician because of substantial overlap of imaging signs between malignant and benign disease. Furthermore the differential diagnosis of a solid solitary pulmonary nodule is broad, ranging from benign tumors, infectious lesions to primary cancer. Typical findings at high-resolution CT are illustrated in Figures 5 and 6.
The cornerstone of nodule assessment is to estimate the likelihood of malignancy, since accurate determination of the nature of an SPN has critical consequences. In the case of a high-risk nodule the patient undergoes surgery while SPNs looking less aggressive are often monitored by serial imaging or characterized by tissue biopsy. Clinical prediction models, also referred to as risk assessment models, have been developed to provide a more explicit, transparent, and reproducible assessment of the risk[12]. In the past years a few studies have reported that CAD systems can help the radiologist to better detect and characterize SPNs on CT scans[13-16]. Although a number of proposals for the quantitative evaluation of SPNs have been offered, at present there is no consensus regarding the optimal approach[17]. The main purpose of this research was to assess whether and to what extent and significance CAD integration could help radiologists in better characterizing incidental solid SPNs during the work-up.
The most important and clinically relevant finding in this study is that the integration of the proposed prediction model significantly enhanced SPN characterization by increasing overall area under the curve (AUC) by 0.045 (P = 0.0003). This effect was less evident on single raters’ AUC, probably because of the modest size of the sample evaluated. CAD integration increased to a variable extent the AUC for all raters but one (6 out of 7 raters) nonetheless.
A second crucial finding is the drop of nodules which were classified as indeterminate (class 3 in this study) for both malignant and benign lesions after CAD. It also led to an overall decrease of doubtful diagnoses (SPNs in classes 2, 3 and 4) and raised the number of correct confident diagnosis (benign SPNs in class 1 and malignant SPNs in class 5). A third noteworthy observation is that CAD integration did not cause an increase of cancer misdiagnoses (malignant SPNs in class 1), while only determining a modest increase of benign lesions being classified as probably (benign SPNs in class 4: Increased 1.43/32, 4.46%) or certainly malignant (benign SPNs in class 5: Increased 0.14/32, 0.43%). Overall comparison of ratings showed a higher mean confidence by lowering mean risk class of benign nodules from 2.48 to 2.29 and by raising mean risk class of malignancies from 3.66 to 3.92. These results support the possibility of enhancing SPN characterization by integrating CAD in routine SPN analysis. They also show how the BIMC model is particularly able to increase confidence in malignant nodule characterization, without raising concern of cancer misses. A very moderate increase in the number of benign nodules which are wrongly classified as malignant could possibly be the main drawback of using the proposed CAD. In this regard the authors believe that a more accurate and prompt characterization of malignant nodules can be worth the cost of very few benign nodules that would need further testing or will eventually undergo surgery.
One collateral finding of the current analysis is that the BIMC model alone showed persistent superiority to all human raters in providing correct predictions of risk. A note of caution is due here since the study was not designed to provide direct, unbiased comparison between raters and the model itself, and results may be limited by the methods adopted.
Whether models alone could perform better than clinicians is uncertain. Swensen, for example, showed that there was no difference in accuracy between the judgment of four expert physicians and the probabilities generated by the Mayo Clinic model, although it was noted how the experts tended to overestimate risk for nodules identified as low risk by the model[16]. Since this kind of analysis was beyond the scope and the methods of the study, these results need therefore to be interpreted with caution.
Our analysis suffers from some limitations. In the first place we did not consider the time needed to enter data in the calculator and obtain a CAD estimated value. Additional time requested in nodule assessment could possibly be detrimental to the clinical introduction of the described model. This was beyond the aim of the study and could be better assessed in future work. We eventually estimated the mean time spent on the web BIMC calculator for a single prediction by asking three radiologists to perform a risk prediction using the model. Time needed varied from less than 1 min for the very experienced (model designer and programmer, not included into raters) to roughly 4 min for the less skilled user (first time user, not included into raters). In the second place we solely focused on incremental accuracy of the CAD integrated method in SPN characterization. Additional studies are needed to clarify the value of prediction models above clinical judgment and to assess whether they can improve care and outcomes for patients presenting with an SPN.
Our results indicate that use of an integrated CAD and human judgment system can lead to improved raters’ performance in SPN characterization on chest CT images.
This study provides evidence supporting the integration of CAD in SPN assessment. The BIMC prediction model can assist radiologists in better distinguishing malignant from benign SPNs.
Manuscript source: Invited manuscript
Specialty type: Radiology, nuclear medicine and medical imaging
Country of origin: Italy
Peer-review report classification
Grade A (Excellent): 0
Grade B (Very good): 0
Grade C (Good): C, C, C
Grade D (Fair): 0
Grade E (Poor): 0
P- Reviewer: Chow J, Demir Y, Lassandro F S- Editor: Qiu S L- Editor: Wang TQ E- Editor: Zhang FF
| 1. | Trotman-Dickenson B, Baumert B. Multidetector-row CT of the solitary pulmonary nodule. Semin Roentgenol. 2003;38:158-167. [RCA] [PubMed] [DOI] [Full Text] [Cited by in Crossref: 14] [Cited by in RCA: 14] [Article Influence: 0.6] [Reference Citation Analysis (0)] |
| 2. | Wang YX, Gong JS, Suzuki K, Morcos SK. Evidence based imaging strategies for solitary pulmonary nodule. J Thorac Dis. 2014;6:872-887. [RCA] [PubMed] [DOI] [Full Text] [Cited by in RCA: 16] [Reference Citation Analysis (0)] |
| 3. | Sim YT, Poon FW. Imaging of solitary pulmonary nodule-a clinical review. Quant Imaging Med Surg. 2013;3:316-326. [RCA] [PubMed] [DOI] [Full Text] [Cited by in RCA: 34] [Reference Citation Analysis (0)] |
| 4. | Gould MK, Fletcher J, Iannettoni MD, Lynch WR, Midthun DE, Naidich DP, Ost DE. Evaluation of patients with pulmonary nodules: when is it lung cancer?: ACCP evidence-based clinical practice guidelines (2nd edition). Chest. 2007;132:108S-130S. [RCA] [PubMed] [DOI] [Full Text] [Cited by in Crossref: 333] [Cited by in RCA: 357] [Article Influence: 19.8] [Reference Citation Analysis (0)] |
| 5. | Patel VK, Naik SK, Naidich DP, Travis WD, Weingarten JA, Lazzaro R, Gutterman DD, Wentowski C, Grosu HB, Raoof S. A practical algorithmic approach to the diagnosis and management of solitary pulmonary nodules: part 1: radiologic characteristics and imaging modalities. Chest. 2013;143:825-839. [RCA] [PubMed] [DOI] [Full Text] [Cited by in Crossref: 85] [Cited by in RCA: 94] [Article Influence: 7.8] [Reference Citation Analysis (0)] |
| 6. | Swensen SJ, Jett JR, Sloan JA, Midthun DE, Hartman TE, Sykes AM, Aughenbaugh GL, Zink FE, Hillman SL, Noetzel GR. Screening for lung cancer with low-dose spiral computed tomography. Am J Respir Crit Care Med. 2002;165:508-513. [RCA] [PubMed] [DOI] [Full Text] [Cited by in Crossref: 489] [Cited by in RCA: 464] [Article Influence: 20.2] [Reference Citation Analysis (0)] |
| 7. | Zhao B, Gamsu G, Ginsberg MS, Jiang L, Schwartz LH. Automatic detection of small lung nodules on CT utilizing a local density maximum algorithm. J Appl Clin Med Phys. 2003;4:248-260. [RCA] [PubMed] [DOI] [Full Text] [Cited by in Crossref: 86] [Cited by in RCA: 50] [Article Influence: 2.3] [Reference Citation Analysis (0)] |
| 8. | Soardi GA, Perandini S, Motton M, Montemezzi S. Assessing probability of malignancy in solid solitary pulmonary nodules with a new Bayesian calculator: improving diagnostic accuracy by means of expanded and updated features. Eur Radiol. 2015;25:155-162. [RCA] [PubMed] [DOI] [Full Text] [Cited by in Crossref: 38] [Cited by in RCA: 47] [Article Influence: 4.3] [Reference Citation Analysis (0)] |
| 9. | DeLong ER, DeLong DM, Clarke-Pearson DL. Comparing the areas under two or more correlated receiver operating characteristic curves: a nonparametric approach. Biometrics. 1988;44:837-845. [RCA] [PubMed] [DOI] [Full Text] [Cited by in Crossref: 13220] [Cited by in RCA: 13268] [Article Influence: 358.6] [Reference Citation Analysis (0)] |
| 10. | Jemal A, Bray F, Center MM, Ferlay J, Ward E, Forman D. Global cancer statistics. CA Cancer J Clin. 2011;61:69-90. [RCA] [PubMed] [DOI] [Full Text] [Cited by in Crossref: 23762] [Cited by in RCA: 25540] [Article Influence: 1824.3] [Reference Citation Analysis (7)] |
| 11. | Zhan P, Xie H, Xu C, Hao K, Hou Z, Song Y. Management strategy of solitary pulmonary nodules. J Thorac Dis. 2013;5:824-829. [RCA] [PubMed] [DOI] [Full Text] [Cited by in RCA: 17] [Reference Citation Analysis (0)] |
| 12. | Gould MK, Ananth L, Barnett PG. A clinical model to estimate the pretest probability of lung cancer in patients with solitary pulmonary nodules. Chest. 2007;131:383-388. [RCA] [PubMed] [DOI] [Full Text] [Full Text (PDF)] [Cited by in Crossref: 317] [Cited by in RCA: 319] [Article Influence: 17.7] [Reference Citation Analysis (0)] |
| 13. | Choi EJ, Jin GY, Han YM, Lee YS, Kweon KS. Solitary pulmonary nodule on helical dynamic CT scans: analysis of the enhancement patterns using a computer-aided diagnosis (CAD) system. Korean J Radiol. 2008;9:401-408. [RCA] [PubMed] [DOI] [Full Text] [Full Text (PDF)] [Cited by in Crossref: 8] [Cited by in RCA: 9] [Article Influence: 0.6] [Reference Citation Analysis (0)] |
| 14. | Rubin GD, Lyo JK, Paik DS, Sherbondy AJ, Chow LC, Leung AN, Mindelzun R, Schraedley-Desmond PK, Zinck SE, Naidich DP. Pulmonary nodules on multi-detector row CT scans: performance comparison of radiologists and computer-aided detection. Radiology. 2005;234:274-283. [RCA] [PubMed] [DOI] [Full Text] [Cited by in Crossref: 189] [Cited by in RCA: 177] [Article Influence: 8.4] [Reference Citation Analysis (0)] |
| 15. | Way TW, Hadjiiski LM, Sahiner B, Chan HP, Cascade PN, Kazerooni EA, Bogot N, Zhou C. Computer-aided diagnosis of pulmonary nodules on CT scans: segmentation and classification using 3D active contours. Med Phys. 2006;33:2323-2337. [RCA] [PubMed] [DOI] [Full Text] [Full Text (PDF)] [Cited by in Crossref: 176] [Cited by in RCA: 132] [Article Influence: 6.9] [Reference Citation Analysis (0)] |
| 16. | Swensen SJ, Silverstein MD, Edell ES, Trastek VF, Aughenbaugh GL, Ilstrup DM, Schleck CD. Solitary pulmonary nodules: clinical prediction model versus physicians. Mayo Clin Proc. 1999;74:319-329. [RCA] [PubMed] [DOI] [Full Text] [Cited by in Crossref: 98] [Cited by in RCA: 101] [Article Influence: 3.9] [Reference Citation Analysis (0)] |
| 17. | Naidich DP, Bankier AA, MacMahon H, Schaefer-Prokop CM, Pistolesi M, Goo JM, Macchiarini P, Crapo JD, Herold CJ, Austin JH. Recommendations for the management of subsolid pulmonary nodules detected at CT: a statement from the Fleischner Society. Radiology. 2013;266:304-317. [RCA] [PubMed] [DOI] [Full Text] [Cited by in Crossref: 661] [Cited by in RCA: 727] [Article Influence: 55.9] [Reference Citation Analysis (0)] |


