Published online Jun 28, 2016. doi: 10.4329/wjr.v8.i6.571
Peer-review started: November 13, 2015
First decision: January 18, 2016
Revised: February 22, 2016
Accepted: March 9, 2016
Article in press: March 14, 2016
Published online: June 28, 2016
Processing time: 220 Days and 1.8 Hours
The diagnosis and effective management of inflammatory bowel disease (IBD) requires a combination clinical, endoscopic, histological, biological, and imaging data. While endoscopy and biopsy remains the gold standard for diagnosis of IBD, imaging plays a central role in the assessment of extra mural disease, in disease surveillance and in the assessment of response to medical treatments, which are often expensive. Imaging is also vital in the detection and diagnosis of disease related complications, both acute and chronic. In this review, we will describe, with illustrative images, the imaging features of IBD in adults, with emphasis on up-to-date imaging techniques focusing predominantly on cross sectional imaging and new magnetic resonance imaging techniques.
Core tip: This review article provides a comprehensive overview of the multimodality imaging findings of acute and chronic inflammatory bowel disease, and of the role of imaging in the diagnosis and surveillance of this disease. There is an emphasis on up-to-date imaging including ultrasound elastography, magnetic resonance (MR) motility imaging, magnetisation MR and positron emission tomography magnetic resonance imaging, as well as a review of the currently widely used imaging techniques such as computed tomography and MR enterography.
- Citation: Stanley E, Moriarty HK, Cronin CG. Advanced multimodality imaging of inflammatory bowel disease in 2015: An update. World J Radiol 2016; 8(6): 571-580
- URL: https://www.wjgnet.com/1949-8470/full/v8/i6/571.htm
- DOI: https://dx.doi.org/10.4329/wjr.v8.i6.571
Inflammatory bowel disease (IBD) is a clinical syndrome that describes a group of inflammatory conditions affecting the bowel and other organs. Ulcerative colitis (UC) and Crohn’s disease (CD) account for a large proportion of IBD, and will be the focus of this review.
CD is an inflammatory disease that can occur anywhere along the length of the digestive tract, from the mouth to the anus. Inflammation involves all layers of the bowel wall, and as a result, fistulas are often observed. UC is an inflammatory disease confined to the mucosa and submucosa of the large colon[1].
IBD is most often characterized by periods of debilitating disease activity followed by periods of remission, and the aim of treatment is to maintain a normal quality of life for the patient, and to avoid IBD related complications, as far as is possible. The diagnosis and effective management of IBD requires a combination of clinical, endoscopic, imaging and histological data. While endoscopy and biopsy remain the gold standard for diagnosis of IBD[1], imaging plays a central role in the assessment of extra mural disease, in disease surveillance and in the assessment of response to medical treatments, which are often expensive.
Imaging is also vital in the detection and diagnosis of disease related complications, some of which follow a chronic course, such as cholelithiasis, nephrolithiasis, sclerosing cholangitis and IBD related arthropathy, others of which can present acutely, such as bowel perforation, peritonitis, toxic megacolon, and abscess.
In this review, we will present, with illustration, the imaging features of IBD in adults, and its complications, with emphasis on up-to-date imaging techniques.
Ultrasound is cheap, widely available and well tolerated. It is free from ionising radiation, is extremely safe and allows realtime evaluation of the bowel wall. However, ultrasound examination of the bowel can be negatively impacted by increased body habitus and the presence of excessive intraluminal bowel gas. Furthermore, it is largely user dependant, and as such, is not always reproducible[2,3]. Transabdominal ultrasound and small intestinal contrast ultrasound (SICUS) are imaging modalities more frequently used in the paediatric population than in adults for the evaluation of IBD, and are not techniques regularly used by us in our department.
Basic ultrasound protocols for the detection/evaluation of IBD usually utilise both greyscale and colour/power Doppler, using a high frequency probe, with multiplanar image acquisition of the entire abdomen. A 4 h pre-scan fast can help reduce bowel gas. A full bladder offers an acoustic window through which pelvic bowel loops can be examined, while oral water just prior to scan can help with the identification of gastric and duodenal lesion[3]. Colour/power Doppler can be used to assess the vascularity of the bowel wall and as such can distinguish between active disease and remission, as normal or fibrotic bowel wall will not display significant vascularity, while inflamed bowel will.
SICUS utilises an ingested intra-luminal contrast agent, such as iso-osmolar polyethylene glycol solution, to help delineate small bowel lesions and decrease intraobserver variability. It is well tolerated, has an insignificant side effect profile and can improve sensitivity in the evaluation of disease extent, and as such has a role in the diagnosis and surveillance of IBD[4]. In a small study of 13 patients, Onali et al[5] compared SICUS with computed tomography enterography (CTE) against a gold standard of surgical findings and showed identical sensitivity, specificity and accuracy in the detection small bowel fistulae (accuracy 77%) and abscesses (accuracy 85%), and comparable accuracy in the detection of small bowel strictures (92% vs 100%)[5].
The use of ultrasound elastography has a potential future use in the evaluation of bowel wall fibrosis in cases of chronic IBD, and has been shown to accurately differentiate fibrotic from acutely inflamed bowel wall in rat models. Further research is required to determine its applicability in the clinical setting[3,6].
Features of IBD on ultrasound[3,7-10]
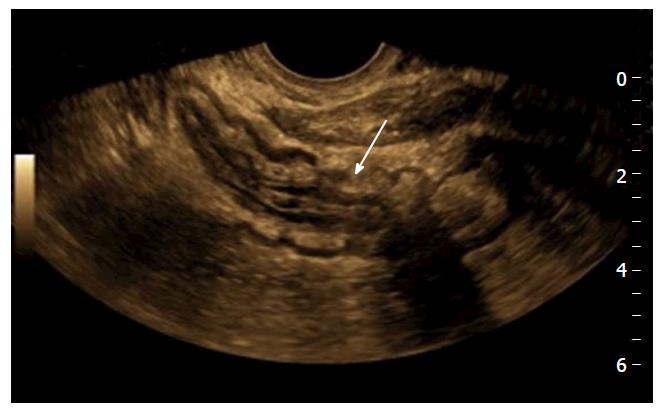
Mural thickening. Large bowel wall thickening > 3 mm, and small bowel mural thickening > 2.5 mm has been shown to have a good positive predictive value for moderate/severe disease in the bowel (Figure 1); non-compressible, relatively hypo peristaltic bowel; strictures with pre-stenotic dilatation; fistulas, which manifest as peri-intestinal duct-like structures; fibrofatty proliferation of the mesentery; echogenic, hyperaemic mesentery with hyperaemic mesenteric lymphadenopathy, although this is nonspecific; loss of normal stratification of the bowel wall, although, interpretation of the morphology of the bowel wall is non-specific and is often not useful to differentiate accurately between the subtypes of IBD.
Although sometimes associated with poor patient tolerance and a high incidence of artefact, magnetic resonance imaging (MRI) has the advantage of being a radiation free mode of imaging, with the ability to obtain images in multiple planes. MRI has excellent soft tissue analysis and the ability to assess for extra-mural disease[11,12].
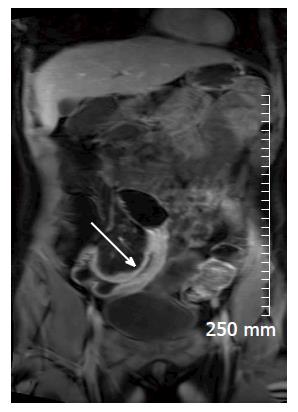
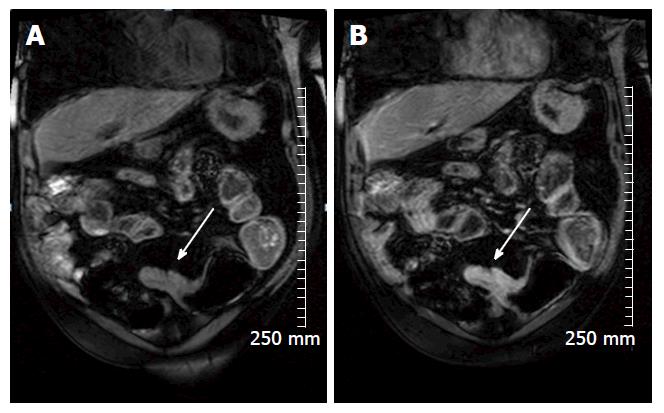
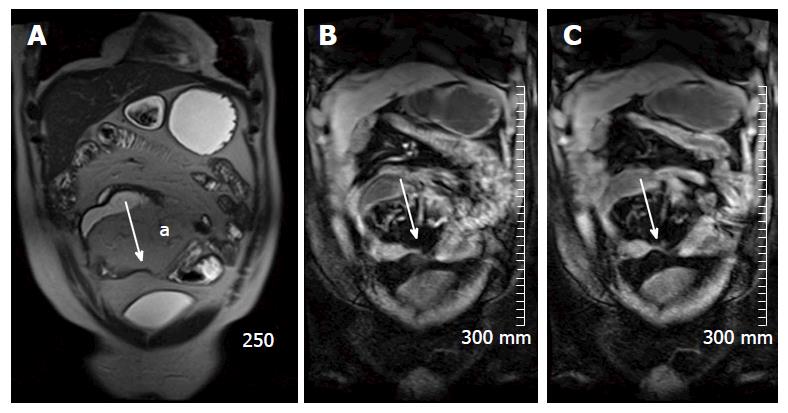
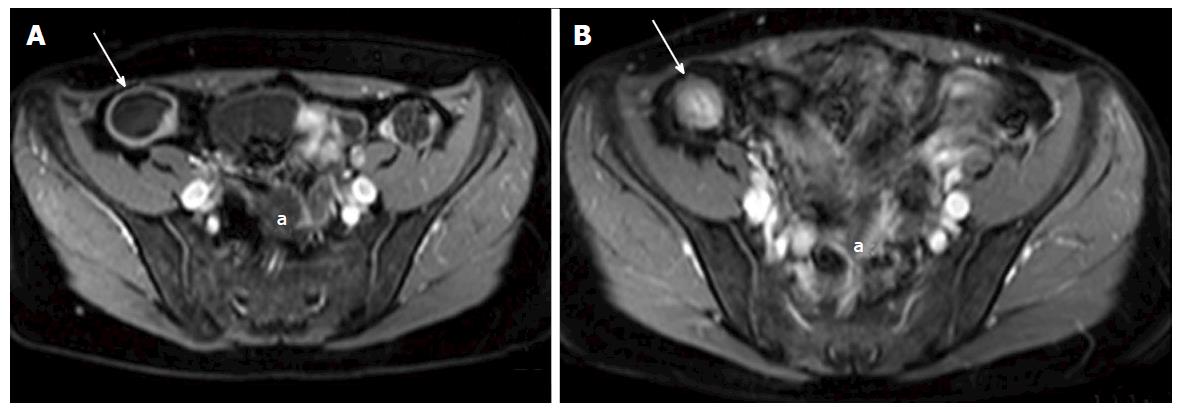
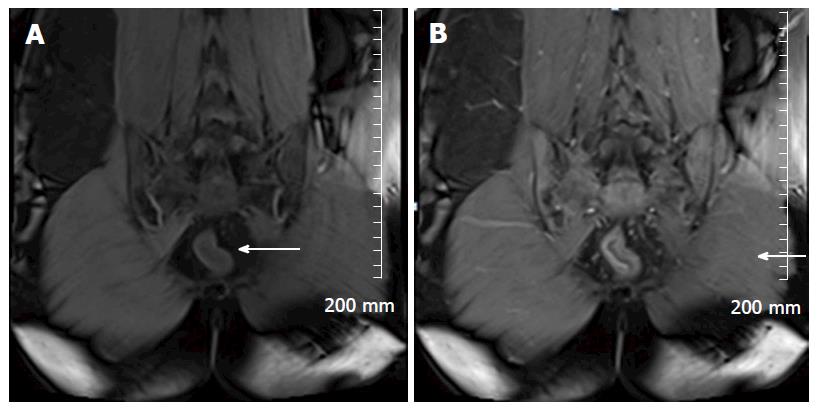
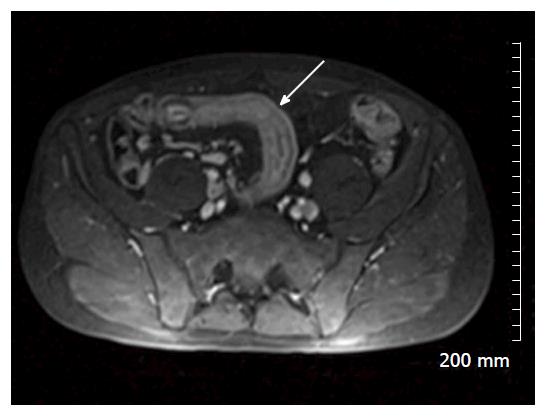
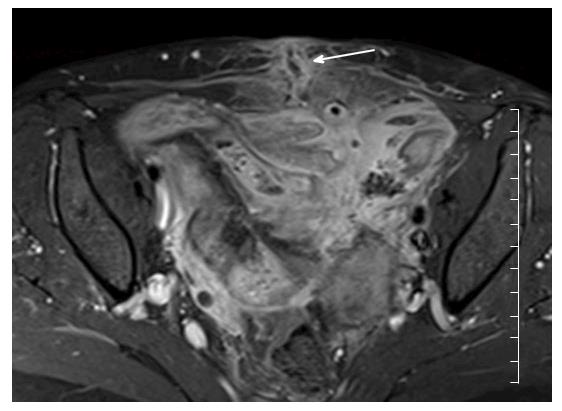
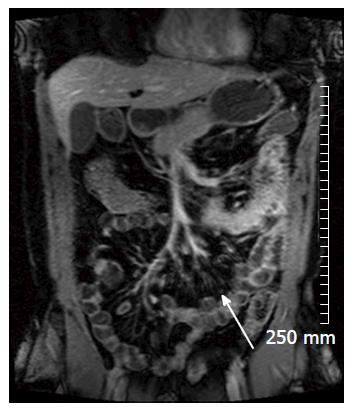
Soft tissue analysis and thus assessment of disease status is greatly enhanced by the administration of a gadolinium based contrast agent. For instance, in the evaluation of CD, stricturing can occur in the acute setting secondary to mural oedema, or in the chronic setting, secondary to fibrosis, chronic inflammation and fatty infiltration. The differentiation between acute and chronic stricturing can present a major clinical challenge, with implications for management. Even endoscopic evaluation of strictures can remain inconclusive as deeper mural layers are inaccessible to endoscopic assessment[13]. In these cases, the post-gadolinium enhancement pattern of the bowel on T1 weighted MR images is diagnostic - acute inflammatory stenoses avidly enhance (Figures 2 and 3) while chronic fibrotic stenoses show little or no enhancement (Figure 4)[10,13]. Differentiating between acute inflammatory strictures and chronic fibrotic strictures is important, as chronic strictures are irreversible and do not respond to medical therapy.
Magnetic resonance enterography (MRE) is the preferred MRI technique, and is the overall imaging technique favoured in our department for the evaluation of small bowel CD. In our institution, the MRE protocol is as follows: Images are obtained after a fast of 6 h and following the ingestion of 2.5% mannitol solution. Coronal and axial images are acquired, using a phased-array coil and a 1.5T or a 3T magnet. True fast imaging with steady-state precession and HASTE sequences with and without fat suppression are acquired, followed by pre and post contrast fat-suppressed coronal and axial (three-dimensional) T1-weighted breath-hold gradient-echo images of the abdomen and pelvis.
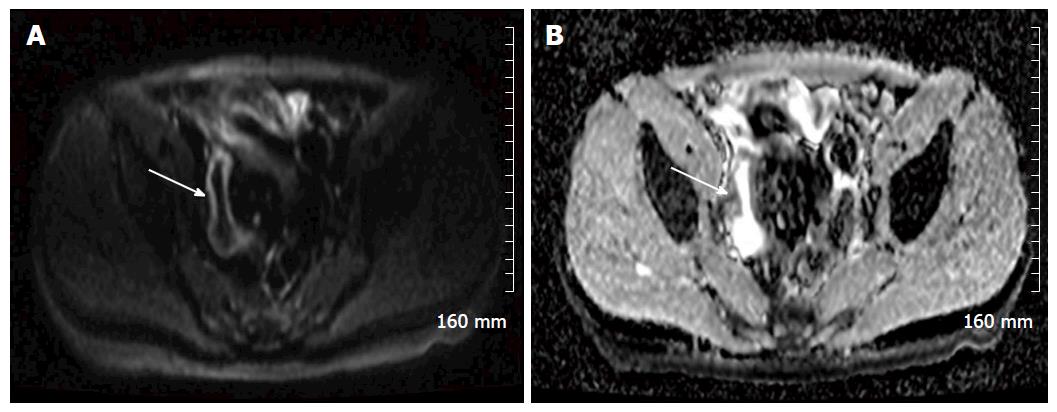
Diffusion weighted imaging (DWI) is steadily becoming a routine part of our MRE protocol. DWI MRI assesses the diffusion of water via Brownian motion in biological tissue[12,14]. The apparent diffusion coefficients (ADCs) are quantitative expressions of the diffusion characteristics of tissues and ADC values have been shown to decrease in areas of increased cell density or hypercellularity[11]. Although many studies have demonstrated restricted diffusion in areas of acutely inflamed bowel wall, the pathogenesis of this restricted diffusion remains somewhat unclear with many theories postulated, including an increase of cellularity in the inflammatory phase of the disease[11,15]. Many studies have shown that diffusion is restricted within the inflamed wall in the setting of acute IBD[11,16] (Figure 5).
In cases of CD, MRI and MRE has been shown to be quite accurate as a minimally-invasive assessment of patient response to medical treatments such as corticosteroids, anti-TNF alpha and other biological agents. In a multicenter prospective study of 48 patients with ulcerating CD, Ordás et al[17] showed that, when compared with a gold standard of iliocolonoscopy, MRE detected ulcer healing with a 90% accuracy and endoscopic remission with a 83% accuracy, after 12 wk of medical treatment (Figure 6).
Restricted diffusion within the wall of acutely inflamed bowel segments (Figure 5); early intense mucosal enhancement on T1 weighted images post the administration of contrast (Figures 2, 3, 7 and 8); bowel wall thickening > 3 mm (Figures 8 and 9); hyperintense signal with the bowel wall on T2 fat suppressed/fluid sensitive sequences; enhancing, diffusion restricting, enlarged mesenteric lymph nodes measuring > 8 mm; MRI is particularly useful in demonstrating fistulous extent in fistulating CD (Figure 10).
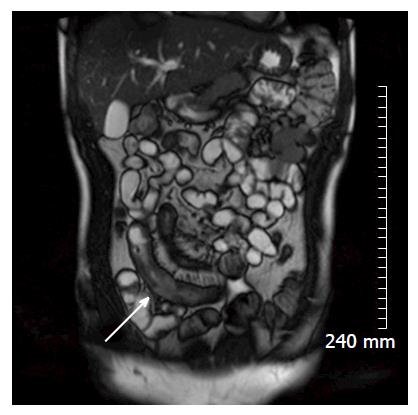
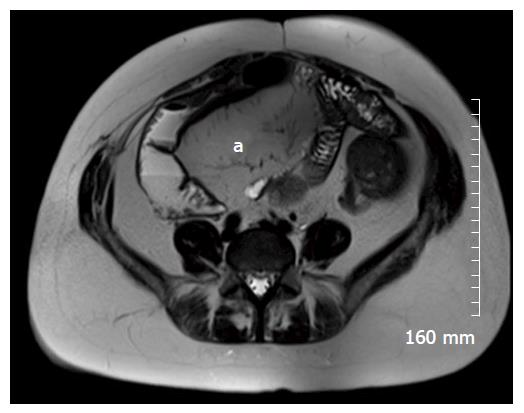
Fibrofatty proliferation of the mesentery (Figure 11); Chronic fibrotic strictures do not display avid post contrast enhancement (Figure 4); Fistulas can indicate the presence of acute or chronic disease and are best assessed on fast spine echo sequences or contrast enhanced T1 weighted images (Figure 10).
MR motility imaging: Of particular use in the evaluation of the small bowel. Based on the premise that inflamed bowel is relatively hypo peristaltic when compared with healthy bowel. This is particularly relevant in cases of CD where multifocal skip lesions can be compared with non-affected bowel in the same patient. Images are acquired in a cine sequence using fast T2-weighted SSFP or echo planar imaging sequences to allow repeated acquisition of images every 300-1000 ms on the same plane for one breath hold period[11]. Motility is assessed visually, and by formal measurements of the change of luminal cross sectional diameter over time[11,19]. Regions of hypo peristaltic bowel direct the radiologist to regions of inflammation where acute lesions are likely to reside. In a study of 40 patients, de Miguel Criado et al[12] identified 124 CD related lesions using both motility imaging and standard MRE vs 89 lesions using MRE alone (P = 0.007). More studies are required to establish the feasibility of this technique in clinical practice[3].
Perfusion MR: Via the assessment of the kinetics of contrast media uptake and washout within the bowel wall, perfusion MR provides quantitative/semi-quantitative measurements of perfusion[11,20]. In acute IBD, particularly in early CD, acute inflammation is demonstrated by an increase of vascular perfusion while decreased regional blood flow is observed in areas of fibrosis[11]. Thus far, the few studies investigating the accuracy of perfusion MR in the assessment of IBD have showed conflicting results, and large randomized trials are needed in order to validate this imaging technique[11].
Magnetisation transfer MR: In regions of chronic fibrosis, large molecules, such as proteins and collagen are present. Magnetisation transfer MR exploits this fact by measuring the energy transferred from protons in free mobile water molecules compared to the protons in water molecules associated with large collagen and protein molecules. In this way, it can be used to detect regions of fibrosis[3].
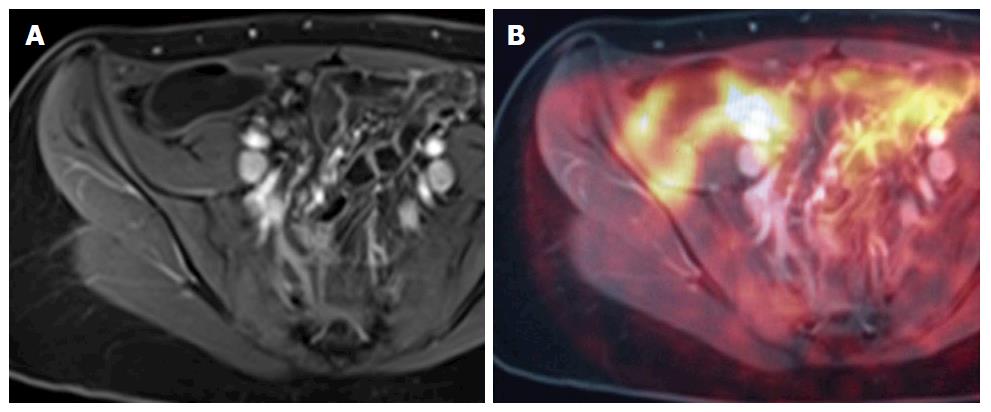
Positron emission tomography-MRI: An imaging modality that allows characterisation of lesions through a combination of the superior soft tissue analysis of MRI and the functional detail of positron emission tomography (PET), in either combined or sequential acquisition. Combined data acquisition allows simultaneous registration of the mobile bowel and related tissues under the same physiological conditions. PET data can be combined with both anatomical detail and also with functional data, for example, DWI. Using contrast-enhanced MR images, information regarding perfusion and blood flow can be integrated into the pharmacokinetic modelling of PET data to allow for better PET reconstruction and data analysis[11]. There is currently a lack of data on PET MRI and its applications in IBD, but there is imminently emerging literature (Figure 12).
Computed tomography enterography (CTE), is an attractive imaging technique for the evaluation of IBD. Reasons for this include ease of accessibility, high spatial resolution, fewer motion artefacts, short image acquisition time and radiologist familiarity[3]. Furthermore, for the evaluation of IBD related acute emergencies, such as toxic megacolon, bowel perforation and abscess, CT is the modality of choice, particularly on call. CTE and MRE are comparable in diagnostic effectiveness. A 2014 systematic review and meta-analysis performed by Qiu et al[21] compared MRE vs CTE for evaluating disease activity in small bowel CD. They analysed 290 CD patients from 6 studies and showed pooled sensitivity and specificity for MRE in detecting active small bowel CD was 87.9% and 81.2% respectively, vs 85.8% and 83.6% for CTE[21]. The obvious main disadvantage of CTE is patient exposure to ionising radiation. However, low dose technique for elective CTE can be applied, with satisfactory results. In a study of 50 patients, Craig et al[22] reduced the median effective dose by 72%, from 3.5 mSv (3-5.08 mSv) to 0.98 mSv (0.77-1.42 mSv). No clinically significant diagnostic findings were missed with low-dose imaging, although the imaging quality was noted to be inferior, as expected[22].
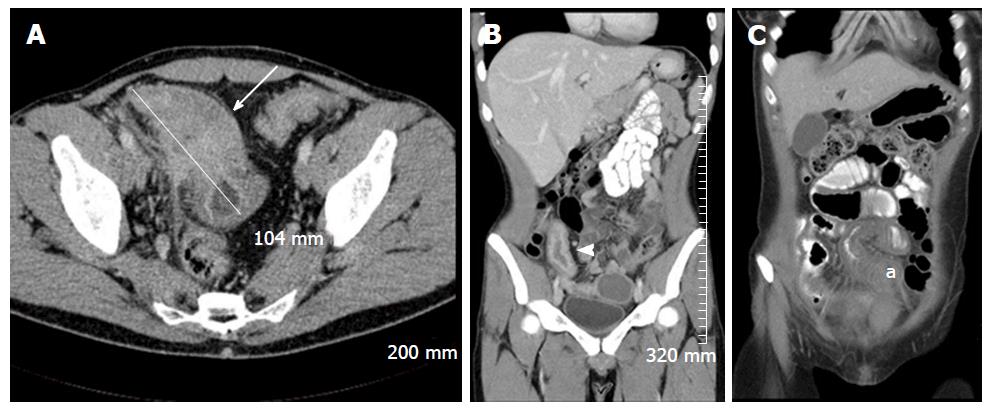
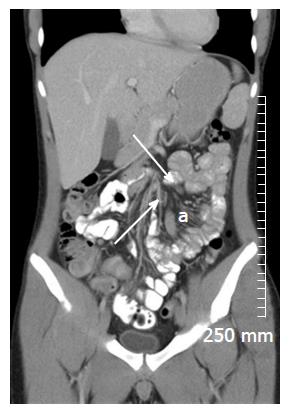
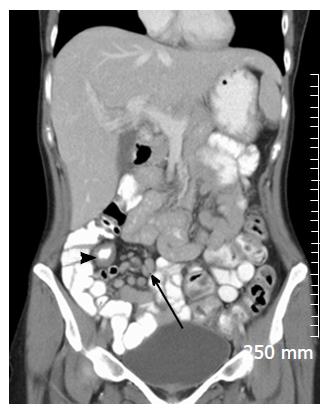
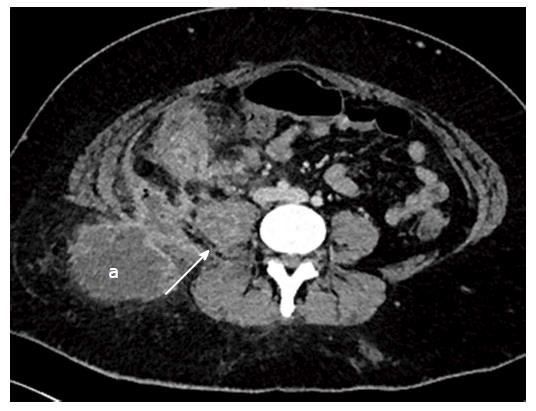
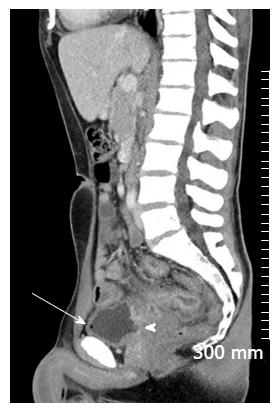
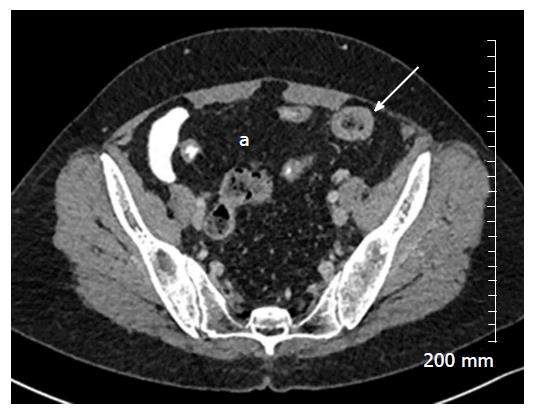
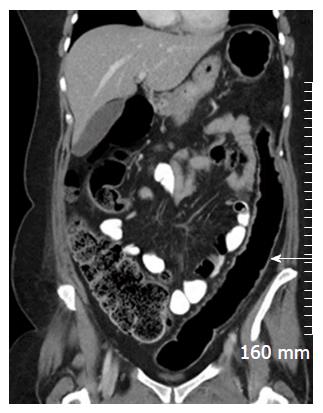
Mural thickening, peri-colonic fat stranding, and mural stratification and enhancement (Figure 13). The change in mural and mucosal enhancement over time can also be used to assess response to treatment; the “Comb sign” refers to hypervascularity of the mesentery in active CD. Prominent engorgement of the vascular arcades supplying an acutely inflamed segment of bowel is starkly contrasted against the perivascular mesentery, so that the vasa recta appear as the teeth of a comb (Figures 14 and 15). This can also be seen on MRI. It is not a pathognomonic sign; intra-abdominal free fluid and adenopathy is nonspecific (Figure 16); deep mural ulcers may present as focal bowel wall defects that contain fluid or oral contrast material. However, CT has low sensitivity for detection of ulcers; acute emergencies can manifest as pneumoperitoneum in the case of perforation, and colonic dilation > 6 cm with mural thinning and loss of haustral folds in the case of toxic megacolon; in cases of IBD related abscess/collection, CT is the imaging modality of choice to evaluate the extent of the abscess and to plan and guide access route for drainage (Figure 17); CT can also be of use in the evaluation of fistulating CD (Figure 18).
Fatty proliferation of the mesentery, as in MRI (Figure 19); sub mucosal fat infiltration of affected bowel segments-the “fat-halo” sign. This is also observed in MRI (Figures 6 and 19); chronic fibrosis, stricturing and shortening of the mesenteric border of the affected bowel with associated dilatation of the anti-mesenteric border can lead to prominent sacculations of the bowel; chronic fibrotic strictures show little or no enhancement post administration of contrast; in chronic UC, the bowel can become featureless with loss of normal haustral pattern, this is known as “the lead pipe sign” (Figure 20).
Integrated fluorodeoxyglucose (FDG) positron emission tomography and computed tomography systems offer both functional and anatomical information, and allow simultaneous CT and PET registration images of the bowel and related tissues acquired under similar physiological conditions. PET CT does not require bowel preparation, although patients are required to fast for 6 h prior to scan, and some protocols require patients to drink up to 1500 cc of water to act as a negative intraluminal contrast agent. Like CT, it exposes the patient to ionizing radiation, in addition to the not inconsiderable dose from radioactive FDG[26].
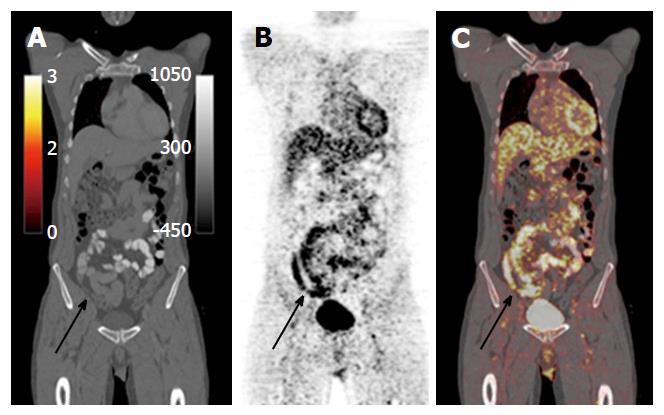
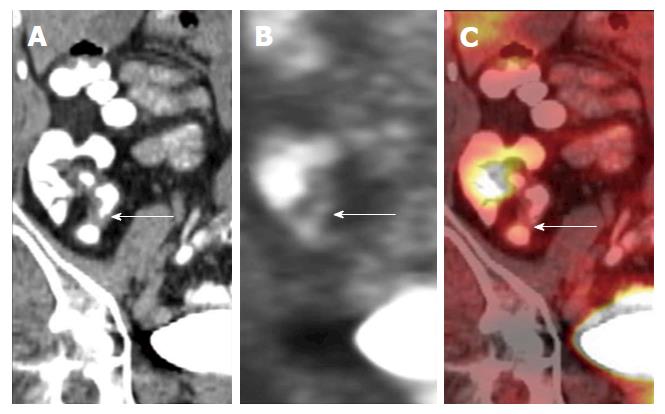
PET CT is highly sensitive at identifying acute inflammation, due to enhanced glycolysis of inflammatory cells, which manifest as increased uptake of FDG - an analogue of glucose[1] (Figures 21 and 22). However, this imaging modality is not specific, due to the variances of normal physiological bowel uptake, which is usually diffuse, not focal[26]. Despite its low specificity, PET-CT is considered by many as an effective, well tolerated, sensitive imaging modality for the evaluation of IBD, particularly in severe cases of the disease.
In a study of 43 patients with CD, Holtmann et al[13] compared PET-CT AND MRI against a gold standard of ileocolonoscopy. Of 80 endoscopically inflamed segments in CD, FDG-PET detected 72 and MRI detected 53 segments, giving an overall sensitivity of 90% (FDG-PET) vs 66% (hydro-MRI), and specificity of 92.6% vs 99%[13].
In a study of 22 patients with CD, Louis et al[27] compared FDG PET CT against a gold standard of ileocolonoscopy. FDG PET/CT detected 35 of 48 endoscopically affected segments overall, giving a sensitivity of 72.9%. In the detection of severe endoscopic lesions, the sensitivity of FDG PET/CT was 100%. Authors defined severe endoscopic lesions as “deep ulcers and strictures”[27].
In a study of 22 patients with CD, Saboury et al[1] compared FDG PET CT against a gold standard of ilicolonoscopy and fecal calprotectin. They aimed to determine the potential utility of measuring both regional and global inflammation using volume-based FDG-PET CT parameters, as a more accurate reflection of the extent of inflammation present. Calculated indices of regional and global inflammation correlated well with both clinical and pathological disease activity. Using a volume based measurement of FDG activity (SUVvol), as opposed to measuring the maximum FDG activity in a region based on activity per voxel (SUVmax), has the potential to guide therapy such as anti-TNF, which could be titrated based on the total amount of inflammatory disease present, as opposed to a uniform or weight-based dose[1].
Just as there is an ever-increasing demand for improvements in pharmacological treatments of IBD, so too is there a constant demand for the ongoing development of well tolerated, non-invasive, safe, highly sensitive and highly specific imaging tools for the diagnosis, management and surveillance of IBD. While long standing imaging techniques such as MRE, CT and ultrasound play an ongoing integral role in IBD management, many promising imaging tools are on the horizon, as we have outlined. Most of these promising techniques are MR based, such as MR motility imaging and magnetisation transfer MR. In particular, PET MRI is a tool that we feel has a promising role in the future of IBD imaging, and there is imminently emerging data on this imaging modality and it’s applications in IBD.
P- Reviewer: Actis GC, Razek AAKA, Tsai HH S- Editor: Ji FF L- Editor: A E- Editor: Li D
| 1. | Saboury B, Salavati A, Brothers A, Basu S, Kwee TC, Lam MG, Hustinx R, Louis E, Torigian DA, Alavi A. FDG PET/CT in Crohn’s disease: correlation of quantitative FDG PET/CT parameters with clinical and endoscopic surrogate markers of disease activity. Eur J Nucl Med Mol Imaging. 2014;41:605-614. [RCA] [PubMed] [DOI] [Full Text] [Cited by in Crossref: 52] [Cited by in RCA: 56] [Article Influence: 4.7] [Reference Citation Analysis (0)] |
| 2. | Alison M, Kheniche A, Azoulay R, Roche S, Sebag G, Belarbi N. Ultrasonography of Crohn disease in children. Pediatr Radiol. 2007;37:1071-1082. [RCA] [PubMed] [DOI] [Full Text] [Cited by in Crossref: 63] [Cited by in RCA: 53] [Article Influence: 2.9] [Reference Citation Analysis (0)] |
| 3. | Athanasakos A, Mazioti A, Economopoulos N, Kontopoulou C, Stathis G, Filippiadis D, Spyridopoulos T, Alexopoulou E. Inflammatory bowel disease-the role of cross-sectional imaging techniques in the investigation of the small bowel. Insights Imaging. 2015;6:73-83. [RCA] [PubMed] [DOI] [Full Text] [Full Text (PDF)] [Cited by in Crossref: 16] [Cited by in RCA: 17] [Article Influence: 1.5] [Reference Citation Analysis (0)] |
| 4. | Calabrese E, Zorzi F, Pallone F. Ultrasound of the small bowel in Crohn’s disease. Int J Inflam. 2012;2012:964720. [PubMed] |
| 5. | Onali S, Calabrese E, Petruzziello C, Zorzi F, Sica G, Fiori R, Ascolani M, Lolli E, Condino G, Palmieri G. Small intestine contrast ultrasonography vs computed tomography enteroclysis for assessing ileal Crohn’s disease. World J Gastroenterol. 2012;18:6088-6095. [RCA] [PubMed] [DOI] [Full Text] [Full Text (PDF)] [Cited by in CrossRef: 20] [Cited by in RCA: 20] [Article Influence: 1.5] [Reference Citation Analysis (1)] |
| 6. | Dillman JR, Stidham RW, Higgins PD, Moons DS, Johnson LA, Rubin JM. US elastography-derived shear wave velocity helps distinguish acutely inflamed from fibrotic bowel in a Crohn disease animal model. Radiology. 2013;267:757-766. [RCA] [PubMed] [DOI] [Full Text] [Cited by in Crossref: 83] [Cited by in RCA: 87] [Article Influence: 7.3] [Reference Citation Analysis (0)] |
| 7. | Parente F, Greco S, Molteni M, Anderloni A, Bianchi Porro G. Imaging inflammatory bowel disease using bowel ultrasound. Eur J Gastroenterol Hepatol. 2005;17:283-291. [RCA] [PubMed] [DOI] [Full Text] [Cited by in Crossref: 52] [Cited by in RCA: 42] [Article Influence: 2.1] [Reference Citation Analysis (0)] |
| 8. | Sargar KM, Siegel MJ. Sonography of acute appendicitis and its mimics in children. Indian J Radiol Imaging. 2014;24:163-170. [RCA] [PubMed] [DOI] [Full Text] [Full Text (PDF)] [Cited by in Crossref: 11] [Cited by in RCA: 10] [Article Influence: 0.9] [Reference Citation Analysis (0)] |
| 9. | Bremner AR, Griffiths M, Argent JD, Fairhurst JJ, Beattie RM. Sonographic evaluation of inflammatory bowel disease: a prospective, blinded, comparative study. Pediatr Radiol. 2006;36:947-953. [RCA] [PubMed] [DOI] [Full Text] [Cited by in Crossref: 74] [Cited by in RCA: 66] [Article Influence: 3.5] [Reference Citation Analysis (0)] |
| 10. | Quencer KB, Nimkin K, Mino-Kenudson M, Gee MS. Detecting active inflammation and fibrosis in pediatric Crohn’s disease: prospective evaluation of MR-E and CT-E. Abdom Imaging. 2013;38:705-713. [RCA] [PubMed] [DOI] [Full Text] [Cited by in Crossref: 66] [Cited by in RCA: 68] [Article Influence: 5.7] [Reference Citation Analysis (0)] |
| 11. | Maccioni F, Patak MA, Signore A, Laghi A. New frontiers of MRI in Crohn’s disease: motility imaging, diffusion-weighted imaging, perfusion MRI, MR spectroscopy, molecular imaging, and hybrid imaging (PET/MRI). Abdom Imaging. 2012;37:974-982. [RCA] [PubMed] [DOI] [Full Text] [Cited by in Crossref: 42] [Cited by in RCA: 43] [Article Influence: 3.6] [Reference Citation Analysis (0)] |
| 12. | de Miguel Criado J, del Salto LG, Rivas PF, del Hoyo LF, Velasco LG, de las Vacas MI, Marco Sanz AG, Paradela MM, Moreno EF. MR imaging evaluation of perianal fistulas: spectrum of imaging features. Radiographics. 2012;32:175-194. [RCA] [PubMed] [DOI] [Full Text] [Cited by in Crossref: 136] [Cited by in RCA: 143] [Article Influence: 11.0] [Reference Citation Analysis (0)] |
| 13. | Holtmann MH, Uenzen M, Helisch A, Dahmen A, Mudter J, Goetz M, Schreckenberger M, Galle PR, Bartenstein P, Neurath MF. 18F-Fluorodeoxyglucose positron-emission tomography (PET) can be used to assess inflammation non-invasively in Crohn’s disease. Dig Dis Sci. 2012;57:2658-2668. [RCA] [PubMed] [DOI] [Full Text] [Cited by in Crossref: 24] [Cited by in RCA: 31] [Article Influence: 2.4] [Reference Citation Analysis (0)] |
| 14. | Koh DM, Collins DJ. Diffusion-weighted MRI in the body: applications and challenges in oncology. AJR Am J Roentgenol. 2007;188:1622-1635. [RCA] [PubMed] [DOI] [Full Text] [Cited by in Crossref: 1418] [Cited by in RCA: 1462] [Article Influence: 81.2] [Reference Citation Analysis (0)] |
| 15. | Kilickesmez O, Atilla S, Soylu A, Tasdelen N, Bayramoglu S, Cimilli T, Gurmen N. Diffusion-weighted imaging of the rectosigmoid colon: preliminary findings. J Comput Assist Tomogr. 2009;33:863-866. [RCA] [PubMed] [DOI] [Full Text] [Cited by in Crossref: 35] [Cited by in RCA: 34] [Article Influence: 2.3] [Reference Citation Analysis (0)] |
| 16. | Oto A, Kayhan A, Williams JT, Fan X, Yun L, Arkani S, Rubin DT. Active Crohn’s disease in the small bowel: evaluation by diffusion weighted imaging and quantitative dynamic contrast enhanced MR imaging. J Magn Reson Imaging. 2011;33:615-624. [RCA] [PubMed] [DOI] [Full Text] [Cited by in Crossref: 169] [Cited by in RCA: 166] [Article Influence: 11.9] [Reference Citation Analysis (0)] |
| 17. | Ordás I, Rimola J, Rodríguez S, Paredes JM, Martínez-Pérez MJ, Blanc E, Arévalo JA, Aduna M, Andreu M, Radosevic A. Accuracy of magnetic resonance enterography in assessing response to therapy and mucosal healing in patients with Crohn’s disease. Gastroenterology. 2014;146:374-382.e1. [RCA] [PubMed] [DOI] [Full Text] [Cited by in Crossref: 263] [Cited by in RCA: 294] [Article Influence: 26.7] [Reference Citation Analysis (0)] |
| 18. | Madureira AJ. The comb sign. Radiology. 2004;230:783-784. [RCA] [PubMed] [DOI] [Full Text] [Cited by in Crossref: 56] [Cited by in RCA: 46] [Article Influence: 2.2] [Reference Citation Analysis (0)] |
| 19. | Froehlich JM, Patak MA, von Weymarn C, Juli CF, Zollikofer CL, Wentz KU. Small bowel motility assessment with magnetic resonance imaging. J Magn Reson Imaging. 2005;21:370-375. [RCA] [PubMed] [DOI] [Full Text] [Cited by in Crossref: 118] [Cited by in RCA: 104] [Article Influence: 5.2] [Reference Citation Analysis (0)] |
| 20. | Pupillo VA, Di Cesare E, Frieri G, Limbucci N, Tanga M, Masciocchi C. Assessment of inflammatory activity in Crohn’s disease by means of dynamic contrast-enhanced MRI. Radiol Med. 2007;112:798-809. [RCA] [PubMed] [DOI] [Full Text] [Cited by in Crossref: 41] [Cited by in RCA: 39] [Article Influence: 1.2] [Reference Citation Analysis (0)] |
| 21. | Qiu Y, Mao R, Chen BL, Li XH, He Y, Zeng ZR, Li ZP, Chen MH. Systematic review with meta-analysis: magnetic resonance enterography vs. computed tomography enterography for evaluating disease activity in small bowel Crohn’s disease. Aliment Pharmacol Ther. 2014;40:134-146. [RCA] [PubMed] [DOI] [Full Text] [Cited by in Crossref: 115] [Cited by in RCA: 115] [Article Influence: 10.5] [Reference Citation Analysis (0)] |
| 22. | Craig O, O’Neill S, O’Neill F, McLaughlin P, McGarrigle A, McWilliams S, O’Connor O, Desmond A, Walsh EK, Ryan M. Diagnostic accuracy of computed tomography using lower doses of radiation for patients with Crohn’s disease. Clin Gastroenterol Hepatol. 2012;10:886-892. [RCA] [PubMed] [DOI] [Full Text] [Cited by in Crossref: 41] [Cited by in RCA: 42] [Article Influence: 3.2] [Reference Citation Analysis (0)] |
| 23. | Gore RM, Balthazar EJ, Ghahremani GG, Miller FH. CT features of ulcerative colitis and Crohn’s disease. AJR Am J Roentgenol. 1996;167:3-15. [RCA] [PubMed] [DOI] [Full Text] [Cited by in Crossref: 281] [Cited by in RCA: 213] [Article Influence: 7.3] [Reference Citation Analysis (0)] |
| 24. | Norland CC, Kirsner JB. Toxic dilatation of colon (toxic megacolon): etiology, treatment and prognosis in 42 patients. Medicine (Baltimore). 1969;48:229-250. [RCA] [PubMed] [DOI] [Full Text] [Cited by in Crossref: 68] [Cited by in RCA: 41] [Article Influence: 0.7] [Reference Citation Analysis (0)] |
| 25. | Ahualli J. The fat halo sign. Radiology. 2007;242:945-946. [RCA] [PubMed] [DOI] [Full Text] [Cited by in Crossref: 34] [Cited by in RCA: 35] [Article Influence: 1.9] [Reference Citation Analysis (0)] |
| 26. | Perlman SB, Hall BS, Reichelderfer M. PET/CT imaging of inflammatory bowel disease. Semin Nucl Med. 2013;43:420-426. [RCA] [PubMed] [DOI] [Full Text] [Cited by in Crossref: 37] [Cited by in RCA: 46] [Article Influence: 4.2] [Reference Citation Analysis (0)] |
| 27. | Louis E, Ancion G, Colard A, Spote V, Belaiche J, Hustinx R. Noninvasive assessment of Crohn’s disease intestinal lesions with (18)F-FDG PET/CT. J Nucl Med. 2007;48:1053-1059. [PubMed] |


